

Key Insights
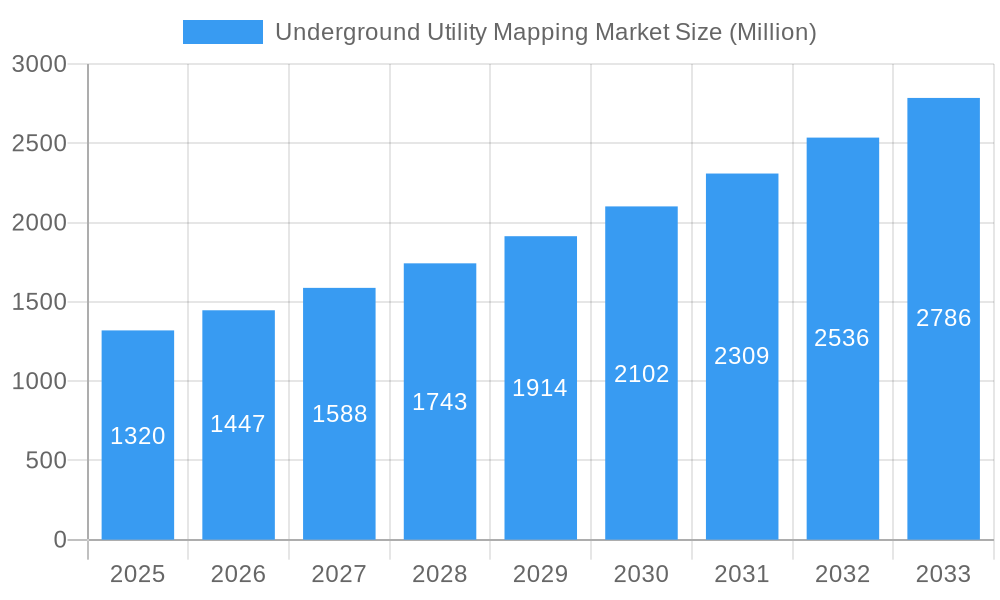
The Underground Utility Mapping market is experiencing robust growth, projected to reach a market size of $1.32 billion in 2025 and maintain a Compound Annual Growth Rate (CAGR) exceeding 9.61% from 2025 to 2033. This expansion is fueled by several key drivers. Increasing urbanization and infrastructure development necessitate precise and comprehensive utility mapping to prevent costly damages during excavation projects. Furthermore, stringent safety regulations and rising awareness of the risks associated with damaging underground utilities are compelling governments and private companies to adopt advanced mapping technologies. The rising adoption of non-destructive testing techniques, such as ground-penetrating radar (GPR) and electromagnetic surveying, is significantly boosting market growth. Technological advancements, like the integration of GIS (Geographic Information Systems) and improved data analysis capabilities, are enhancing the accuracy and efficiency of underground utility mapping, further fueling market expansion. The market is segmented by component type (solutions and services) and end-user industry (public safety, oil and gas, building and construction, telecommunication, electricity, and others). Solutions encompass hardware, software, and data acquisition, while services cover data processing, analysis, and integration. The significant contribution of the public safety, oil & gas, and building & construction sectors to the market indicates a broad spectrum of applications.
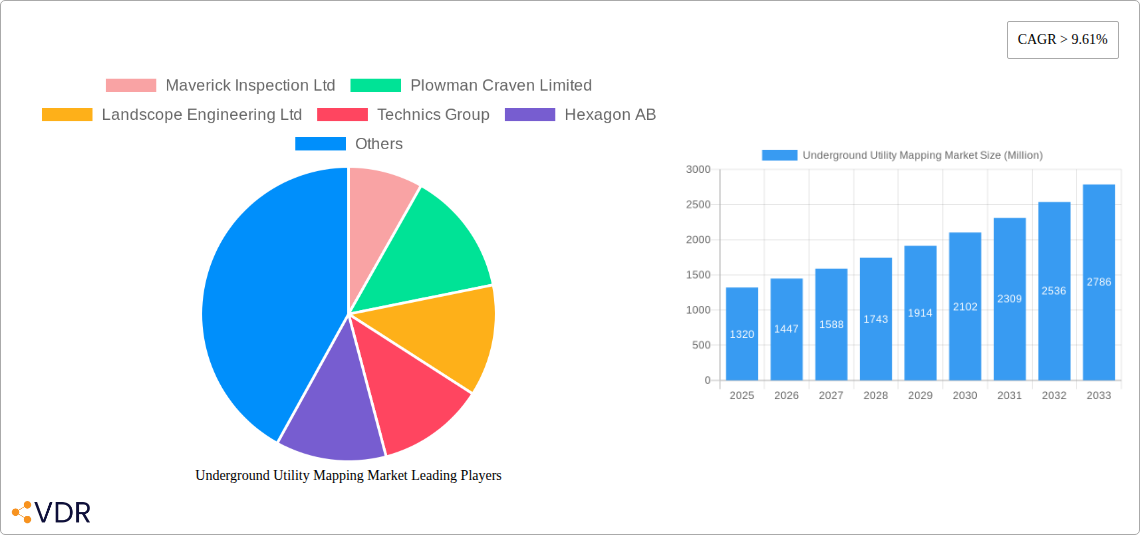
Underground Utility Mapping Market Market Size (In Billion)
Competition in the market is characterized by a mix of established players and emerging technology providers. Key players like Hexagon AB, Vivax-Metrotech Corp, and GSSI Geophysical Survey Systems Inc. are leveraging their experience and technological advancements to maintain a strong market presence. However, the market is also seeing increased innovation from smaller, specialized firms offering niche solutions and services. Geographical expansion, particularly in rapidly developing regions of Asia-Pacific and the Middle East & Africa, presents significant growth opportunities. While challenges like high initial investment costs for advanced technologies and the need for skilled personnel may pose some restraints, the overall market outlook for underground utility mapping remains highly positive, driven by the undeniable need for safe and efficient infrastructure management worldwide.
Underground Utility Mapping Market Company Market Share
Underground Utility Mapping Market: A Comprehensive Report (2019-2033)
This comprehensive report provides an in-depth analysis of the Underground Utility Mapping market, encompassing market dynamics, growth trends, regional performance, product landscape, and key players. The study period covers 2019-2033, with 2025 as the base and estimated year. This report is invaluable for industry professionals, investors, and researchers seeking a thorough understanding of this dynamic sector. The parent market is the broader Geospatial technology sector while the child market includes specific applications within infrastructure development and utility management. The market is projected to reach xx Million by 2033.
Underground Utility Mapping Market Market Dynamics & Structure
The Underground Utility Mapping market is characterized by moderate concentration, with several key players holding significant market share. Technological innovation, particularly in AI and sensor technologies, is a crucial driver, while stringent regulatory frameworks influence adoption rates. Competitive substitutes, such as traditional surveying methods, continue to exist, but their limitations are increasingly evident. End-user demographics are shifting towards greater adoption among large-scale infrastructure projects and utility companies. The market also witnesses occasional M&A activity, though the frequency is not extremely high.
- Market Concentration: Moderately concentrated, with top 5 players holding approximately 45% market share in 2024.
- Technological Innovation: AI-powered solutions, advanced sensor technologies, and improved data analytics are key drivers.
- Regulatory Frameworks: Stringent safety regulations and data privacy concerns influence market dynamics.
- Competitive Substitutes: Traditional manual surveying methods pose some competition, but are being gradually replaced.
- M&A Activity: An average of 5-7 significant M&A deals per year in the past five years within the underground utility mapping space.
- Innovation Barriers: High initial investment costs for advanced technologies, along with the need for specialized skills, can hinder innovation.
Underground Utility Mapping Market Growth Trends & Insights
The Underground Utility Mapping market experienced a CAGR of xx% during the historical period (2019-2024) and is projected to witness a CAGR of xx% during the forecast period (2025-2033). This growth is fueled by increasing infrastructure development globally, rising demand for accurate utility mapping to prevent damages, and the adoption of advanced technologies. The market penetration rate is increasing steadily, with a significant shift towards AI-powered solutions. Changing consumer behavior towards proactive risk mitigation and compliance with safety regulations further boosts adoption. Technological disruptions, particularly in sensor and data analytics, are creating new opportunities for market expansion.
Dominant Regions, Countries, or Segments in Underground Utility Mapping Market
North America currently dominates the Underground Utility Mapping market, driven by substantial infrastructure investment and a relatively advanced technological landscape. Within this region, the United States holds the largest market share due to extensive utility networks and increasing focus on infrastructure modernization. The Building and Construction sector is currently the leading end-user segment globally, followed by the Oil and Gas sector. Solutions (software and hardware) segment is the larger portion, while the Services segment also shows considerable growth as many customers prefer the combination. Europe and Asia-Pacific are also experiencing considerable growth, primarily driven by urbanization and increasing infrastructure projects.
- Key Drivers (North America): Robust infrastructure spending, stringent safety regulations, and early adoption of advanced technologies.
- Key Drivers (Europe): Increasing urbanization, government initiatives promoting digitalization, and rising safety concerns.
- Key Drivers (Asia-Pacific): Rapid urbanization, burgeoning infrastructure projects, and government investments in smart city initiatives.
- Building and Construction Segment Dominance: High demand for accurate utility mapping to prevent damages during construction activities.
- Solutions Segment Dominance: Higher initial investment but provides greater long term efficiency.
Underground Utility Mapping Market Product Landscape
The Underground Utility Mapping market offers a diverse range of solutions, from traditional ground-penetrating radar (GPR) systems to advanced AI-powered mapping platforms. These solutions are characterized by increasing accuracy, improved data visualization capabilities, and seamless integration with other GIS systems. Unique selling propositions often include real-time data analysis, enhanced safety features, and cost-effective solutions. Recent technological advancements focus on improving data processing speeds, enhancing the accuracy of underground utility detection, and developing user-friendly interfaces.
Key Drivers, Barriers & Challenges in Underground Utility Mapping Market
Key Drivers: Increasing infrastructure development, growing concerns about safety and damage prevention, and the adoption of advanced technologies like AI and machine learning are primary growth drivers. Government regulations mandating accurate utility mapping further fuel market expansion.
Key Challenges: High initial investment costs for advanced technologies, a shortage of skilled professionals, and the complexity of integrating data from multiple sources present significant challenges. Competition from traditional methods and data security concerns also hinder market growth. The impact of these challenges is estimated to reduce market growth by approximately 5% annually.
Emerging Opportunities in Underground Utility Mapping Market
Emerging opportunities exist in leveraging IoT and Big Data analytics to optimize utility management. Expanding into untapped markets, such as developing countries with growing infrastructure needs, presents significant potential. The development of more cost-effective, user-friendly solutions can also broaden market reach. The integration of drone technology for aerial surveying is another emerging trend that allows for faster and more comprehensive mapping.
Growth Accelerators in the Underground Utility Mapping Market Industry
Strategic partnerships between technology providers and infrastructure developers are accelerating market growth. Government incentives and policies promoting digitalization and infrastructure development further catalyze expansion. Technological breakthroughs, such as enhanced sensor technology and AI algorithms, continue to improve the efficiency and accuracy of underground utility mapping.
Key Players Shaping the Underground Utility Mapping Market Market
- Maverick Inspection Ltd
- Plowman Craven Limited
- Landscope Engineering Ltd
- Technics Group
- Hexagon AB
- Red Laser Scanning
- Vivax-Metrotech Corp
- GSSI Geophysical Survey Systems Inc
- multiVIEW Locates Inc
- Geospatial Corporation
Notable Milestones in Underground Utility Mapping Market Sector
- March 2024: WSB LLC partnered with 4M Analytics to leverage AI for subsurface utility mapping, enhancing data integrity and real-time delivery for infrastructure projects.
- February 2024: Exodigo announced its participation in the GOPHURRS program, providing accurate subsurface maps to improve undergrounding processes for power lines.
In-Depth Underground Utility Mapping Market Market Outlook
The Underground Utility Mapping market is poised for robust growth driven by ongoing infrastructure development globally, rising safety concerns, and continuous technological advancements. Strategic partnerships, coupled with government initiatives promoting digitalization, will further accelerate market expansion. The increasing adoption of AI and improved data analytics will enhance the efficiency and accuracy of utility mapping solutions, unlocking new opportunities and shaping the future of this dynamic sector.
Underground Utility Mapping Market Segmentation
-
1. Component Type
-
1.1. Solutions
- 1.1.1. Ground Penetrating Radar
- 1.1.2. Electromagnetic Locators
- 1.1.3. Other Solutions
- 1.2. Services
-
1.1. Solutions
-
2. End-user Industry
- 2.1. Public Safety
- 2.2. Oil and Gas
- 2.3. Building and Construction
- 2.4. Telecommunication
- 2.5. Electricity
- 2.6. Other End-user Industries
Underground Utility Mapping Market Segmentation By Geography
- 1. North America
- 2. Europe
- 3. Asia
- 4. Australia and New Zealand
- 5. Latin America
- 6. Middle East and Africa
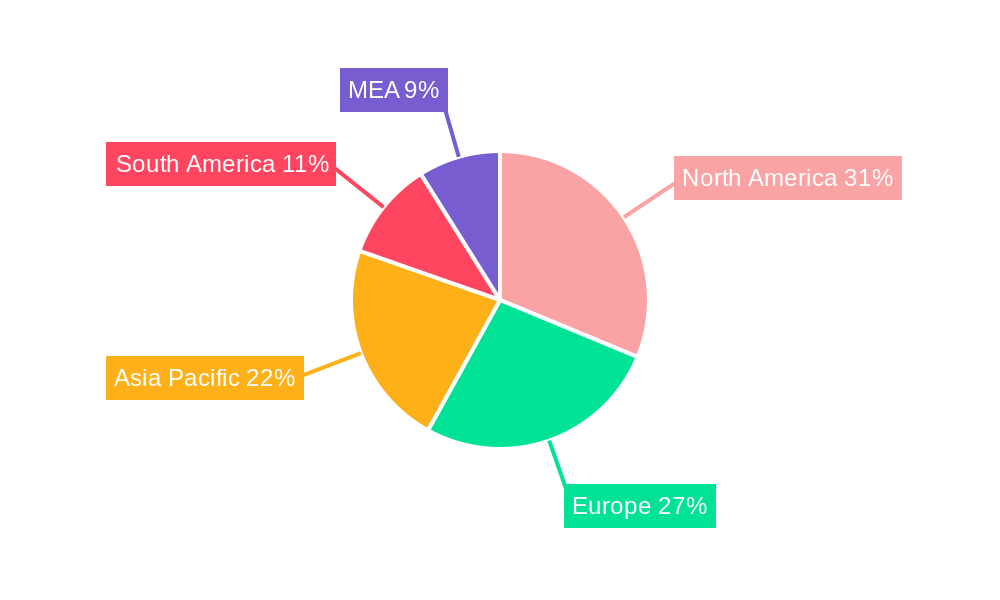
Underground Utility Mapping Market Regional Market Share
Geographic Coverage of Underground Utility Mapping Market
Underground Utility Mapping Market REPORT HIGHLIGHTS
| Aspects | Details |
|---|---|
| Study Period | 2020-2034 |
| Base Year | 2025 |
| Estimated Year | 2026 |
| Forecast Period | 2026-2034 |
| Historical Period | 2020-2025 |
| Growth Rate | CAGR of > 9.61% from 2020-2034 |
| Segmentation |
|
Table of Contents
- 1. Introduction
- 1.1. Research Scope
- 1.2. Market Segmentation
- 1.3. Research Methodology
- 1.4. Definitions and Assumptions
- 2. Executive Summary
- 2.1. Introduction
- 3. Market Dynamics
- 3.1. Introduction
- 3.2. Market Drivers
- 3.2.1. Emerging Technologies Combined With Utility Maps to Improve the Exploration Activities; Increasing Availability of Detecting Applications and Increased Return on Marketing Spending
- 3.3. Market Restrains
- 3.3.1. High Initial Investment Cost To Hinder Market Growth
- 3.4. Market Trends
- 3.4.1. Ground Penetrating Radar is Expected to be the Largest Component Type Solution
- 4. Market Factor Analysis
- 4.1. Porters Five Forces
- 4.2. Supply/Value Chain
- 4.3. PESTEL analysis
- 4.4. Market Entropy
- 4.5. Patent/Trademark Analysis
- 5. Global Underground Utility Mapping Market Analysis, Insights and Forecast, 2020-2032
- 5.1. Market Analysis, Insights and Forecast - by Component Type
- 5.1.1. Solutions
- 5.1.1.1. Ground Penetrating Radar
- 5.1.1.2. Electromagnetic Locators
- 5.1.1.3. Other Solutions
- 5.1.2. Services
- 5.1.1. Solutions
- 5.2. Market Analysis, Insights and Forecast - by End-user Industry
- 5.2.1. Public Safety
- 5.2.2. Oil and Gas
- 5.2.3. Building and Construction
- 5.2.4. Telecommunication
- 5.2.5. Electricity
- 5.2.6. Other End-user Industries
- 5.3. Market Analysis, Insights and Forecast - by Region
- 5.3.1. North America
- 5.3.2. Europe
- 5.3.3. Asia
- 5.3.4. Australia and New Zealand
- 5.3.5. Latin America
- 5.3.6. Middle East and Africa
- 5.1. Market Analysis, Insights and Forecast - by Component Type
- 6. North America Underground Utility Mapping Market Analysis, Insights and Forecast, 2020-2032
- 6.1. Market Analysis, Insights and Forecast - by Component Type
- 6.1.1. Solutions
- 6.1.1.1. Ground Penetrating Radar
- 6.1.1.2. Electromagnetic Locators
- 6.1.1.3. Other Solutions
- 6.1.2. Services
- 6.1.1. Solutions
- 6.2. Market Analysis, Insights and Forecast - by End-user Industry
- 6.2.1. Public Safety
- 6.2.2. Oil and Gas
- 6.2.3. Building and Construction
- 6.2.4. Telecommunication
- 6.2.5. Electricity
- 6.2.6. Other End-user Industries
- 6.1. Market Analysis, Insights and Forecast - by Component Type
- 7. Europe Underground Utility Mapping Market Analysis, Insights and Forecast, 2020-2032
- 7.1. Market Analysis, Insights and Forecast - by Component Type
- 7.1.1. Solutions
- 7.1.1.1. Ground Penetrating Radar
- 7.1.1.2. Electromagnetic Locators
- 7.1.1.3. Other Solutions
- 7.1.2. Services
- 7.1.1. Solutions
- 7.2. Market Analysis, Insights and Forecast - by End-user Industry
- 7.2.1. Public Safety
- 7.2.2. Oil and Gas
- 7.2.3. Building and Construction
- 7.2.4. Telecommunication
- 7.2.5. Electricity
- 7.2.6. Other End-user Industries
- 7.1. Market Analysis, Insights and Forecast - by Component Type
- 8. Asia Underground Utility Mapping Market Analysis, Insights and Forecast, 2020-2032
- 8.1. Market Analysis, Insights and Forecast - by Component Type
- 8.1.1. Solutions
- 8.1.1.1. Ground Penetrating Radar
- 8.1.1.2. Electromagnetic Locators
- 8.1.1.3. Other Solutions
- 8.1.2. Services
- 8.1.1. Solutions
- 8.2. Market Analysis, Insights and Forecast - by End-user Industry
- 8.2.1. Public Safety
- 8.2.2. Oil and Gas
- 8.2.3. Building and Construction
- 8.2.4. Telecommunication
- 8.2.5. Electricity
- 8.2.6. Other End-user Industries
- 8.1. Market Analysis, Insights and Forecast - by Component Type
- 9. Australia and New Zealand Underground Utility Mapping Market Analysis, Insights and Forecast, 2020-2032
- 9.1. Market Analysis, Insights and Forecast - by Component Type
- 9.1.1. Solutions
- 9.1.1.1. Ground Penetrating Radar
- 9.1.1.2. Electromagnetic Locators
- 9.1.1.3. Other Solutions
- 9.1.2. Services
- 9.1.1. Solutions
- 9.2. Market Analysis, Insights and Forecast - by End-user Industry
- 9.2.1. Public Safety
- 9.2.2. Oil and Gas
- 9.2.3. Building and Construction
- 9.2.4. Telecommunication
- 9.2.5. Electricity
- 9.2.6. Other End-user Industries
- 9.1. Market Analysis, Insights and Forecast - by Component Type
- 10. Latin America Underground Utility Mapping Market Analysis, Insights and Forecast, 2020-2032
- 10.1. Market Analysis, Insights and Forecast - by Component Type
- 10.1.1. Solutions
- 10.1.1.1. Ground Penetrating Radar
- 10.1.1.2. Electromagnetic Locators
- 10.1.1.3. Other Solutions
- 10.1.2. Services
- 10.1.1. Solutions
- 10.2. Market Analysis, Insights and Forecast - by End-user Industry
- 10.2.1. Public Safety
- 10.2.2. Oil and Gas
- 10.2.3. Building and Construction
- 10.2.4. Telecommunication
- 10.2.5. Electricity
- 10.2.6. Other End-user Industries
- 10.1. Market Analysis, Insights and Forecast - by Component Type
- 11. Middle East and Africa Underground Utility Mapping Market Analysis, Insights and Forecast, 2020-2032
- 11.1. Market Analysis, Insights and Forecast - by Component Type
- 11.1.1. Solutions
- 11.1.1.1. Ground Penetrating Radar
- 11.1.1.2. Electromagnetic Locators
- 11.1.1.3. Other Solutions
- 11.1.2. Services
- 11.1.1. Solutions
- 11.2. Market Analysis, Insights and Forecast - by End-user Industry
- 11.2.1. Public Safety
- 11.2.2. Oil and Gas
- 11.2.3. Building and Construction
- 11.2.4. Telecommunication
- 11.2.5. Electricity
- 11.2.6. Other End-user Industries
- 11.1. Market Analysis, Insights and Forecast - by Component Type
- 12. Competitive Analysis
- 12.1. Global Market Share Analysis 2025
- 12.2. Company Profiles
- 12.2.1 Maverick Inspection Ltd
- 12.2.1.1. Overview
- 12.2.1.2. Products
- 12.2.1.3. SWOT Analysis
- 12.2.1.4. Recent Developments
- 12.2.1.5. Financials (Based on Availability)
- 12.2.2 Plowman Craven Limited
- 12.2.2.1. Overview
- 12.2.2.2. Products
- 12.2.2.3. SWOT Analysis
- 12.2.2.4. Recent Developments
- 12.2.2.5. Financials (Based on Availability)
- 12.2.3 Landscope Engineering Ltd
- 12.2.3.1. Overview
- 12.2.3.2. Products
- 12.2.3.3. SWOT Analysis
- 12.2.3.4. Recent Developments
- 12.2.3.5. Financials (Based on Availability)
- 12.2.4 Technics Group
- 12.2.4.1. Overview
- 12.2.4.2. Products
- 12.2.4.3. SWOT Analysis
- 12.2.4.4. Recent Developments
- 12.2.4.5. Financials (Based on Availability)
- 12.2.5 Hexagon AB
- 12.2.5.1. Overview
- 12.2.5.2. Products
- 12.2.5.3. SWOT Analysis
- 12.2.5.4. Recent Developments
- 12.2.5.5. Financials (Based on Availability)
- 12.2.6 Red Laser Scanning
- 12.2.6.1. Overview
- 12.2.6.2. Products
- 12.2.6.3. SWOT Analysis
- 12.2.6.4. Recent Developments
- 12.2.6.5. Financials (Based on Availability)
- 12.2.7 Vivax-Metrotech Corp
- 12.2.7.1. Overview
- 12.2.7.2. Products
- 12.2.7.3. SWOT Analysis
- 12.2.7.4. Recent Developments
- 12.2.7.5. Financials (Based on Availability)
- 12.2.8 GSSI Geophysical Survey Systems Inc
- 12.2.8.1. Overview
- 12.2.8.2. Products
- 12.2.8.3. SWOT Analysis
- 12.2.8.4. Recent Developments
- 12.2.8.5. Financials (Based on Availability)
- 12.2.9 multiVIEW Locates Inc
- 12.2.9.1. Overview
- 12.2.9.2. Products
- 12.2.9.3. SWOT Analysis
- 12.2.9.4. Recent Developments
- 12.2.9.5. Financials (Based on Availability)
- 12.2.10 Geospatial Corporation
- 12.2.10.1. Overview
- 12.2.10.2. Products
- 12.2.10.3. SWOT Analysis
- 12.2.10.4. Recent Developments
- 12.2.10.5. Financials (Based on Availability)
- 12.2.1 Maverick Inspection Ltd
List of Figures
- Figure 1: Global Underground Utility Mapping Market Revenue Breakdown (Million, %) by Region 2025 & 2033
- Figure 2: North America Underground Utility Mapping Market Revenue (Million), by Component Type 2025 & 2033
- Figure 3: North America Underground Utility Mapping Market Revenue Share (%), by Component Type 2025 & 2033
- Figure 4: North America Underground Utility Mapping Market Revenue (Million), by End-user Industry 2025 & 2033
- Figure 5: North America Underground Utility Mapping Market Revenue Share (%), by End-user Industry 2025 & 2033
- Figure 6: North America Underground Utility Mapping Market Revenue (Million), by Country 2025 & 2033
- Figure 7: North America Underground Utility Mapping Market Revenue Share (%), by Country 2025 & 2033
- Figure 8: Europe Underground Utility Mapping Market Revenue (Million), by Component Type 2025 & 2033
- Figure 9: Europe Underground Utility Mapping Market Revenue Share (%), by Component Type 2025 & 2033
- Figure 10: Europe Underground Utility Mapping Market Revenue (Million), by End-user Industry 2025 & 2033
- Figure 11: Europe Underground Utility Mapping Market Revenue Share (%), by End-user Industry 2025 & 2033
- Figure 12: Europe Underground Utility Mapping Market Revenue (Million), by Country 2025 & 2033
- Figure 13: Europe Underground Utility Mapping Market Revenue Share (%), by Country 2025 & 2033
- Figure 14: Asia Underground Utility Mapping Market Revenue (Million), by Component Type 2025 & 2033
- Figure 15: Asia Underground Utility Mapping Market Revenue Share (%), by Component Type 2025 & 2033
- Figure 16: Asia Underground Utility Mapping Market Revenue (Million), by End-user Industry 2025 & 2033
- Figure 17: Asia Underground Utility Mapping Market Revenue Share (%), by End-user Industry 2025 & 2033
- Figure 18: Asia Underground Utility Mapping Market Revenue (Million), by Country 2025 & 2033
- Figure 19: Asia Underground Utility Mapping Market Revenue Share (%), by Country 2025 & 2033
- Figure 20: Australia and New Zealand Underground Utility Mapping Market Revenue (Million), by Component Type 2025 & 2033
- Figure 21: Australia and New Zealand Underground Utility Mapping Market Revenue Share (%), by Component Type 2025 & 2033
- Figure 22: Australia and New Zealand Underground Utility Mapping Market Revenue (Million), by End-user Industry 2025 & 2033
- Figure 23: Australia and New Zealand Underground Utility Mapping Market Revenue Share (%), by End-user Industry 2025 & 2033
- Figure 24: Australia and New Zealand Underground Utility Mapping Market Revenue (Million), by Country 2025 & 2033
- Figure 25: Australia and New Zealand Underground Utility Mapping Market Revenue Share (%), by Country 2025 & 2033
- Figure 26: Latin America Underground Utility Mapping Market Revenue (Million), by Component Type 2025 & 2033
- Figure 27: Latin America Underground Utility Mapping Market Revenue Share (%), by Component Type 2025 & 2033
- Figure 28: Latin America Underground Utility Mapping Market Revenue (Million), by End-user Industry 2025 & 2033
- Figure 29: Latin America Underground Utility Mapping Market Revenue Share (%), by End-user Industry 2025 & 2033
- Figure 30: Latin America Underground Utility Mapping Market Revenue (Million), by Country 2025 & 2033
- Figure 31: Latin America Underground Utility Mapping Market Revenue Share (%), by Country 2025 & 2033
- Figure 32: Middle East and Africa Underground Utility Mapping Market Revenue (Million), by Component Type 2025 & 2033
- Figure 33: Middle East and Africa Underground Utility Mapping Market Revenue Share (%), by Component Type 2025 & 2033
- Figure 34: Middle East and Africa Underground Utility Mapping Market Revenue (Million), by End-user Industry 2025 & 2033
- Figure 35: Middle East and Africa Underground Utility Mapping Market Revenue Share (%), by End-user Industry 2025 & 2033
- Figure 36: Middle East and Africa Underground Utility Mapping Market Revenue (Million), by Country 2025 & 2033
- Figure 37: Middle East and Africa Underground Utility Mapping Market Revenue Share (%), by Country 2025 & 2033
List of Tables
- Table 1: Global Underground Utility Mapping Market Revenue Million Forecast, by Component Type 2020 & 2033
- Table 2: Global Underground Utility Mapping Market Revenue Million Forecast, by End-user Industry 2020 & 2033
- Table 3: Global Underground Utility Mapping Market Revenue Million Forecast, by Region 2020 & 2033
- Table 4: Global Underground Utility Mapping Market Revenue Million Forecast, by Component Type 2020 & 2033
- Table 5: Global Underground Utility Mapping Market Revenue Million Forecast, by End-user Industry 2020 & 2033
- Table 6: Global Underground Utility Mapping Market Revenue Million Forecast, by Country 2020 & 2033
- Table 7: Global Underground Utility Mapping Market Revenue Million Forecast, by Component Type 2020 & 2033
- Table 8: Global Underground Utility Mapping Market Revenue Million Forecast, by End-user Industry 2020 & 2033
- Table 9: Global Underground Utility Mapping Market Revenue Million Forecast, by Country 2020 & 2033
- Table 10: Global Underground Utility Mapping Market Revenue Million Forecast, by Component Type 2020 & 2033
- Table 11: Global Underground Utility Mapping Market Revenue Million Forecast, by End-user Industry 2020 & 2033
- Table 12: Global Underground Utility Mapping Market Revenue Million Forecast, by Country 2020 & 2033
- Table 13: Global Underground Utility Mapping Market Revenue Million Forecast, by Component Type 2020 & 2033
- Table 14: Global Underground Utility Mapping Market Revenue Million Forecast, by End-user Industry 2020 & 2033
- Table 15: Global Underground Utility Mapping Market Revenue Million Forecast, by Country 2020 & 2033
- Table 16: Global Underground Utility Mapping Market Revenue Million Forecast, by Component Type 2020 & 2033
- Table 17: Global Underground Utility Mapping Market Revenue Million Forecast, by End-user Industry 2020 & 2033
- Table 18: Global Underground Utility Mapping Market Revenue Million Forecast, by Country 2020 & 2033
- Table 19: Global Underground Utility Mapping Market Revenue Million Forecast, by Component Type 2020 & 2033
- Table 20: Global Underground Utility Mapping Market Revenue Million Forecast, by End-user Industry 2020 & 2033
- Table 21: Global Underground Utility Mapping Market Revenue Million Forecast, by Country 2020 & 2033
Frequently Asked Questions
1. What is the projected Compound Annual Growth Rate (CAGR) of the Underground Utility Mapping Market?
The projected CAGR is approximately > 9.61%.
2. Which companies are prominent players in the Underground Utility Mapping Market?
Key companies in the market include Maverick Inspection Ltd, Plowman Craven Limited, Landscope Engineering Ltd, Technics Group, Hexagon AB, Red Laser Scanning, Vivax-Metrotech Corp, GSSI Geophysical Survey Systems Inc, multiVIEW Locates Inc, Geospatial Corporation.
3. What are the main segments of the Underground Utility Mapping Market?
The market segments include Component Type, End-user Industry.
4. Can you provide details about the market size?
The market size is estimated to be USD 1.32 Million as of 2022.
5. What are some drivers contributing to market growth?
Emerging Technologies Combined With Utility Maps to Improve the Exploration Activities; Increasing Availability of Detecting Applications and Increased Return on Marketing Spending.
6. What are the notable trends driving market growth?
Ground Penetrating Radar is Expected to be the Largest Component Type Solution.
7. Are there any restraints impacting market growth?
High Initial Investment Cost To Hinder Market Growth.
8. Can you provide examples of recent developments in the market?
March 2024: WSB LLC (“WSB”), one of the nation’s fastest-growing infrastructure engineering and consulting firms, partnered with 4M Analytics, the nation’s leading subsurface utility AI mapping and analytics solution. This partnership is intended to support infrastructure projects across the United States, focusing on data integrity and real-time digital delivery. Leveraging artificial intelligence, computer vision, and change detection techniques, 4M Analytics synthesizes, digitizes, and geo-locates millions of utility data sources into a single platform and visually validates each line using vertical and horizontal imagery dating back to the 1940s. This enables ‘real-time’ access to the utility landscape for infrastructure projects through an intuitive user interface. The mapping resources will decrease the time it takes to locate underground utilities for owners, civil engineering firms, general contractors, subsurface utility engineering firms, and many other utility stakeholders.
9. What pricing options are available for accessing the report?
Pricing options include single-user, multi-user, and enterprise licenses priced at USD 4750, USD 5250, and USD 8750 respectively.
10. Is the market size provided in terms of value or volume?
The market size is provided in terms of value, measured in Million.
11. Are there any specific market keywords associated with the report?
Yes, the market keyword associated with the report is "Underground Utility Mapping Market," which aids in identifying and referencing the specific market segment covered.
12. How do I determine which pricing option suits my needs best?
The pricing options vary based on user requirements and access needs. Individual users may opt for single-user licenses, while businesses requiring broader access may choose multi-user or enterprise licenses for cost-effective access to the report.
13. Are there any additional resources or data provided in the Underground Utility Mapping Market report?
While the report offers comprehensive insights, it's advisable to review the specific contents or supplementary materials provided to ascertain if additional resources or data are available.
14. How can I stay updated on further developments or reports in the Underground Utility Mapping Market?
To stay informed about further developments, trends, and reports in the Underground Utility Mapping Market, consider subscribing to industry newsletters, following relevant companies and organizations, or regularly checking reputable industry news sources and publications.
Methodology
Step 1 - Identification of Relevant Samples Size from Population Database


Step 2 - Approaches for Defining Global Market Size (Value, Volume* & Price*)

Note*: In applicable scenarios
Step 3 - Data Sources
Primary Research
- Web Analytics
- Survey Reports
- Research Institute
- Latest Research Reports
- Opinion Leaders
Secondary Research
- Annual Reports
- White Paper
- Latest Press Release
- Industry Association
- Paid Database
- Investor Presentations

Step 4 - Data Triangulation
Involves using different sources of information in order to increase the validity of a study
These sources are likely to be stakeholders in a program - participants, other researchers, program staff, other community members, and so on.
Then we put all data in single framework & apply various statistical tools to find out the dynamic on the market.
During the analysis stage, feedback from the stakeholder groups would be compared to determine areas of agreement as well as areas of divergence