

Key Insights
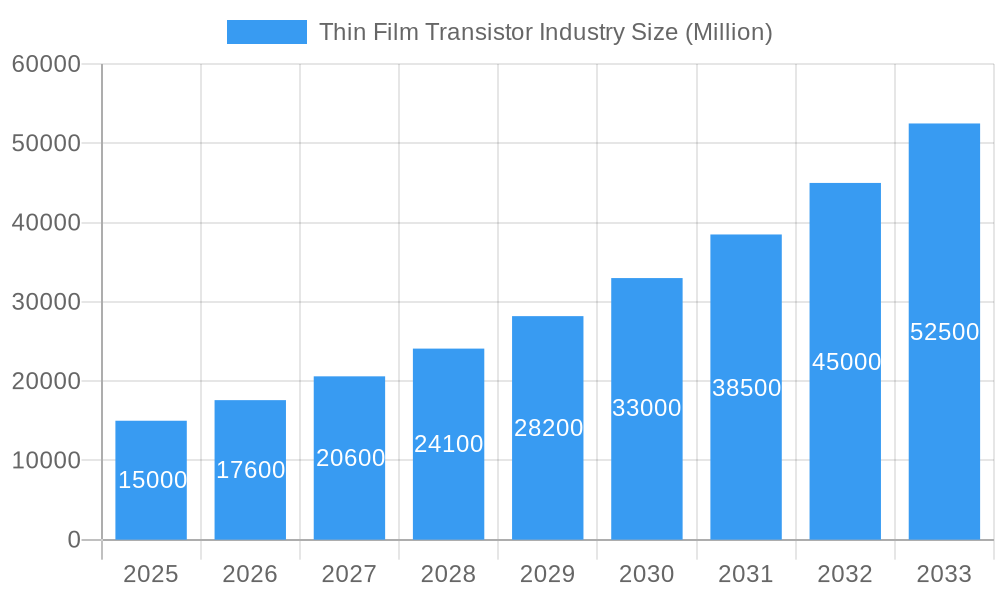
The Thin Film Transistor (TFT) industry is experiencing robust growth, projected to reach a substantial market size, driven by the increasing demand for high-resolution displays across various sectors. The 17.34% Compound Annual Growth Rate (CAGR) from 2019 to 2024 indicates a significant upward trajectory. This expansion is fueled by several key factors. The proliferation of smartphones, tablets, and other consumer electronics necessitates advanced display technologies, bolstering demand for TFTs. Furthermore, the automotive industry's integration of larger, higher-resolution infotainment systems and advanced driver-assistance systems (ADAS) is a major growth driver. The burgeoning healthcare sector, with its increasing reliance on medical imaging and diagnostic displays, also contributes significantly. The market is segmented by fabrication type (organic and inorganic), product type (LCD, LED, e-paper, AMOLED), and end-user industry. While organic TFTs present opportunities for flexible displays, inorganic TFTs continue to dominate due to their established technology and cost-effectiveness. The shift towards larger display sizes and higher resolutions across all sectors further strengthens the market's growth prospects. Competitive pressures among leading manufacturers like LG Display, Samsung, BOE Technology, and others are driving innovation and cost reduction, further benefitting the industry's overall expansion.
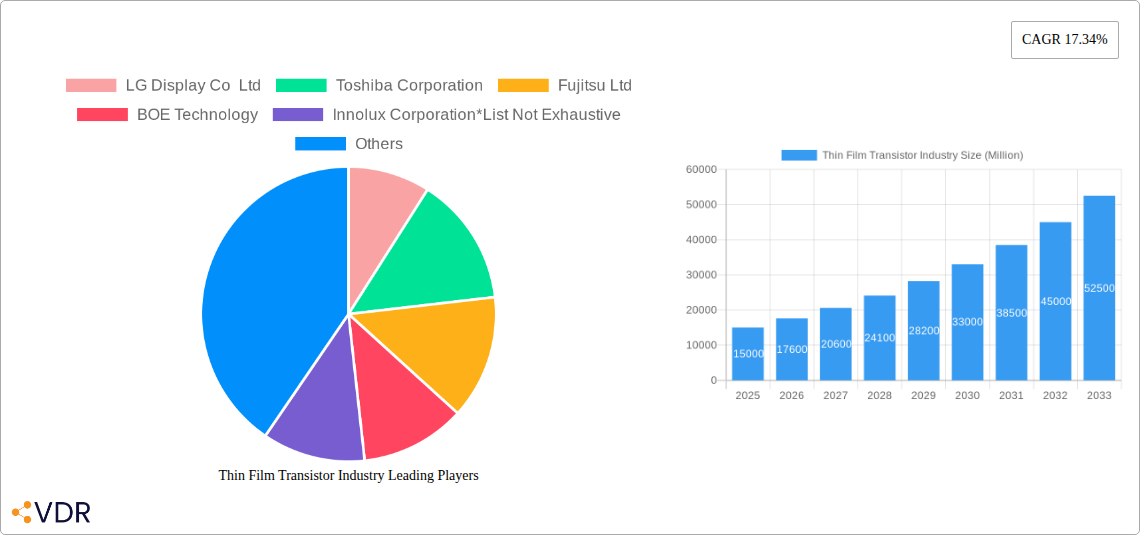
Thin Film Transistor Industry Market Size (In Billion)
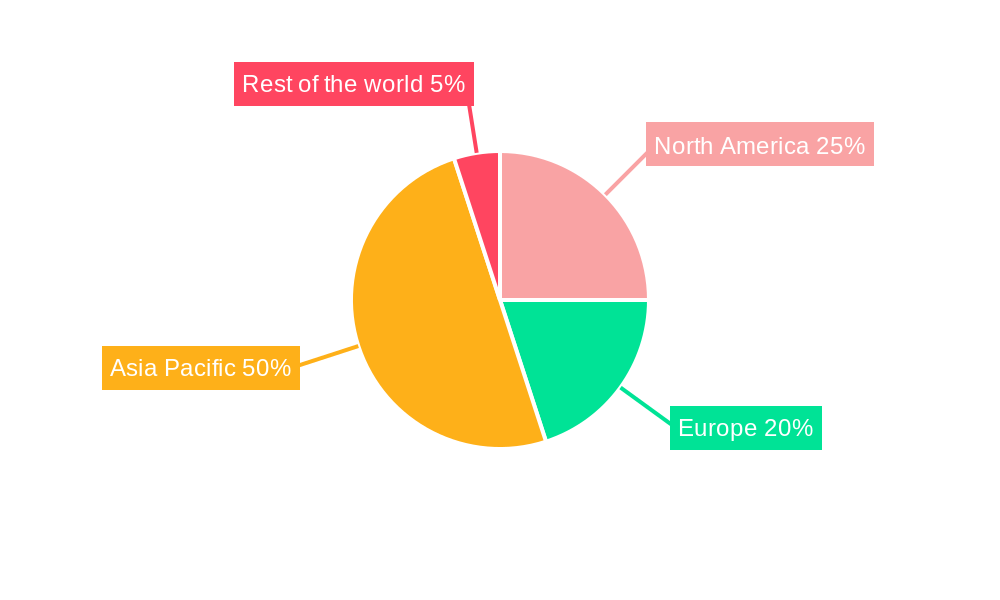
Looking ahead to 2033, continued technological advancements, particularly in flexible and foldable displays, are poised to shape the market. The adoption of advanced manufacturing techniques and materials will also play a critical role. While potential restraints such as raw material costs and supply chain disruptions exist, the overall positive market outlook remains strong due to the sustained and expanding demand from diverse sectors. The Asia-Pacific region, driven by significant manufacturing and consumer electronics hubs, is expected to maintain a considerable market share, though North America and Europe will also contribute significantly. The market will witness a continuous evolution in display technologies, with advancements in AMOLED and other high-performance displays leading to new product innovations and expanded application areas. The overall market is projected for consistent, robust growth, driven by factors such as increasing demand for advanced display solutions, technological improvements and expansion across key market segments.
Thin Film Transistor Industry Company Market Share
Thin Film Transistor (TFT) Industry Market Report: 2019-2033
This comprehensive report provides an in-depth analysis of the Thin Film Transistor (TFT) industry, covering market dynamics, growth trends, regional dominance, product landscape, key players, and future outlook. The study period spans from 2019 to 2033, with 2025 serving as the base and estimated year. The report segments the market by fabrication type (organic, inorganic), product type (LCD, LED, e-paper display, AMOLED), and end-user industry (consumer electronics, automotive, BFSI, industrial, healthcare, others). The report projects a market size of xx Million units by 2033, driven by technological advancements and increasing demand across various sectors.
Thin Film Transistor Industry Market Dynamics & Structure
The TFT industry is characterized by moderate market concentration, with key players holding significant market share. The market is dynamic, influenced by continuous technological innovation, particularly in display technologies like AMOLED and flexible displays. Stringent regulatory frameworks concerning energy efficiency and material usage also play a vital role. Competitive pressures from alternative display technologies and the rise of flexible electronics are significant factors. M&A activity in the industry has been moderate, primarily focused on consolidation and expansion into new markets.
- Market Concentration: Moderately concentrated, with top 5 players holding approximately xx% of the market share in 2025.
- Technological Innovation: Significant investments in R&D focused on improving display resolution, energy efficiency, and flexibility.
- Regulatory Landscape: Increasingly stringent regulations on material usage and energy efficiency are driving innovation.
- Competitive Substitutes: OLED, microLED, and other emerging display technologies pose a competitive threat.
- M&A Activity: Moderate level of mergers and acquisitions, primarily driven by strategic expansion and consolidation.
Thin Film Transistor Industry Growth Trends & Insights
The TFT market experienced robust growth during the historical period (2019-2024), primarily fueled by the increasing demand for high-resolution displays in consumer electronics. The adoption rate of TFT displays across diverse applications continues to rise. However, technological disruptions, such as the emergence of more energy-efficient and flexible display technologies, pose both opportunities and challenges. Shifting consumer preferences toward foldable and flexible devices are also influencing market dynamics. The compound annual growth rate (CAGR) during the forecast period (2025-2033) is projected to be xx%, with market penetration reaching xx% by 2033. Specific regional variations in growth rates are also analyzed in the full report.
Dominant Regions, Countries, or Segments in Thin Film Transistor Industry
Asia-Pacific, specifically East Asia, dominates the global TFT market due to the concentration of major TFT manufacturers and strong consumer electronics demand. Within product types, LCDs still hold the largest market share, though AMOLED and flexible displays are experiencing significant growth. The consumer electronics segment remains the primary driver, followed by the automotive and industrial sectors.
- Key Drivers:
- Strong economic growth in Asia-Pacific.
- High demand for consumer electronics.
- Favorable government policies supporting the electronics industry.
- Technological advancements in display technologies.
- Dominance Factors:
- High manufacturing capacity in Asia-Pacific.
- Cost-effective production.
- Established supply chains.
Thin Film Transistor Industry Product Landscape
The TFT product landscape is continuously evolving, with innovations focused on enhancing display resolution, reducing power consumption, improving flexibility, and incorporating new functionalities. The development of high-resolution, energy-efficient AMOLED displays, and flexible thin film transistors is driving market growth. Key selling propositions include improved image quality, longer battery life, and enhanced design flexibility for various applications.
Key Drivers, Barriers & Challenges in Thin Film Transistor Industry
Key Drivers:
- Increasing demand for high-resolution displays in consumer electronics.
- Advancements in flexible display technology.
- Growing adoption of TFTs in automotive and industrial applications.
- Government initiatives promoting energy-efficient display technologies.
Key Challenges:
- Intense competition from alternative display technologies.
- Supply chain disruptions impacting component availability and pricing.
- Stringent environmental regulations.
- Fluctuations in raw material prices.
Emerging Opportunities in Thin Film Transistor Industry
Emerging opportunities exist in expanding TFT applications into new markets like wearable electronics, augmented reality (AR), and virtual reality (VR) devices. The increasing demand for flexible and foldable displays opens new avenues for growth. Further research into energy-efficient and cost-effective manufacturing processes will also contribute to market expansion.
Growth Accelerators in the Thin Film Transistor Industry
Technological advancements, strategic partnerships between TFT manufacturers and display integrators, and market expansion into emerging economies are significant growth accelerators. Continuous innovations in materials science and manufacturing processes further enhance efficiency and cost-effectiveness, paving the way for broader market penetration.
Key Players Shaping the Thin Film Transistor Industry Market
Notable Milestones in Thin Film Transistor Industry Sector
- 2020: Significant advancements in flexible AMOLED technology.
- 2022: Launch of new high-resolution TFT displays for automotive applications.
- 2023: Major partnership between key players for joint R&D in next-generation TFTs.
- 2024: Introduction of cost-effective manufacturing processes for flexible displays.
In-Depth Thin Film Transistor Industry Market Outlook
The future of the TFT industry is promising, driven by continuous technological advancements and expanding applications across diverse sectors. The focus on energy efficiency, flexibility, and cost reduction will continue to shape market dynamics. Strategic partnerships and innovative product development will be crucial for maintaining competitiveness in this rapidly evolving industry. The market is expected to experience sustained growth, driven by increasing demand from existing and new applications.
Thin Film Transistor Industry Segmentation
-
1. Fabrication Type
- 1.1. Organic
- 1.2. Inorganic
-
2. Product Type
- 2.1. Liquid Crystal Display
- 2.2. Light Emitting Diode
- 2.3. Electronic Paper Display
- 2.4. AMOLED
-
3. End-user Industry
- 3.1. Consumer Electronics
- 3.2. Automotive
- 3.3. BFSI
- 3.4. Industrial
- 3.5. Healthcare
- 3.6. Other End-user Industries
Thin Film Transistor Industry Segmentation By Geography
- 1. North America
- 2. Europe
- 3. Asia Pacific
- 4. Rest of the world
Thin Film Transistor Industry Regional Market Share
Geographic Coverage of Thin Film Transistor Industry
Thin Film Transistor Industry REPORT HIGHLIGHTS
| Aspects | Details |
|---|---|
| Study Period | 2020-2034 |
| Base Year | 2025 |
| Estimated Year | 2026 |
| Forecast Period | 2026-2034 |
| Historical Period | 2020-2025 |
| Growth Rate | CAGR of 6.9% from 2020-2034 |
| Segmentation |
|
Table of Contents
- 1. Introduction
- 1.1. Research Scope
- 1.2. Market Segmentation
- 1.3. Research Objective
- 1.4. Definitions and Assumptions
- 2. Executive Summary
- 2.1. Market Snapshot
- 3. Market Dynamics
- 3.1. Market Drivers
- 3.2. Market Restrains
- 3.3. Market Trends
- 3.4. Market Opportunities
- 4. Market Factor Analysis
- 4.1. Porters Five Forces
- 4.1.1. Bargaining Power of Suppliers
- 4.1.2. Bargaining Power of Buyers
- 4.1.3. Threat of New Entrants
- 4.1.4. Threat of Substitutes
- 4.1.5. Competitive Rivalry
- 4.2. PESTEL analysis
- 4.3. BCG Analysis
- 4.3.1. Stars (High Growth, High Market Share)
- 4.3.2. Cash Cows (Low Growth, High Market Share)
- 4.3.3. Question Mark (High Growth, Low Market Share)
- 4.3.4. Dogs (Low Growth, Low Market Share)
- 4.4. Ansoff Matrix Analysis
- 4.5. Supply Chain Analysis
- 4.6. Regulatory Landscape
- 4.7. Current Market Potential and Opportunity Assessment (TAM–SAM–SOM Framework)
- 4.8. VDR Analyst Note
- 4.1. Porters Five Forces
- 5. Market Analysis, Insights and Forecast 2021-2033
- 5.1. Market Analysis, Insights and Forecast - by Fabrication Type
- 5.1.1. Organic
- 5.1.2. Inorganic
- 5.2. Market Analysis, Insights and Forecast - by Product Type
- 5.2.1. Liquid Crystal Display
- 5.2.2. Light Emitting Diode
- 5.2.3. Electronic Paper Display
- 5.2.4. AMOLED
- 5.3. Market Analysis, Insights and Forecast - by End-user Industry
- 5.3.1. Consumer Electronics
- 5.3.2. Automotive
- 5.3.3. BFSI
- 5.3.4. Industrial
- 5.3.5. Healthcare
- 5.3.6. Other End-user Industries
- 5.4. Market Analysis, Insights and Forecast - by Region
- 5.4.1. North America
- 5.4.2. Europe
- 5.4.3. Asia Pacific
- 5.4.4. Rest of the world
- 5.1. Market Analysis, Insights and Forecast - by Fabrication Type
- 6. Global Thin Film Transistor Industry Analysis, Insights and Forecast, 2021-2033
- 6.1. Market Analysis, Insights and Forecast - by Fabrication Type
- 6.1.1. Organic
- 6.1.2. Inorganic
- 6.2. Market Analysis, Insights and Forecast - by Product Type
- 6.2.1. Liquid Crystal Display
- 6.2.2. Light Emitting Diode
- 6.2.3. Electronic Paper Display
- 6.2.4. AMOLED
- 6.3. Market Analysis, Insights and Forecast - by End-user Industry
- 6.3.1. Consumer Electronics
- 6.3.2. Automotive
- 6.3.3. BFSI
- 6.3.4. Industrial
- 6.3.5. Healthcare
- 6.3.6. Other End-user Industries
- 6.1. Market Analysis, Insights and Forecast - by Fabrication Type
- 7. North America Thin Film Transistor Industry Analysis, Insights and Forecast, 2021-2033
- 7.1. Market Analysis, Insights and Forecast - by Fabrication Type
- 7.1.1. Organic
- 7.1.2. Inorganic
- 7.2. Market Analysis, Insights and Forecast - by Product Type
- 7.2.1. Liquid Crystal Display
- 7.2.2. Light Emitting Diode
- 7.2.3. Electronic Paper Display
- 7.2.4. AMOLED
- 7.3. Market Analysis, Insights and Forecast - by End-user Industry
- 7.3.1. Consumer Electronics
- 7.3.2. Automotive
- 7.3.3. BFSI
- 7.3.4. Industrial
- 7.3.5. Healthcare
- 7.3.6. Other End-user Industries
- 7.1. Market Analysis, Insights and Forecast - by Fabrication Type
- 8. Europe Thin Film Transistor Industry Analysis, Insights and Forecast, 2021-2033
- 8.1. Market Analysis, Insights and Forecast - by Fabrication Type
- 8.1.1. Organic
- 8.1.2. Inorganic
- 8.2. Market Analysis, Insights and Forecast - by Product Type
- 8.2.1. Liquid Crystal Display
- 8.2.2. Light Emitting Diode
- 8.2.3. Electronic Paper Display
- 8.2.4. AMOLED
- 8.3. Market Analysis, Insights and Forecast - by End-user Industry
- 8.3.1. Consumer Electronics
- 8.3.2. Automotive
- 8.3.3. BFSI
- 8.3.4. Industrial
- 8.3.5. Healthcare
- 8.3.6. Other End-user Industries
- 8.1. Market Analysis, Insights and Forecast - by Fabrication Type
- 9. Asia Pacific Thin Film Transistor Industry Analysis, Insights and Forecast, 2021-2033
- 9.1. Market Analysis, Insights and Forecast - by Fabrication Type
- 9.1.1. Organic
- 9.1.2. Inorganic
- 9.2. Market Analysis, Insights and Forecast - by Product Type
- 9.2.1. Liquid Crystal Display
- 9.2.2. Light Emitting Diode
- 9.2.3. Electronic Paper Display
- 9.2.4. AMOLED
- 9.3. Market Analysis, Insights and Forecast - by End-user Industry
- 9.3.1. Consumer Electronics
- 9.3.2. Automotive
- 9.3.3. BFSI
- 9.3.4. Industrial
- 9.3.5. Healthcare
- 9.3.6. Other End-user Industries
- 9.1. Market Analysis, Insights and Forecast - by Fabrication Type
- 10. Rest of the world Thin Film Transistor Industry Analysis, Insights and Forecast, 2021-2033
- 10.1. Market Analysis, Insights and Forecast - by Fabrication Type
- 10.1.1. Organic
- 10.1.2. Inorganic
- 10.2. Market Analysis, Insights and Forecast - by Product Type
- 10.2.1. Liquid Crystal Display
- 10.2.2. Light Emitting Diode
- 10.2.3. Electronic Paper Display
- 10.2.4. AMOLED
- 10.3. Market Analysis, Insights and Forecast - by End-user Industry
- 10.3.1. Consumer Electronics
- 10.3.2. Automotive
- 10.3.3. BFSI
- 10.3.4. Industrial
- 10.3.5. Healthcare
- 10.3.6. Other End-user Industries
- 10.1. Market Analysis, Insights and Forecast - by Fabrication Type
- 11. Competitive Analysis
- 11.1. Company Profiles
- 11.1.1 LG Display Co Ltd
- 11.1.1.1. Company Overview
- 11.1.1.2. Products
- 11.1.1.3. Company Financials
- 11.1.1.4. SWOT Analysis
- 11.1.2 Toshiba Corporation
- 11.1.2.1. Company Overview
- 11.1.2.2. Products
- 11.1.2.3. Company Financials
- 11.1.2.4. SWOT Analysis
- 11.1.3 Fujitsu Ltd
- 11.1.3.1. Company Overview
- 11.1.3.2. Products
- 11.1.3.3. Company Financials
- 11.1.3.4. SWOT Analysis
- 11.1.4 BOE Technology
- 11.1.4.1. Company Overview
- 11.1.4.2. Products
- 11.1.4.3. Company Financials
- 11.1.4.4. SWOT Analysis
- 11.1.5 Innolux Corporation*List Not Exhaustive
- 11.1.5.1. Company Overview
- 11.1.5.2. Products
- 11.1.5.3. Company Financials
- 11.1.5.4. SWOT Analysis
- 11.1.6 Winstar Display Co Ltd
- 11.1.6.1. Company Overview
- 11.1.6.2. Products
- 11.1.6.3. Company Financials
- 11.1.6.4. SWOT Analysis
- 11.1.7 Sharp Corporation
- 11.1.7.1. Company Overview
- 11.1.7.2. Products
- 11.1.7.3. Company Financials
- 11.1.7.4. SWOT Analysis
- 11.1.8 Samsung Corporation
- 11.1.8.1. Company Overview
- 11.1.8.2. Products
- 11.1.8.3. Company Financials
- 11.1.8.4. SWOT Analysis
- 11.1.9 Panasonic Corporation
- 11.1.9.1. Company Overview
- 11.1.9.2. Products
- 11.1.9.3. Company Financials
- 11.1.9.4. SWOT Analysis
- 11.1.10 Sony Corporation
- 11.1.10.1. Company Overview
- 11.1.10.2. Products
- 11.1.10.3. Company Financials
- 11.1.10.4. SWOT Analysis
- 11.1.1 LG Display Co Ltd
- 11.2. Market Entropy
- 11.2.1 Company's Key Areas Served
- 11.2.2 Recent Developments
- 11.3. Company Market Share Analysis 2025
- 11.3.1 Top 5 Companies Market Share Analysis
- 11.3.2 Top 3 Companies Market Share Analysis
- 11.4. List of Potential Customers
- 12. Research Methodology
List of Figures
- Figure 1: Global Thin Film Transistor Industry Revenue Breakdown (billion, %) by Region 2025 & 2033
- Figure 2: North America Thin Film Transistor Industry Revenue (billion), by Fabrication Type 2025 & 2033
- Figure 3: North America Thin Film Transistor Industry Revenue Share (%), by Fabrication Type 2025 & 2033
- Figure 4: North America Thin Film Transistor Industry Revenue (billion), by Product Type 2025 & 2033
- Figure 5: North America Thin Film Transistor Industry Revenue Share (%), by Product Type 2025 & 2033
- Figure 6: North America Thin Film Transistor Industry Revenue (billion), by End-user Industry 2025 & 2033
- Figure 7: North America Thin Film Transistor Industry Revenue Share (%), by End-user Industry 2025 & 2033
- Figure 8: North America Thin Film Transistor Industry Revenue (billion), by Country 2025 & 2033
- Figure 9: North America Thin Film Transistor Industry Revenue Share (%), by Country 2025 & 2033
- Figure 10: Europe Thin Film Transistor Industry Revenue (billion), by Fabrication Type 2025 & 2033
- Figure 11: Europe Thin Film Transistor Industry Revenue Share (%), by Fabrication Type 2025 & 2033
- Figure 12: Europe Thin Film Transistor Industry Revenue (billion), by Product Type 2025 & 2033
- Figure 13: Europe Thin Film Transistor Industry Revenue Share (%), by Product Type 2025 & 2033
- Figure 14: Europe Thin Film Transistor Industry Revenue (billion), by End-user Industry 2025 & 2033
- Figure 15: Europe Thin Film Transistor Industry Revenue Share (%), by End-user Industry 2025 & 2033
- Figure 16: Europe Thin Film Transistor Industry Revenue (billion), by Country 2025 & 2033
- Figure 17: Europe Thin Film Transistor Industry Revenue Share (%), by Country 2025 & 2033
- Figure 18: Asia Pacific Thin Film Transistor Industry Revenue (billion), by Fabrication Type 2025 & 2033
- Figure 19: Asia Pacific Thin Film Transistor Industry Revenue Share (%), by Fabrication Type 2025 & 2033
- Figure 20: Asia Pacific Thin Film Transistor Industry Revenue (billion), by Product Type 2025 & 2033
- Figure 21: Asia Pacific Thin Film Transistor Industry Revenue Share (%), by Product Type 2025 & 2033
- Figure 22: Asia Pacific Thin Film Transistor Industry Revenue (billion), by End-user Industry 2025 & 2033
- Figure 23: Asia Pacific Thin Film Transistor Industry Revenue Share (%), by End-user Industry 2025 & 2033
- Figure 24: Asia Pacific Thin Film Transistor Industry Revenue (billion), by Country 2025 & 2033
- Figure 25: Asia Pacific Thin Film Transistor Industry Revenue Share (%), by Country 2025 & 2033
- Figure 26: Rest of the world Thin Film Transistor Industry Revenue (billion), by Fabrication Type 2025 & 2033
- Figure 27: Rest of the world Thin Film Transistor Industry Revenue Share (%), by Fabrication Type 2025 & 2033
- Figure 28: Rest of the world Thin Film Transistor Industry Revenue (billion), by Product Type 2025 & 2033
- Figure 29: Rest of the world Thin Film Transistor Industry Revenue Share (%), by Product Type 2025 & 2033
- Figure 30: Rest of the world Thin Film Transistor Industry Revenue (billion), by End-user Industry 2025 & 2033
- Figure 31: Rest of the world Thin Film Transistor Industry Revenue Share (%), by End-user Industry 2025 & 2033
- Figure 32: Rest of the world Thin Film Transistor Industry Revenue (billion), by Country 2025 & 2033
- Figure 33: Rest of the world Thin Film Transistor Industry Revenue Share (%), by Country 2025 & 2033
List of Tables
- Table 1: Global Thin Film Transistor Industry Revenue billion Forecast, by Fabrication Type 2020 & 2033
- Table 2: Global Thin Film Transistor Industry Revenue billion Forecast, by Product Type 2020 & 2033
- Table 3: Global Thin Film Transistor Industry Revenue billion Forecast, by End-user Industry 2020 & 2033
- Table 4: Global Thin Film Transistor Industry Revenue billion Forecast, by Region 2020 & 2033
- Table 5: Global Thin Film Transistor Industry Revenue billion Forecast, by Fabrication Type 2020 & 2033
- Table 6: Global Thin Film Transistor Industry Revenue billion Forecast, by Product Type 2020 & 2033
- Table 7: Global Thin Film Transistor Industry Revenue billion Forecast, by End-user Industry 2020 & 2033
- Table 8: Global Thin Film Transistor Industry Revenue billion Forecast, by Country 2020 & 2033
- Table 9: Global Thin Film Transistor Industry Revenue billion Forecast, by Fabrication Type 2020 & 2033
- Table 10: Global Thin Film Transistor Industry Revenue billion Forecast, by Product Type 2020 & 2033
- Table 11: Global Thin Film Transistor Industry Revenue billion Forecast, by End-user Industry 2020 & 2033
- Table 12: Global Thin Film Transistor Industry Revenue billion Forecast, by Country 2020 & 2033
- Table 13: Global Thin Film Transistor Industry Revenue billion Forecast, by Fabrication Type 2020 & 2033
- Table 14: Global Thin Film Transistor Industry Revenue billion Forecast, by Product Type 2020 & 2033
- Table 15: Global Thin Film Transistor Industry Revenue billion Forecast, by End-user Industry 2020 & 2033
- Table 16: Global Thin Film Transistor Industry Revenue billion Forecast, by Country 2020 & 2033
- Table 17: Global Thin Film Transistor Industry Revenue billion Forecast, by Fabrication Type 2020 & 2033
- Table 18: Global Thin Film Transistor Industry Revenue billion Forecast, by Product Type 2020 & 2033
- Table 19: Global Thin Film Transistor Industry Revenue billion Forecast, by End-user Industry 2020 & 2033
- Table 20: Global Thin Film Transistor Industry Revenue billion Forecast, by Country 2020 & 2033
Frequently Asked Questions
1. What is the projected Compound Annual Growth Rate (CAGR) of the Thin Film Transistor Industry?
The projected CAGR is approximately 6.9%.
2. Which companies are prominent players in the Thin Film Transistor Industry?
Key companies in the market include LG Display Co Ltd, Toshiba Corporation, Fujitsu Ltd, BOE Technology, Innolux Corporation*List Not Exhaustive, Winstar Display Co Ltd, Sharp Corporation, Samsung Corporation, Panasonic Corporation, Sony Corporation.
3. What are the main segments of the Thin Film Transistor Industry?
The market segments include Fabrication Type, Product Type, End-user Industry.
4. Can you provide details about the market size?
The market size is estimated to be USD 28.6 billion as of 2022.
5. What are some drivers contributing to market growth?
; Increased Demand for Liquid Crystal Displays; Innovation in TFT Technology.
6. What are the notable trends driving market growth?
Consumer Electronics Expected to Have Significant Growth.
7. Are there any restraints impacting market growth?
; High Cost of Manufacturing.
8. Can you provide examples of recent developments in the market?
N/A
9. What pricing options are available for accessing the report?
Pricing options include single-user, multi-user, and enterprise licenses priced at USD 4750, USD 5250, and USD 8750 respectively.
10. Is the market size provided in terms of value or volume?
The market size is provided in terms of value, measured in billion.
11. Are there any specific market keywords associated with the report?
Yes, the market keyword associated with the report is "Thin Film Transistor Industry," which aids in identifying and referencing the specific market segment covered.
12. How do I determine which pricing option suits my needs best?
The pricing options vary based on user requirements and access needs. Individual users may opt for single-user licenses, while businesses requiring broader access may choose multi-user or enterprise licenses for cost-effective access to the report.
13. Are there any additional resources or data provided in the Thin Film Transistor Industry report?
While the report offers comprehensive insights, it's advisable to review the specific contents or supplementary materials provided to ascertain if additional resources or data are available.
14. How can I stay updated on further developments or reports in the Thin Film Transistor Industry?
To stay informed about further developments, trends, and reports in the Thin Film Transistor Industry, consider subscribing to industry newsletters, following relevant companies and organizations, or regularly checking reputable industry news sources and publications.
Methodology
Step 1 - Identification of Relevant Samples Size from Population Database


Step 2 - Approaches for Defining Global Market Size (Value, Volume* & Price*)

Note*: In applicable scenarios
Step 3 - Data Sources
Primary Research
- Web Analytics
- Survey Reports
- Research Institute
- Latest Research Reports
- Opinion Leaders
Secondary Research
- Annual Reports
- White Paper
- Latest Press Release
- Industry Association
- Paid Database
- Investor Presentations

Step 4 - Data Triangulation
Involves using different sources of information in order to increase the validity of a study
These sources are likely to be stakeholders in a program - participants, other researchers, program staff, other community members, and so on.
Then we put all data in single framework & apply various statistical tools to find out the dynamic on the market.
During the analysis stage, feedback from the stakeholder groups would be compared to determine areas of agreement as well as areas of divergence