
Key Insights
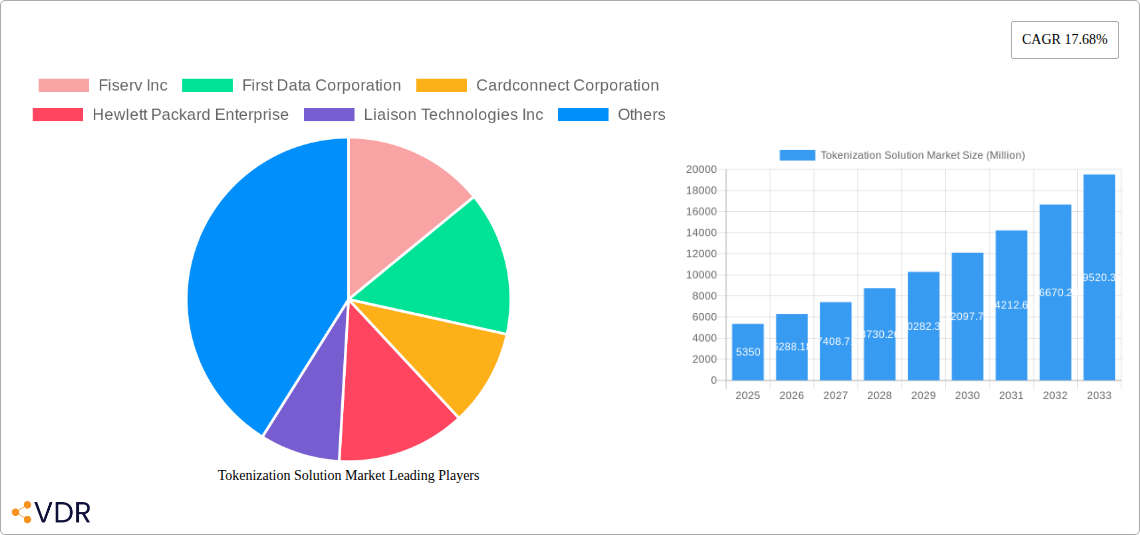
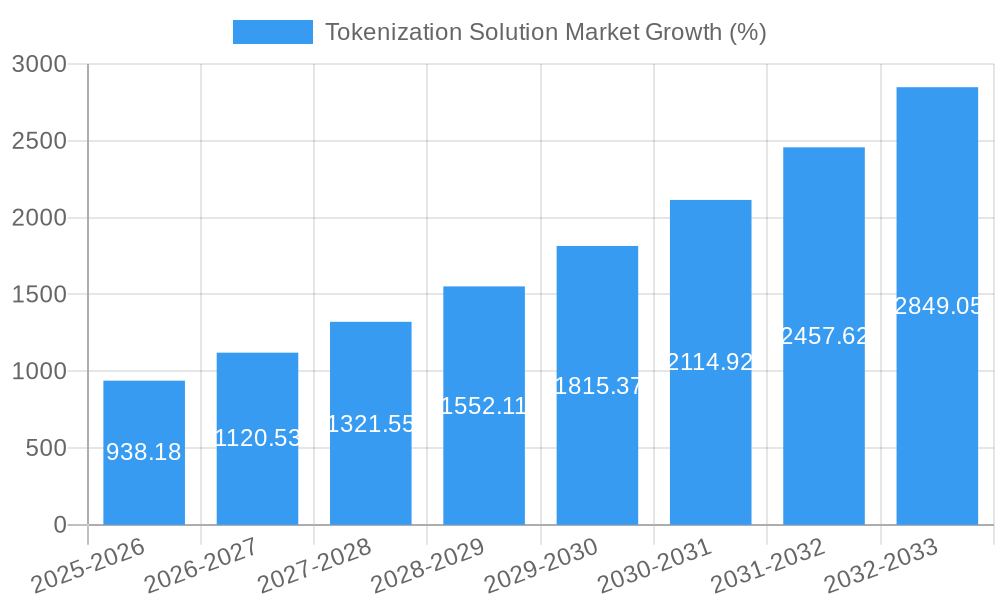
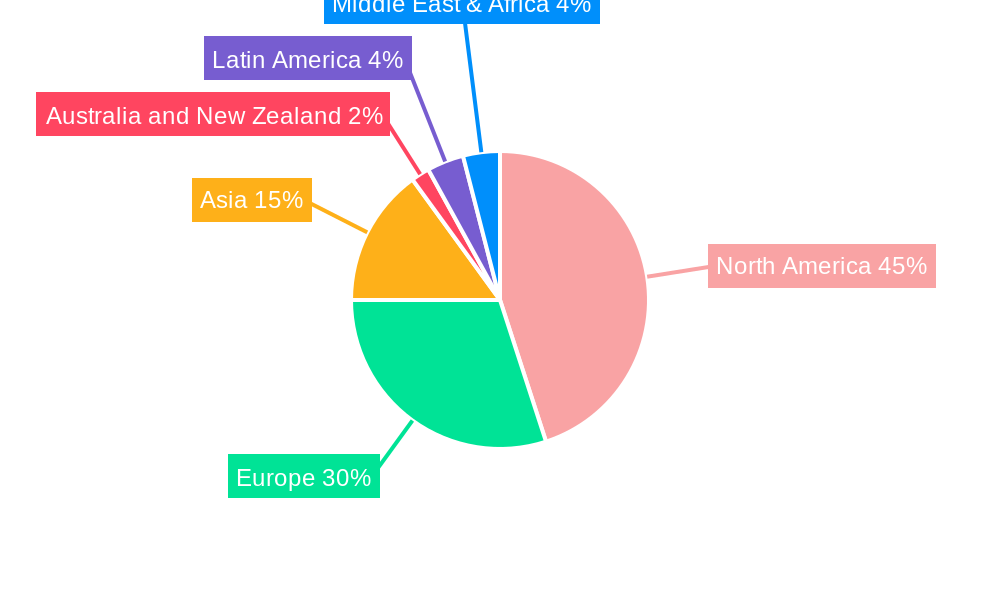
The Tokenization Solution Market, valued at $5.35 billion in 2025, is experiencing robust growth, projected to expand at a Compound Annual Growth Rate (CAGR) of 17.68% from 2025 to 2033. This significant expansion is driven by increasing concerns over data security and privacy breaches, coupled with the rising adoption of cloud-based solutions and the expanding digital economy across diverse sectors. The retail and e-commerce industries are key adopters, followed by BFSI (Banking, Financial Services, and Insurance), and Transportation & Logistics, each leveraging tokenization to enhance payment processing, customer data protection, and supply chain management. The market is segmented by type (Solutions and Services) and deployment (On-Premise and Cloud), with cloud-based solutions gaining significant traction due to their scalability and cost-effectiveness. Growth is further fueled by stringent regulatory compliance requirements around data protection, prompting organizations to adopt robust tokenization strategies. Geographic distribution shows a strong presence in North America, particularly the United States, followed by Europe and Asia, with emerging markets in Latin America and the Middle East also exhibiting growth potential. The competitive landscape is dynamic, with key players such as Fiserv, First Data, and others vying for market share through continuous innovation and strategic partnerships.
The forecast period (2025-2033) anticipates consistent high growth, driven by factors such as the increasing adoption of Internet of Things (IoT) devices and the expansion of big data analytics. This will lead to a heightened demand for secure data management solutions. While challenges remain, including the initial investment costs associated with implementation and integration complexities, the long-term benefits of enhanced security, reduced fraud risks, and improved compliance outweigh these drawbacks, ensuring sustained market expansion. The continuous evolution of tokenization technologies and their integration with other security solutions will further propel the market's growth trajectory. Competition amongst established players and emerging technology providers will drive innovation and potentially lower costs, making tokenization accessible to a broader range of businesses.
This comprehensive report provides an in-depth analysis of the Tokenization Solution Market, encompassing market dynamics, growth trends, regional analysis, competitive landscape, and future outlook. The study period covers 2019-2033, with 2025 as the base year and a forecast period of 2025-2033. The report is essential for businesses, investors, and industry professionals seeking a clear understanding of this rapidly evolving market. The market is segmented by type (Solutions, Services), deployment (On-Premise, Cloud), and end-user industry (Retail & E-commerce, Transportation & Logistics, BFSI, IT & Telecommunications, Healthcare, Government, Energy & Utilities, Other End-User Industries). Key players analyzed include Fiserv Inc, First Data Corporation, Cardconnect Corporation, Hewlett Packard Enterprise, Liaison Technologies Inc, Thales Group, Ciphercloud Incorporation, Broadcom Inc, Paymetric Inc (A Worldpay Company), Cybersource Corporation, Protegrity USA Inc, 3delta Systems Inc, and Tokenex LLC.
Tokenization Solution Market Market Dynamics & Structure
The Tokenization Solution Market exhibits a moderately fragmented structure, with several established players and emerging startups competing for market share. Technological innovation, driven by advancements in blockchain technology and cryptography, is a primary growth driver. Stringent regulatory frameworks concerning data privacy and security significantly influence market dynamics, varying across regions. The market experiences competition from traditional security solutions, but the unique benefits of tokenization are increasingly favored. End-user demographics are expanding, driven by increased digitalization across diverse industries. Mergers and acquisitions (M&A) activity remains moderate, but strategic alliances are increasingly common.
- Market Concentration: Moderately Fragmented (xx% top 5 players market share in 2025)
- Technological Innovation: Blockchain, cryptography advancements driving growth.
- Regulatory Frameworks: GDPR, CCPA, and other regional regulations influence adoption.
- Competitive Substitutes: Traditional security and data management solutions.
- End-User Demographics: Expanding across all sectors due to digital transformation.
- M&A Activity: Moderate, with strategic partnerships becoming increasingly significant. (xx M&A deals in 2024).
Tokenization Solution Market Growth Trends & Insights
The Tokenization Solution Market is experiencing robust growth, driven by rising demand for enhanced data security and privacy, increasing adoption of cloud-based solutions, and the expansion of digital economies. The market size is estimated at xx Million in 2025, with a projected Compound Annual Growth Rate (CAGR) of xx% during the forecast period (2025-2033). This growth is fueled by several factors, including the growing need for secure data sharing, the increasing adoption of blockchain technology, and the rising demand for secure and efficient payment solutions. Technological disruptions, particularly the development of advanced cryptographic algorithms and improved blockchain infrastructure, are further accelerating market growth. Consumer behavior shifts, including increasing reliance on digital services and heightened security concerns, further drive demand. Market penetration across various industries is gradually increasing, with significant potential for future expansion in untapped sectors.
Dominant Regions, Countries, or Segments in Tokenization Solution Market
North America currently dominates the Tokenization Solution Market, driven by early adoption of digital technologies, robust IT infrastructure, and stringent data privacy regulations. However, the Asia-Pacific region is poised for significant growth due to rapid digitalization and increasing government initiatives promoting technological advancement. Within the segment breakdown:
By Type: The Solutions segment holds the largest market share, followed closely by Services.
By Deployment: Cloud deployment is witnessing faster growth compared to On-Premise due to scalability and cost-effectiveness.
By End-User Industry: The BFSI (Banking, Financial Services, and Insurance) sector is a major driver, followed by Retail & E-commerce, due to the high volume of sensitive data handled.
Key Drivers (North America): Strong regulatory framework, advanced IT infrastructure, early adoption of digital technologies.
Key Drivers (Asia-Pacific): Rapid digitalization, increasing government support for technological development.
Market Share: North America holds the largest market share (xx%), followed by Europe (xx%) and Asia-Pacific (xx%). Growth potential is highest in Asia-Pacific.
Tokenization Solution Market Product Landscape
The Tokenization Solution Market offers a diverse range of products and services, encompassing various security levels, integration capabilities, and deployment models. Solutions are tailored to specific industry needs, providing customized data protection and access management. Key features include advanced encryption algorithms, granular access control, and real-time audit trails. Continuous innovation is evident, with advancements in blockchain technology improving data security and efficiency. Unique selling propositions often include improved compliance, reduced operational costs, and enhanced business agility.
Key Drivers, Barriers & Challenges in Tokenization Solution Market
Key Drivers:
- Increasing demand for secure data sharing.
- Rising adoption of cloud computing and blockchain technology.
- Growing concerns over data privacy and security breaches.
- Stringent regulations enforcing data protection.
Key Challenges and Restraints:
- High implementation costs for initial setup.
- Complexity in integrating with existing systems.
- Lack of awareness and understanding about tokenization among certain user segments.
- Concerns over the scalability of certain solutions, particularly as data volumes increase. (estimated xx% of businesses cite scalability as a major barrier).
Emerging Opportunities in Tokenization Solution Market
- Expansion into new and untapped markets, such as the IoT and supply chain sectors.
- Development of specialized tokenization solutions for specific industry needs.
- Integration with other emerging technologies, such as AI and machine learning, to enhance security and efficiency.
- Focus on user-friendly interfaces to improve adoption rates.
Growth Accelerators in the Tokenization Solution Market Industry
Technological breakthroughs in cryptography and blockchain, strategic partnerships between technology providers and industry giants, and expansion strategies targeting new sectors are driving the long-term growth of the Tokenization Solution Market. Increased awareness about the benefits of tokenization and government support are crucial factors promoting market expansion and wider adoption across different industries.
Key Players Shaping the Tokenization Solution Market Market
- Fiserv Inc
- First Data Corporation
- Cardconnect Corporation
- Hewlett Packard Enterprise
- Liaison Technologies Inc
- Thales Group
- Ciphercloud Incorporation
- Broadcom Inc
- Paymetric Inc (A Worldpay Company)
- Cybersource Corporation
- Protegrity USA Inc
- 3delta Systems Inc
- Tokenex LLC
Notable Milestones in Tokenization Solution Market Sector
- May 2023: EY launches EY OpsChain ESG, a blockchain-based solution for carbon footprint tracking and management utilizing tokenization for enhanced transparency.
- April 2022: Newrl introduces tokenized equity alternatives for unlisted firms in India, facilitating ESOPs and improved liquidity for startup stock.
In-Depth Tokenization Solution Market Market Outlook
The Tokenization Solution Market is poised for continued strong growth, driven by increasing digital transformation across various sectors and a growing need for robust data security and privacy solutions. Strategic partnerships, technological advancements, and a rise in regulatory compliance requirements will further accelerate market expansion. The market presents significant opportunities for innovative players to develop specialized solutions and capture market share in high-growth sectors, such as the Internet of Things (IoT) and supply chain management.
Tokenization Solution Market Segmentation
-
1. Type
- 1.1. Solutions
- 1.2. Services
-
2. Deployment
- 2.1. On-Premise
- 2.2. Cloud
-
3. End-User Industry
- 3.1. Retail & E-commerce
- 3.2. Transportation & Logistics
- 3.3. BFSI
- 3.4. IT & Telecommunications
- 3.5. Healthcare
- 3.6. Government
- 3.7. Energy & Utilities
- 3.8. Other End-User Industries
Tokenization Solution Market Segmentation By Geography
-
1. North America
- 1.1. United States
- 1.2. Canada
-
2. Europe
- 2.1. United Kingdom
- 2.2. Germany
- 2.3. France
-
3. Asia
- 3.1. China
- 3.2. India
- 4. Australia and New Zealand
-
5. Latin America
- 5.1. Brazil
- 5.2. Mexico
- 5.3. Argentina
- 6. Middle East
-
7. United Arab Emirates
- 7.1. Saudi Arabia
- 7.2. South Africa
Tokenization Solution Market REPORT HIGHLIGHTS
| Aspects | Details |
|---|---|
| Study Period | 2019-2033 |
| Base Year | 2024 |
| Estimated Year | 2025 |
| Forecast Period | 2025-2033 |
| Historical Period | 2019-2024 |
| Growth Rate | CAGR of 17.68% from 2019-2033 |
| Segmentation |
|
Table of Contents
- 1. Introduction
- 1.1. Research Scope
- 1.2. Market Segmentation
- 1.3. Research Methodology
- 1.4. Definitions and Assumptions
- 2. Executive Summary
- 2.1. Introduction
- 3. Market Dynamics
- 3.1. Introduction
- 3.2. Market Drivers
- 3.2.1. Growing Demand for Secure Payment Gateways; Rising Adoption in E-commerce and Mobile payments; Growing Government Regulations On Data Security
- 3.3. Market Restrains
- 3.3.1. Addressing Vulnerabilities From EMV Standards; Lack of Awareness Due to Similar Products
- 3.4. Market Trends
- 3.4.1. BFSI to hold the largest market size
- 4. Market Factor Analysis
- 4.1. Porters Five Forces
- 4.2. Supply/Value Chain
- 4.3. PESTEL analysis
- 4.4. Market Entropy
- 4.5. Patent/Trademark Analysis
- 5. Global Tokenization Solution Market Analysis, Insights and Forecast, 2019-2031
- 5.1. Market Analysis, Insights and Forecast - by Type
- 5.1.1. Solutions
- 5.1.2. Services
- 5.2. Market Analysis, Insights and Forecast - by Deployment
- 5.2.1. On-Premise
- 5.2.2. Cloud
- 5.3. Market Analysis, Insights and Forecast - by End-User Industry
- 5.3.1. Retail & E-commerce
- 5.3.2. Transportation & Logistics
- 5.3.3. BFSI
- 5.3.4. IT & Telecommunications
- 5.3.5. Healthcare
- 5.3.6. Government
- 5.3.7. Energy & Utilities
- 5.3.8. Other End-User Industries
- 5.4. Market Analysis, Insights and Forecast - by Region
- 5.4.1. North America
- 5.4.2. Europe
- 5.4.3. Asia
- 5.4.4. Australia and New Zealand
- 5.4.5. Latin America
- 5.4.6. Middle East
- 5.4.7. United Arab Emirates
- 5.1. Market Analysis, Insights and Forecast - by Type
- 6. North America Tokenization Solution Market Analysis, Insights and Forecast, 2019-2031
- 6.1. Market Analysis, Insights and Forecast - by Type
- 6.1.1. Solutions
- 6.1.2. Services
- 6.2. Market Analysis, Insights and Forecast - by Deployment
- 6.2.1. On-Premise
- 6.2.2. Cloud
- 6.3. Market Analysis, Insights and Forecast - by End-User Industry
- 6.3.1. Retail & E-commerce
- 6.3.2. Transportation & Logistics
- 6.3.3. BFSI
- 6.3.4. IT & Telecommunications
- 6.3.5. Healthcare
- 6.3.6. Government
- 6.3.7. Energy & Utilities
- 6.3.8. Other End-User Industries
- 6.1. Market Analysis, Insights and Forecast - by Type
- 7. Europe Tokenization Solution Market Analysis, Insights and Forecast, 2019-2031
- 7.1. Market Analysis, Insights and Forecast - by Type
- 7.1.1. Solutions
- 7.1.2. Services
- 7.2. Market Analysis, Insights and Forecast - by Deployment
- 7.2.1. On-Premise
- 7.2.2. Cloud
- 7.3. Market Analysis, Insights and Forecast - by End-User Industry
- 7.3.1. Retail & E-commerce
- 7.3.2. Transportation & Logistics
- 7.3.3. BFSI
- 7.3.4. IT & Telecommunications
- 7.3.5. Healthcare
- 7.3.6. Government
- 7.3.7. Energy & Utilities
- 7.3.8. Other End-User Industries
- 7.1. Market Analysis, Insights and Forecast - by Type
- 8. Asia Tokenization Solution Market Analysis, Insights and Forecast, 2019-2031
- 8.1. Market Analysis, Insights and Forecast - by Type
- 8.1.1. Solutions
- 8.1.2. Services
- 8.2. Market Analysis, Insights and Forecast - by Deployment
- 8.2.1. On-Premise
- 8.2.2. Cloud
- 8.3. Market Analysis, Insights and Forecast - by End-User Industry
- 8.3.1. Retail & E-commerce
- 8.3.2. Transportation & Logistics
- 8.3.3. BFSI
- 8.3.4. IT & Telecommunications
- 8.3.5. Healthcare
- 8.3.6. Government
- 8.3.7. Energy & Utilities
- 8.3.8. Other End-User Industries
- 8.1. Market Analysis, Insights and Forecast - by Type
- 9. Australia and New Zealand Tokenization Solution Market Analysis, Insights and Forecast, 2019-2031
- 9.1. Market Analysis, Insights and Forecast - by Type
- 9.1.1. Solutions
- 9.1.2. Services
- 9.2. Market Analysis, Insights and Forecast - by Deployment
- 9.2.1. On-Premise
- 9.2.2. Cloud
- 9.3. Market Analysis, Insights and Forecast - by End-User Industry
- 9.3.1. Retail & E-commerce
- 9.3.2. Transportation & Logistics
- 9.3.3. BFSI
- 9.3.4. IT & Telecommunications
- 9.3.5. Healthcare
- 9.3.6. Government
- 9.3.7. Energy & Utilities
- 9.3.8. Other End-User Industries
- 9.1. Market Analysis, Insights and Forecast - by Type
- 10. Latin America Tokenization Solution Market Analysis, Insights and Forecast, 2019-2031
- 10.1. Market Analysis, Insights and Forecast - by Type
- 10.1.1. Solutions
- 10.1.2. Services
- 10.2. Market Analysis, Insights and Forecast - by Deployment
- 10.2.1. On-Premise
- 10.2.2. Cloud
- 10.3. Market Analysis, Insights and Forecast - by End-User Industry
- 10.3.1. Retail & E-commerce
- 10.3.2. Transportation & Logistics
- 10.3.3. BFSI
- 10.3.4. IT & Telecommunications
- 10.3.5. Healthcare
- 10.3.6. Government
- 10.3.7. Energy & Utilities
- 10.3.8. Other End-User Industries
- 10.1. Market Analysis, Insights and Forecast - by Type
- 11. Middle East Tokenization Solution Market Analysis, Insights and Forecast, 2019-2031
- 11.1. Market Analysis, Insights and Forecast - by Type
- 11.1.1. Solutions
- 11.1.2. Services
- 11.2. Market Analysis, Insights and Forecast - by Deployment
- 11.2.1. On-Premise
- 11.2.2. Cloud
- 11.3. Market Analysis, Insights and Forecast - by End-User Industry
- 11.3.1. Retail & E-commerce
- 11.3.2. Transportation & Logistics
- 11.3.3. BFSI
- 11.3.4. IT & Telecommunications
- 11.3.5. Healthcare
- 11.3.6. Government
- 11.3.7. Energy & Utilities
- 11.3.8. Other End-User Industries
- 11.1. Market Analysis, Insights and Forecast - by Type
- 12. United Arab Emirates Tokenization Solution Market Analysis, Insights and Forecast, 2019-2031
- 12.1. Market Analysis, Insights and Forecast - by Type
- 12.1.1. Solutions
- 12.1.2. Services
- 12.2. Market Analysis, Insights and Forecast - by Deployment
- 12.2.1. On-Premise
- 12.2.2. Cloud
- 12.3. Market Analysis, Insights and Forecast - by End-User Industry
- 12.3.1. Retail & E-commerce
- 12.3.2. Transportation & Logistics
- 12.3.3. BFSI
- 12.3.4. IT & Telecommunications
- 12.3.5. Healthcare
- 12.3.6. Government
- 12.3.7. Energy & Utilities
- 12.3.8. Other End-User Industries
- 12.1. Market Analysis, Insights and Forecast - by Type
- 13. North America Tokenization Solution Market Analysis, Insights and Forecast, 2019-2031
- 13.1. Market Analysis, Insights and Forecast - By Country/Sub-region
- 13.1.1 United States
- 13.1.2 Canada
- 14. Europe Tokenization Solution Market Analysis, Insights and Forecast, 2019-2031
- 14.1. Market Analysis, Insights and Forecast - By Country/Sub-region
- 14.1.1 United Kingdom
- 14.1.2 Germany
- 14.1.3 France
- 15. Asia Tokenization Solution Market Analysis, Insights and Forecast, 2019-2031
- 15.1. Market Analysis, Insights and Forecast - By Country/Sub-region
- 15.1.1 China
- 15.1.2 India
- 16. Australia and New Zealand Tokenization Solution Market Analysis, Insights and Forecast, 2019-2031
- 16.1. Market Analysis, Insights and Forecast - By Country/Sub-region
- 16.1.1.
- 17. Latin America Tokenization Solution Market Analysis, Insights and Forecast, 2019-2031
- 17.1. Market Analysis, Insights and Forecast - By Country/Sub-region
- 17.1.1 Brazil
- 17.1.2 Mexico
- 17.1.3 Argentina
- 18. Middle East Tokenization Solution Market Analysis, Insights and Forecast, 2019-2031
- 18.1. Market Analysis, Insights and Forecast - By Country/Sub-region
- 18.1.1.
- 19. United Arab Emirates Tokenization Solution Market Analysis, Insights and Forecast, 2019-2031
- 19.1. Market Analysis, Insights and Forecast - By Country/Sub-region
- 19.1.1 Saudi Arabia
- 19.1.2 South Africa
- 20. Competitive Analysis
- 20.1. Global Market Share Analysis 2024
- 20.2. Company Profiles
- 20.2.1 Fiserv Inc
- 20.2.1.1. Overview
- 20.2.1.2. Products
- 20.2.1.3. SWOT Analysis
- 20.2.1.4. Recent Developments
- 20.2.1.5. Financials (Based on Availability)
- 20.2.2 First Data Corporation
- 20.2.2.1. Overview
- 20.2.2.2. Products
- 20.2.2.3. SWOT Analysis
- 20.2.2.4. Recent Developments
- 20.2.2.5. Financials (Based on Availability)
- 20.2.3 Cardconnect Corporation
- 20.2.3.1. Overview
- 20.2.3.2. Products
- 20.2.3.3. SWOT Analysis
- 20.2.3.4. Recent Developments
- 20.2.3.5. Financials (Based on Availability)
- 20.2.4 Hewlett Packard Enterprise
- 20.2.4.1. Overview
- 20.2.4.2. Products
- 20.2.4.3. SWOT Analysis
- 20.2.4.4. Recent Developments
- 20.2.4.5. Financials (Based on Availability)
- 20.2.5 Liaison Technologies Inc
- 20.2.5.1. Overview
- 20.2.5.2. Products
- 20.2.5.3. SWOT Analysis
- 20.2.5.4. Recent Developments
- 20.2.5.5. Financials (Based on Availability)
- 20.2.6 Thales Group
- 20.2.6.1. Overview
- 20.2.6.2. Products
- 20.2.6.3. SWOT Analysis
- 20.2.6.4. Recent Developments
- 20.2.6.5. Financials (Based on Availability)
- 20.2.7 Ciphercloud Incorporation
- 20.2.7.1. Overview
- 20.2.7.2. Products
- 20.2.7.3. SWOT Analysis
- 20.2.7.4. Recent Developments
- 20.2.7.5. Financials (Based on Availability)
- 20.2.8 Broadcom Inc
- 20.2.8.1. Overview
- 20.2.8.2. Products
- 20.2.8.3. SWOT Analysis
- 20.2.8.4. Recent Developments
- 20.2.8.5. Financials (Based on Availability)
- 20.2.9 Paymetric Inc (A Worldpay Company)
- 20.2.9.1. Overview
- 20.2.9.2. Products
- 20.2.9.3. SWOT Analysis
- 20.2.9.4. Recent Developments
- 20.2.9.5. Financials (Based on Availability)
- 20.2.10 Cybersource Corporation
- 20.2.10.1. Overview
- 20.2.10.2. Products
- 20.2.10.3. SWOT Analysis
- 20.2.10.4. Recent Developments
- 20.2.10.5. Financials (Based on Availability)
- 20.2.11 Protegrity USA Inc
- 20.2.11.1. Overview
- 20.2.11.2. Products
- 20.2.11.3. SWOT Analysis
- 20.2.11.4. Recent Developments
- 20.2.11.5. Financials (Based on Availability)
- 20.2.12 3delta Systems Inc
- 20.2.12.1. Overview
- 20.2.12.2. Products
- 20.2.12.3. SWOT Analysis
- 20.2.12.4. Recent Developments
- 20.2.12.5. Financials (Based on Availability)
- 20.2.13 Tokenex LLC*List Not Exhaustive
- 20.2.13.1. Overview
- 20.2.13.2. Products
- 20.2.13.3. SWOT Analysis
- 20.2.13.4. Recent Developments
- 20.2.13.5. Financials (Based on Availability)
- 20.2.1 Fiserv Inc
List of Figures
- Figure 1: Global Tokenization Solution Market Revenue Breakdown (Million, %) by Region 2024 & 2032
- Figure 2: North America Tokenization Solution Market Revenue (Million), by Country 2024 & 2032
- Figure 3: North America Tokenization Solution Market Revenue Share (%), by Country 2024 & 2032
- Figure 4: Europe Tokenization Solution Market Revenue (Million), by Country 2024 & 2032
- Figure 5: Europe Tokenization Solution Market Revenue Share (%), by Country 2024 & 2032
- Figure 6: Asia Tokenization Solution Market Revenue (Million), by Country 2024 & 2032
- Figure 7: Asia Tokenization Solution Market Revenue Share (%), by Country 2024 & 2032
- Figure 8: Australia and New Zealand Tokenization Solution Market Revenue (Million), by Country 2024 & 2032
- Figure 9: Australia and New Zealand Tokenization Solution Market Revenue Share (%), by Country 2024 & 2032
- Figure 10: Latin America Tokenization Solution Market Revenue (Million), by Country 2024 & 2032
- Figure 11: Latin America Tokenization Solution Market Revenue Share (%), by Country 2024 & 2032
- Figure 12: Middle East Tokenization Solution Market Revenue (Million), by Country 2024 & 2032
- Figure 13: Middle East Tokenization Solution Market Revenue Share (%), by Country 2024 & 2032
- Figure 14: United Arab Emirates Tokenization Solution Market Revenue (Million), by Country 2024 & 2032
- Figure 15: United Arab Emirates Tokenization Solution Market Revenue Share (%), by Country 2024 & 2032
- Figure 16: North America Tokenization Solution Market Revenue (Million), by Type 2024 & 2032
- Figure 17: North America Tokenization Solution Market Revenue Share (%), by Type 2024 & 2032
- Figure 18: North America Tokenization Solution Market Revenue (Million), by Deployment 2024 & 2032
- Figure 19: North America Tokenization Solution Market Revenue Share (%), by Deployment 2024 & 2032
- Figure 20: North America Tokenization Solution Market Revenue (Million), by End-User Industry 2024 & 2032
- Figure 21: North America Tokenization Solution Market Revenue Share (%), by End-User Industry 2024 & 2032
- Figure 22: North America Tokenization Solution Market Revenue (Million), by Country 2024 & 2032
- Figure 23: North America Tokenization Solution Market Revenue Share (%), by Country 2024 & 2032
- Figure 24: Europe Tokenization Solution Market Revenue (Million), by Type 2024 & 2032
- Figure 25: Europe Tokenization Solution Market Revenue Share (%), by Type 2024 & 2032
- Figure 26: Europe Tokenization Solution Market Revenue (Million), by Deployment 2024 & 2032
- Figure 27: Europe Tokenization Solution Market Revenue Share (%), by Deployment 2024 & 2032
- Figure 28: Europe Tokenization Solution Market Revenue (Million), by End-User Industry 2024 & 2032
- Figure 29: Europe Tokenization Solution Market Revenue Share (%), by End-User Industry 2024 & 2032
- Figure 30: Europe Tokenization Solution Market Revenue (Million), by Country 2024 & 2032
- Figure 31: Europe Tokenization Solution Market Revenue Share (%), by Country 2024 & 2032
- Figure 32: Asia Tokenization Solution Market Revenue (Million), by Type 2024 & 2032
- Figure 33: Asia Tokenization Solution Market Revenue Share (%), by Type 2024 & 2032
- Figure 34: Asia Tokenization Solution Market Revenue (Million), by Deployment 2024 & 2032
- Figure 35: Asia Tokenization Solution Market Revenue Share (%), by Deployment 2024 & 2032
- Figure 36: Asia Tokenization Solution Market Revenue (Million), by End-User Industry 2024 & 2032
- Figure 37: Asia Tokenization Solution Market Revenue Share (%), by End-User Industry 2024 & 2032
- Figure 38: Asia Tokenization Solution Market Revenue (Million), by Country 2024 & 2032
- Figure 39: Asia Tokenization Solution Market Revenue Share (%), by Country 2024 & 2032
- Figure 40: Australia and New Zealand Tokenization Solution Market Revenue (Million), by Type 2024 & 2032
- Figure 41: Australia and New Zealand Tokenization Solution Market Revenue Share (%), by Type 2024 & 2032
- Figure 42: Australia and New Zealand Tokenization Solution Market Revenue (Million), by Deployment 2024 & 2032
- Figure 43: Australia and New Zealand Tokenization Solution Market Revenue Share (%), by Deployment 2024 & 2032
- Figure 44: Australia and New Zealand Tokenization Solution Market Revenue (Million), by End-User Industry 2024 & 2032
- Figure 45: Australia and New Zealand Tokenization Solution Market Revenue Share (%), by End-User Industry 2024 & 2032
- Figure 46: Australia and New Zealand Tokenization Solution Market Revenue (Million), by Country 2024 & 2032
- Figure 47: Australia and New Zealand Tokenization Solution Market Revenue Share (%), by Country 2024 & 2032
- Figure 48: Latin America Tokenization Solution Market Revenue (Million), by Type 2024 & 2032
- Figure 49: Latin America Tokenization Solution Market Revenue Share (%), by Type 2024 & 2032
- Figure 50: Latin America Tokenization Solution Market Revenue (Million), by Deployment 2024 & 2032
- Figure 51: Latin America Tokenization Solution Market Revenue Share (%), by Deployment 2024 & 2032
- Figure 52: Latin America Tokenization Solution Market Revenue (Million), by End-User Industry 2024 & 2032
- Figure 53: Latin America Tokenization Solution Market Revenue Share (%), by End-User Industry 2024 & 2032
- Figure 54: Latin America Tokenization Solution Market Revenue (Million), by Country 2024 & 2032
- Figure 55: Latin America Tokenization Solution Market Revenue Share (%), by Country 2024 & 2032
- Figure 56: Middle East Tokenization Solution Market Revenue (Million), by Type 2024 & 2032
- Figure 57: Middle East Tokenization Solution Market Revenue Share (%), by Type 2024 & 2032
- Figure 58: Middle East Tokenization Solution Market Revenue (Million), by Deployment 2024 & 2032
- Figure 59: Middle East Tokenization Solution Market Revenue Share (%), by Deployment 2024 & 2032
- Figure 60: Middle East Tokenization Solution Market Revenue (Million), by End-User Industry 2024 & 2032
- Figure 61: Middle East Tokenization Solution Market Revenue Share (%), by End-User Industry 2024 & 2032
- Figure 62: Middle East Tokenization Solution Market Revenue (Million), by Country 2024 & 2032
- Figure 63: Middle East Tokenization Solution Market Revenue Share (%), by Country 2024 & 2032
- Figure 64: United Arab Emirates Tokenization Solution Market Revenue (Million), by Type 2024 & 2032
- Figure 65: United Arab Emirates Tokenization Solution Market Revenue Share (%), by Type 2024 & 2032
- Figure 66: United Arab Emirates Tokenization Solution Market Revenue (Million), by Deployment 2024 & 2032
- Figure 67: United Arab Emirates Tokenization Solution Market Revenue Share (%), by Deployment 2024 & 2032
- Figure 68: United Arab Emirates Tokenization Solution Market Revenue (Million), by End-User Industry 2024 & 2032
- Figure 69: United Arab Emirates Tokenization Solution Market Revenue Share (%), by End-User Industry 2024 & 2032
- Figure 70: United Arab Emirates Tokenization Solution Market Revenue (Million), by Country 2024 & 2032
- Figure 71: United Arab Emirates Tokenization Solution Market Revenue Share (%), by Country 2024 & 2032
List of Tables
- Table 1: Global Tokenization Solution Market Revenue Million Forecast, by Region 2019 & 2032
- Table 2: Global Tokenization Solution Market Revenue Million Forecast, by Type 2019 & 2032
- Table 3: Global Tokenization Solution Market Revenue Million Forecast, by Deployment 2019 & 2032
- Table 4: Global Tokenization Solution Market Revenue Million Forecast, by End-User Industry 2019 & 2032
- Table 5: Global Tokenization Solution Market Revenue Million Forecast, by Region 2019 & 2032
- Table 6: Global Tokenization Solution Market Revenue Million Forecast, by Country 2019 & 2032
- Table 7: United States Tokenization Solution Market Revenue (Million) Forecast, by Application 2019 & 2032
- Table 8: Canada Tokenization Solution Market Revenue (Million) Forecast, by Application 2019 & 2032
- Table 9: Global Tokenization Solution Market Revenue Million Forecast, by Country 2019 & 2032
- Table 10: United Kingdom Tokenization Solution Market Revenue (Million) Forecast, by Application 2019 & 2032
- Table 11: Germany Tokenization Solution Market Revenue (Million) Forecast, by Application 2019 & 2032
- Table 12: France Tokenization Solution Market Revenue (Million) Forecast, by Application 2019 & 2032
- Table 13: Global Tokenization Solution Market Revenue Million Forecast, by Country 2019 & 2032
- Table 14: China Tokenization Solution Market Revenue (Million) Forecast, by Application 2019 & 2032
- Table 15: India Tokenization Solution Market Revenue (Million) Forecast, by Application 2019 & 2032
- Table 16: Global Tokenization Solution Market Revenue Million Forecast, by Country 2019 & 2032
- Table 17: Tokenization Solution Market Revenue (Million) Forecast, by Application 2019 & 2032
- Table 18: Global Tokenization Solution Market Revenue Million Forecast, by Country 2019 & 2032
- Table 19: Brazil Tokenization Solution Market Revenue (Million) Forecast, by Application 2019 & 2032
- Table 20: Mexico Tokenization Solution Market Revenue (Million) Forecast, by Application 2019 & 2032
- Table 21: Argentina Tokenization Solution Market Revenue (Million) Forecast, by Application 2019 & 2032
- Table 22: Global Tokenization Solution Market Revenue Million Forecast, by Country 2019 & 2032
- Table 23: Tokenization Solution Market Revenue (Million) Forecast, by Application 2019 & 2032
- Table 24: Global Tokenization Solution Market Revenue Million Forecast, by Country 2019 & 2032
- Table 25: Saudi Arabia Tokenization Solution Market Revenue (Million) Forecast, by Application 2019 & 2032
- Table 26: South Africa Tokenization Solution Market Revenue (Million) Forecast, by Application 2019 & 2032
- Table 27: Global Tokenization Solution Market Revenue Million Forecast, by Type 2019 & 2032
- Table 28: Global Tokenization Solution Market Revenue Million Forecast, by Deployment 2019 & 2032
- Table 29: Global Tokenization Solution Market Revenue Million Forecast, by End-User Industry 2019 & 2032
- Table 30: Global Tokenization Solution Market Revenue Million Forecast, by Country 2019 & 2032
- Table 31: United States Tokenization Solution Market Revenue (Million) Forecast, by Application 2019 & 2032
- Table 32: Canada Tokenization Solution Market Revenue (Million) Forecast, by Application 2019 & 2032
- Table 33: Global Tokenization Solution Market Revenue Million Forecast, by Type 2019 & 2032
- Table 34: Global Tokenization Solution Market Revenue Million Forecast, by Deployment 2019 & 2032
- Table 35: Global Tokenization Solution Market Revenue Million Forecast, by End-User Industry 2019 & 2032
- Table 36: Global Tokenization Solution Market Revenue Million Forecast, by Country 2019 & 2032
- Table 37: United Kingdom Tokenization Solution Market Revenue (Million) Forecast, by Application 2019 & 2032
- Table 38: Germany Tokenization Solution Market Revenue (Million) Forecast, by Application 2019 & 2032
- Table 39: France Tokenization Solution Market Revenue (Million) Forecast, by Application 2019 & 2032
- Table 40: Global Tokenization Solution Market Revenue Million Forecast, by Type 2019 & 2032
- Table 41: Global Tokenization Solution Market Revenue Million Forecast, by Deployment 2019 & 2032
- Table 42: Global Tokenization Solution Market Revenue Million Forecast, by End-User Industry 2019 & 2032
- Table 43: Global Tokenization Solution Market Revenue Million Forecast, by Country 2019 & 2032
- Table 44: China Tokenization Solution Market Revenue (Million) Forecast, by Application 2019 & 2032
- Table 45: India Tokenization Solution Market Revenue (Million) Forecast, by Application 2019 & 2032
- Table 46: Global Tokenization Solution Market Revenue Million Forecast, by Type 2019 & 2032
- Table 47: Global Tokenization Solution Market Revenue Million Forecast, by Deployment 2019 & 2032
- Table 48: Global Tokenization Solution Market Revenue Million Forecast, by End-User Industry 2019 & 2032
- Table 49: Global Tokenization Solution Market Revenue Million Forecast, by Country 2019 & 2032
- Table 50: Global Tokenization Solution Market Revenue Million Forecast, by Type 2019 & 2032
- Table 51: Global Tokenization Solution Market Revenue Million Forecast, by Deployment 2019 & 2032
- Table 52: Global Tokenization Solution Market Revenue Million Forecast, by End-User Industry 2019 & 2032
- Table 53: Global Tokenization Solution Market Revenue Million Forecast, by Country 2019 & 2032
- Table 54: Brazil Tokenization Solution Market Revenue (Million) Forecast, by Application 2019 & 2032
- Table 55: Mexico Tokenization Solution Market Revenue (Million) Forecast, by Application 2019 & 2032
- Table 56: Argentina Tokenization Solution Market Revenue (Million) Forecast, by Application 2019 & 2032
- Table 57: Global Tokenization Solution Market Revenue Million Forecast, by Type 2019 & 2032
- Table 58: Global Tokenization Solution Market Revenue Million Forecast, by Deployment 2019 & 2032
- Table 59: Global Tokenization Solution Market Revenue Million Forecast, by End-User Industry 2019 & 2032
- Table 60: Global Tokenization Solution Market Revenue Million Forecast, by Country 2019 & 2032
- Table 61: Global Tokenization Solution Market Revenue Million Forecast, by Type 2019 & 2032
- Table 62: Global Tokenization Solution Market Revenue Million Forecast, by Deployment 2019 & 2032
- Table 63: Global Tokenization Solution Market Revenue Million Forecast, by End-User Industry 2019 & 2032
- Table 64: Global Tokenization Solution Market Revenue Million Forecast, by Country 2019 & 2032
- Table 65: Saudi Arabia Tokenization Solution Market Revenue (Million) Forecast, by Application 2019 & 2032
- Table 66: South Africa Tokenization Solution Market Revenue (Million) Forecast, by Application 2019 & 2032
Frequently Asked Questions
1. What is the projected Compound Annual Growth Rate (CAGR) of the Tokenization Solution Market?
The projected CAGR is approximately 17.68%.
2. Which companies are prominent players in the Tokenization Solution Market?
Key companies in the market include Fiserv Inc, First Data Corporation, Cardconnect Corporation, Hewlett Packard Enterprise, Liaison Technologies Inc, Thales Group, Ciphercloud Incorporation, Broadcom Inc, Paymetric Inc (A Worldpay Company), Cybersource Corporation, Protegrity USA Inc, 3delta Systems Inc, Tokenex LLC*List Not Exhaustive.
3. What are the main segments of the Tokenization Solution Market?
The market segments include Type, Deployment, End-User Industry.
4. Can you provide details about the market size?
The market size is estimated to be USD 5.35 Million as of 2022.
5. What are some drivers contributing to market growth?
Growing Demand for Secure Payment Gateways; Rising Adoption in E-commerce and Mobile payments; Growing Government Regulations On Data Security.
6. What are the notable trends driving market growth?
BFSI to hold the largest market size.
7. Are there any restraints impacting market growth?
Addressing Vulnerabilities From EMV Standards; Lack of Awareness Due to Similar Products.
8. Can you provide examples of recent developments in the market?
May 2023 - The EY company announced that EY OpsChain ESG is now usable in beta form on the EY Blockchain SaaS platform. The new solution, created on the Ethereum blockchain, would give businesses that find it difficult to precisely measure and manage their carbon footprint a single, verified picture of CO2 emissions (CO2e). Through tokenization, it will also give customers, business partners, and regulators the transparency required to trace emissions and carbon credits throughout an ecosystem.
9. What pricing options are available for accessing the report?
Pricing options include single-user, multi-user, and enterprise licenses priced at USD 4750, USD 5250, and USD 8750 respectively.
10. Is the market size provided in terms of value or volume?
The market size is provided in terms of value, measured in Million.
11. Are there any specific market keywords associated with the report?
Yes, the market keyword associated with the report is "Tokenization Solution Market," which aids in identifying and referencing the specific market segment covered.
12. How do I determine which pricing option suits my needs best?
The pricing options vary based on user requirements and access needs. Individual users may opt for single-user licenses, while businesses requiring broader access may choose multi-user or enterprise licenses for cost-effective access to the report.
13. Are there any additional resources or data provided in the Tokenization Solution Market report?
While the report offers comprehensive insights, it's advisable to review the specific contents or supplementary materials provided to ascertain if additional resources or data are available.
14. How can I stay updated on further developments or reports in the Tokenization Solution Market?
To stay informed about further developments, trends, and reports in the Tokenization Solution Market, consider subscribing to industry newsletters, following relevant companies and organizations, or regularly checking reputable industry news sources and publications.
Methodology
Step 1 - Identification of Relevant Samples Size from Population Database


Step 2 - Approaches for Defining Global Market Size (Value, Volume* & Price*)

Note*: In applicable scenarios
Step 3 - Data Sources
Primary Research
- Web Analytics
- Survey Reports
- Research Institute
- Latest Research Reports
- Opinion Leaders
Secondary Research
- Annual Reports
- White Paper
- Latest Press Release
- Industry Association
- Paid Database
- Investor Presentations

Step 4 - Data Triangulation
Involves using different sources of information in order to increase the validity of a study
These sources are likely to be stakeholders in a program - participants, other researchers, program staff, other community members, and so on.
Then we put all data in single framework & apply various statistical tools to find out the dynamic on the market.
During the analysis stage, feedback from the stakeholder groups would be compared to determine areas of agreement as well as areas of divergence


