
Key Insights
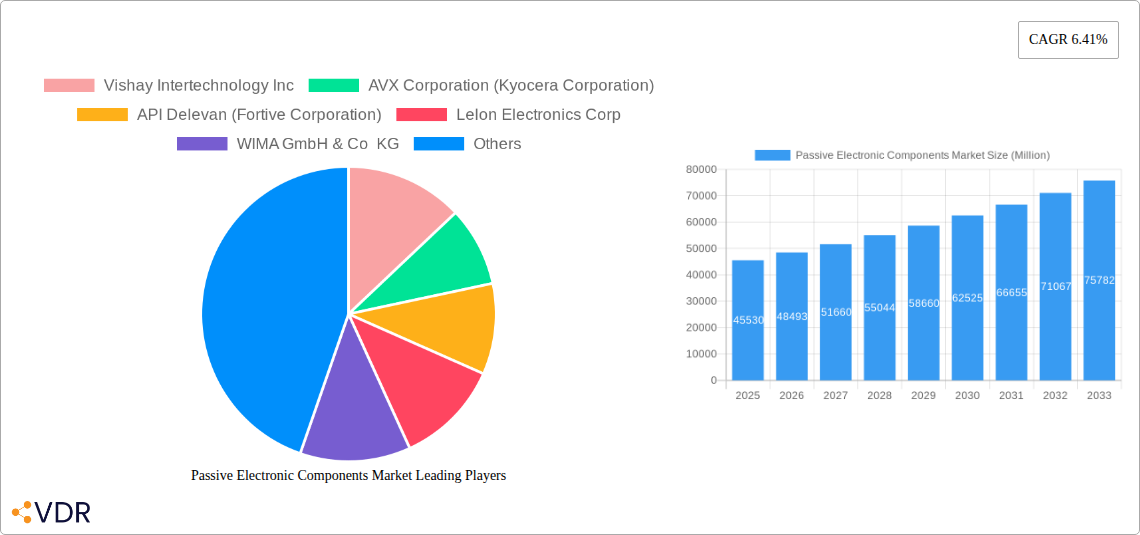
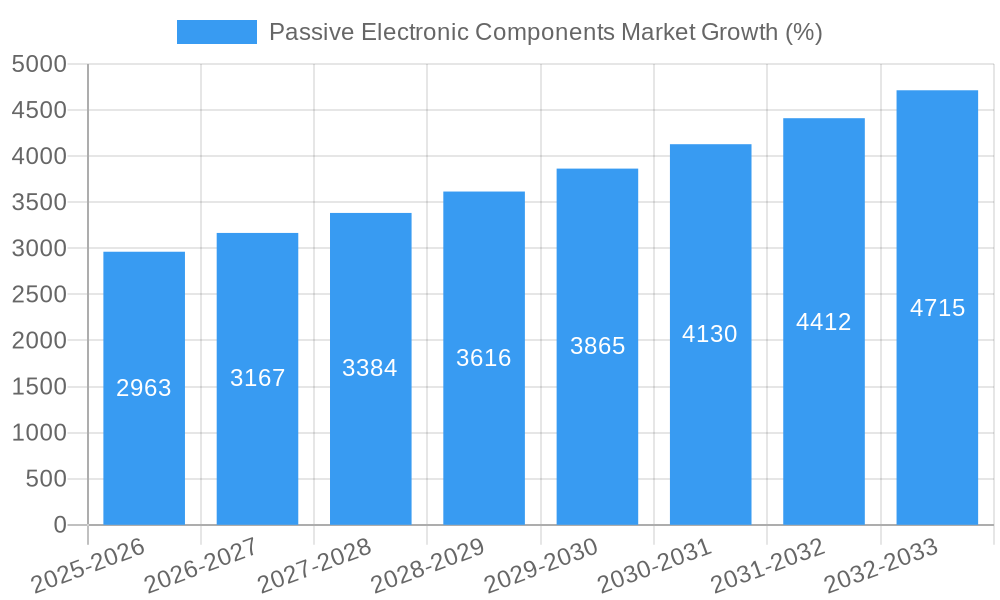
The Passive Electronic Components market, valued at $45.53 billion in 2025, is poised for robust growth, exhibiting a Compound Annual Growth Rate (CAGR) of 6.41% from 2025 to 2033. This expansion is driven by several key factors. The increasing demand for miniaturized and energy-efficient electronics across diverse sectors like automotive, consumer electronics, and industrial automation fuels the market's growth. Advancements in technology, particularly the development of higher-performance and smaller passive components, further contribute to market expansion. The rising adoption of IoT (Internet of Things) devices and the surge in demand for electric vehicles (EVs) also significantly boost market demand, as these applications necessitate a substantial number of passive components. Furthermore, continuous innovation in materials and manufacturing processes leads to improved component reliability and efficiency, making them essential for advanced electronic systems. However, factors like fluctuating raw material prices and intense competition among manufacturers could present challenges to market growth. The market segmentation by capacitor type (ceramic, film, electrolytic) and supercapacitor end-user industry (energy storage, automotive) reflects the diverse applications and specialized needs within the sector. Key players like Vishay Intertechnology, AVX Corporation, and Murata Manufacturing are actively shaping market dynamics through technological innovations and strategic partnerships. Geographical expansion, particularly in rapidly developing economies in Asia Pacific, is anticipated to drive significant future growth.
The market’s segmentation into capacitors (by type – ceramic, film, electrolytic) and supercapacitors (by end-user industry – energy storage, automotive, industrial) allows for a deeper understanding of specific trends. The automotive industry's shift toward electric and hybrid vehicles is fueling substantial demand for high-performance capacitors and supercapacitors. Similarly, the increasing adoption of renewable energy sources and the growth of smart grids are creating opportunities for advanced energy storage solutions leveraging supercapacitor technology. The competitive landscape is marked by both established players and emerging companies, leading to continuous innovation and price competition. Growth strategies focused on product diversification, technological advancement, and strategic acquisitions are key for success in this dynamic market. The forecast period of 2025-2033 presents significant opportunities for growth, particularly in regions with rapidly developing electronics manufacturing sectors.
Passive Electronic Components Market: A Comprehensive Report (2019-2033)
This in-depth report provides a comprehensive analysis of the Passive Electronic Components market, encompassing market dynamics, growth trends, regional dominance, product landscapes, key players, and future outlook. The report covers the period 2019-2033, with a focus on the forecast period 2025-2033 and a base year of 2025. The market is segmented by key product categories like Capacitors (by type) and Supercapacitors (by end-user industry), providing granular insights for informed decision-making. The total market size is projected to reach xx million units by 2033.
Passive Electronic Components Market Dynamics & Structure
The passive electronic components market is characterized by a moderately consolidated structure, with several major players holding significant market share. Market concentration is influenced by technological innovation, stringent regulatory frameworks, and the emergence of competitive substitutes. The market is driven by increasing demand from the automotive, consumer electronics, and industrial automation sectors. M&A activity has played a significant role in shaping the market landscape, with xx major deals recorded between 2019 and 2024.
- Market Concentration: Top 5 players hold approximately xx% of the market share in 2024.
- Technological Innovation: Focus on miniaturization, improved performance, and energy efficiency drives innovation. Barriers to entry include high R&D costs and stringent quality standards.
- Regulatory Frameworks: Compliance with RoHS and REACH regulations impacts material selection and manufacturing processes.
- Competitive Substitutes: The emergence of new materials and technologies poses a challenge to traditional passive components.
- End-User Demographics: Growth is fueled by increasing demand from emerging economies and the proliferation of smart devices.
- M&A Trends: Consolidation through mergers and acquisitions is expected to continue, leading to further market concentration.
Passive Electronic Components Market Growth Trends & Insights
The passive electronic components market experienced robust growth during the historical period (2019-2024), with a CAGR of xx%. This growth is attributed to several factors, including increasing demand from various end-user industries such as automotive, consumer electronics, and industrial automation. Technological advancements, particularly in miniaturization and improved performance, further fueled market expansion. The market is anticipated to maintain a steady growth trajectory during the forecast period (2025-2033), driven by the increasing adoption of IoT devices, the rise of electric vehicles, and the expansion of 5G infrastructure. Market penetration in emerging economies is expected to significantly contribute to this growth. Technological disruptions, such as the development of new materials and improved manufacturing processes, are expected to further enhance market growth. Shifting consumer preferences towards high-performance, energy-efficient devices also plays a pivotal role in shaping market trends.
Dominant Regions, Countries, or Segments in Passive Electronic Components Market
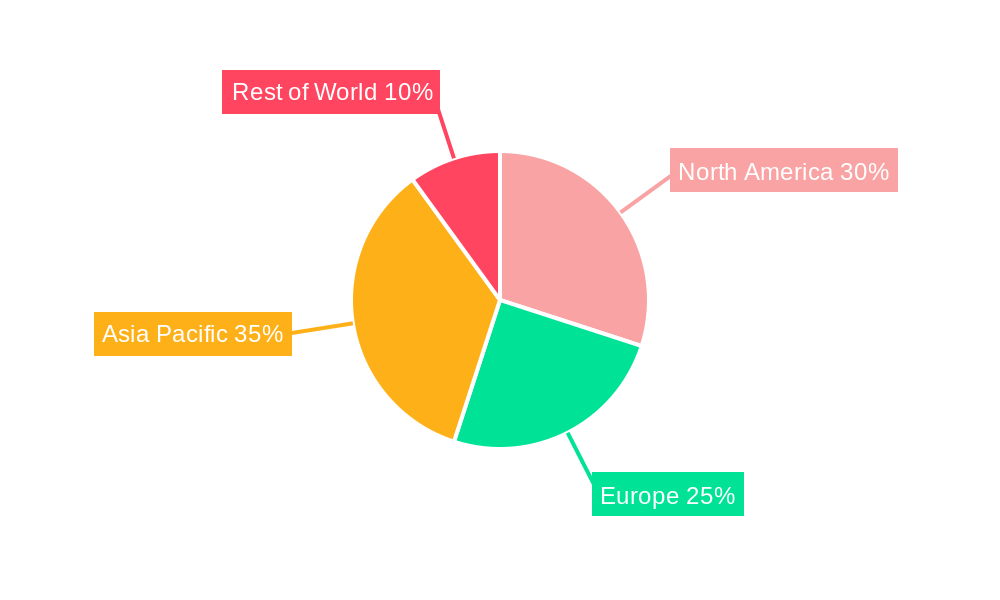
The Asia-Pacific region dominates the passive electronic components market, driven by rapid growth in electronics manufacturing in countries like China, Japan, and South Korea. This dominance is primarily due to the presence of a large manufacturing base, a robust supply chain, and strong government support for the electronics industry. Within the product segments, the capacitor market, specifically ceramic capacitors, exhibits significant growth owing to their widespread use in various electronic devices. The supercapacitor segment is also witnessing substantial growth, particularly in the energy storage applications within the electric vehicle and renewable energy sectors.
- Key Drivers in Asia-Pacific:
- Large and established manufacturing base
- Strong government support for electronics industry
- High demand from consumer electronics and automotive sectors
- Cost-effective manufacturing capabilities.
- Dominance Factors:
- High market share (xx% in 2024)
- Significant growth potential (xx% CAGR projected for 2025-2033)
- Presence of major manufacturers and supply chain ecosystem
Passive Electronic Components Market Product Landscape
The passive electronic components market showcases continuous product innovation, encompassing advanced materials, miniaturized designs, and improved performance characteristics. New product introductions focus on enhancing energy efficiency, increasing reliability, and reducing costs. Key innovations include the development of high-frequency capacitors, high-temperature resistors, and advanced inductor technologies. These advancements cater to the growing demand for smaller, lighter, and more energy-efficient electronic devices across various applications. Unique selling propositions often center on superior performance metrics, extended lifespans, and improved integration capabilities.
Key Drivers, Barriers & Challenges in Passive Electronic Components Market
Key Drivers: The increasing demand for electronic devices across various sectors (automotive, consumer electronics, industrial automation) is a primary driver. Miniaturization trends in electronics necessitate smaller and more efficient passive components. Technological advancements in materials and manufacturing processes continually improve component performance.
Challenges & Restraints: Fluctuations in raw material prices and supply chain disruptions pose significant challenges. Stringent environmental regulations necessitate the use of eco-friendly materials, impacting manufacturing costs. Intense competition among established players and the emergence of new entrants create competitive pressure. The market is estimated to face a xx% impact due to supply chain disruptions in 2024.
Emerging Opportunities in Passive Electronic Components Market
Emerging opportunities lie in the growing adoption of electric vehicles, renewable energy technologies, and the Internet of Things (IoT). The demand for high-performance passive components in these applications is expected to fuel market growth. Untapped markets in developing economies represent significant expansion potential. Innovation in materials and manufacturing processes, leading to smaller, lighter, and more energy-efficient components, creates further opportunities.
Growth Accelerators in the Passive Electronic Components Market Industry
Long-term growth is driven by technological advancements that enhance component performance and reliability. Strategic partnerships and collaborations among manufacturers and technology providers foster innovation and market expansion. The ongoing shift toward automation and the integration of electronics into various industrial applications fuel significant growth prospects.
Key Players Shaping the Passive Electronic Components Market Market
- Vishay Intertechnology Inc
- AVX Corporation (Kyocera Corporation)
- API Delevan (Fortive Corporation)
- Lelon Electronics Corp
- WIMA GmbH & Co KG
- Delta Electronics Inc
- TT Electronics PLC
- Susumu Co Ltd
- Cornell Dubilier Electronics Inc
- Viking Tech Corporation
- Coilcraft Inc
- KOA Speer Electronics Inc
- Yageo Corporation
- TE Connectivity Ltd
- United Chemi-Con (Nippon Chemi-con Corporation)
- Wurth Elektronik Group
- Taiyo Yuden Co Ltd
- Bourns Inc
- TDK Corporation
- Murata Manufacturing Co Ltd
- Sagami Elec Co Ltd
- Ohmite Manufacturing Company
- Panasonic Corporation
- Honeywell International Inc
- Eaton Corporation
Notable Milestones in Passive Electronic Components Market Sector
November 2023: Fukui Murata Manufacturing Co. Ltd. announced plans to establish a new Ceramic Capacitor R&D Center, aiming to improve technological capabilities. Construction commenced in November 2023, with inauguration planned for April 2026. This signifies a significant investment in R&D and underscores the importance of ceramic capacitors in the market.
November 2023: KYOCERA AVX launched its first safety-certified MLCCs (KGK and KGH series), expanding its portfolio of commercial surface-mount MLCCs. This product launch strengthens KYOCERA AVX's position in the safety-critical applications market segment.
In-Depth Passive Electronic Components Market Market Outlook
The future of the passive electronic components market is promising, driven by sustained technological advancements and increasing demand across various industries. Strategic partnerships and collaborations will be crucial for driving innovation and achieving sustainable growth. The market's potential is further amplified by the continued miniaturization of electronic devices and the expansion of applications into emerging sectors like electric vehicles and renewable energy. Companies that successfully adapt to the changing market dynamics and invest in R&D will be well-positioned to capitalize on the numerous growth opportunities.
Passive Electronic Components Market Segmentation
-
1. Type
- 1.1. Capacitors
- 1.2. resistors
- 1.3. inductors
- 1.4. other components
-
2. Application
- 2.1. Consumer electronics
- 2.2. automotive
- 2.3. industrial
- 2.4. healthcare
- 2.5. aerospace & defense
Passive Electronic Components Market Segmentation By Geography
-
1. North America
- 1.1. United States
- 1.2. Canada
- 1.3. Mexico
-
2. Europe
- 2.1. Germany
- 2.2. United Kingdom
- 2.3. France
- 2.4. Italy
- 2.5. Spain
- 2.6. Rest of Europe
-
3. Asia Pacific
- 3.1. China
- 3.2. Japan
- 3.3. India
- 3.4. Australia
- 3.5. South Korea
- 3.6. Rest of Asia Pacific
-
4. Middle East and Africa
- 4.1. GCC
- 4.2. South Africa
- 4.3. Rest of Middle East and Africa
-
5. South America
- 5.1. Brazil
- 5.2. Argentina
- 5.3. Rest of South America
Passive Electronic Components Market REPORT HIGHLIGHTS
| Aspects | Details |
|---|---|
| Study Period | 2019-2033 |
| Base Year | 2024 |
| Estimated Year | 2025 |
| Forecast Period | 2025-2033 |
| Historical Period | 2019-2024 |
| Growth Rate | CAGR of 6.41% from 2019-2033 |
| Segmentation |
|
Table of Contents
- 1. Introduction
- 1.1. Research Scope
- 1.2. Market Segmentation
- 1.3. Research Methodology
- 1.4. Definitions and Assumptions
- 2. Executive Summary
- 2.1. Introduction
- 3. Market Dynamics
- 3.1. Introduction
- 3.2. Market Drivers
- 3.2.1. Increasing Complexity of Electronics; Increasing Miniaturized Design Preferences
- 3.3. Market Restrains
- 3.3.1. Stringent Regulatory Compliance and Safety Standards
- 3.4. Market Trends
- 3.4.1. The Consumer Electronics and Computing Industry in the Inductors Segment is Expected to Hold a Significant Market Share
- 4. Market Factor Analysis
- 4.1. Porters Five Forces
- 4.2. Supply/Value Chain
- 4.3. PESTEL analysis
- 4.4. Market Entropy
- 4.5. Patent/Trademark Analysis
- 5. Global Passive Electronic Components Market Analysis, Insights and Forecast, 2019-2031
- 5.1. Market Analysis, Insights and Forecast - by Type
- 5.1.1. Capacitors
- 5.1.2. resistors
- 5.1.3. inductors
- 5.1.4. other components
- 5.2. Market Analysis, Insights and Forecast - by Application
- 5.2.1. Consumer electronics
- 5.2.2. automotive
- 5.2.3. industrial
- 5.2.4. healthcare
- 5.2.5. aerospace & defense
- 5.3. Market Analysis, Insights and Forecast - by Region
- 5.3.1. North America
- 5.3.2. Europe
- 5.3.3. Asia Pacific
- 5.3.4. Middle East and Africa
- 5.3.5. South America
- 5.1. Market Analysis, Insights and Forecast - by Type
- 6. North America Passive Electronic Components Market Analysis, Insights and Forecast, 2019-2031
- 6.1. Market Analysis, Insights and Forecast - by Type
- 6.1.1. Capacitors
- 6.1.2. resistors
- 6.1.3. inductors
- 6.1.4. other components
- 6.2. Market Analysis, Insights and Forecast - by Application
- 6.2.1. Consumer electronics
- 6.2.2. automotive
- 6.2.3. industrial
- 6.2.4. healthcare
- 6.2.5. aerospace & defense
- 6.1. Market Analysis, Insights and Forecast - by Type
- 7. Europe Passive Electronic Components Market Analysis, Insights and Forecast, 2019-2031
- 7.1. Market Analysis, Insights and Forecast - by Type
- 7.1.1. Capacitors
- 7.1.2. resistors
- 7.1.3. inductors
- 7.1.4. other components
- 7.2. Market Analysis, Insights and Forecast - by Application
- 7.2.1. Consumer electronics
- 7.2.2. automotive
- 7.2.3. industrial
- 7.2.4. healthcare
- 7.2.5. aerospace & defense
- 7.1. Market Analysis, Insights and Forecast - by Type
- 8. Asia Pacific Passive Electronic Components Market Analysis, Insights and Forecast, 2019-2031
- 8.1. Market Analysis, Insights and Forecast - by Type
- 8.1.1. Capacitors
- 8.1.2. resistors
- 8.1.3. inductors
- 8.1.4. other components
- 8.2. Market Analysis, Insights and Forecast - by Application
- 8.2.1. Consumer electronics
- 8.2.2. automotive
- 8.2.3. industrial
- 8.2.4. healthcare
- 8.2.5. aerospace & defense
- 8.1. Market Analysis, Insights and Forecast - by Type
- 9. Middle East and Africa Passive Electronic Components Market Analysis, Insights and Forecast, 2019-2031
- 9.1. Market Analysis, Insights and Forecast - by Type
- 9.1.1. Capacitors
- 9.1.2. resistors
- 9.1.3. inductors
- 9.1.4. other components
- 9.2. Market Analysis, Insights and Forecast - by Application
- 9.2.1. Consumer electronics
- 9.2.2. automotive
- 9.2.3. industrial
- 9.2.4. healthcare
- 9.2.5. aerospace & defense
- 9.1. Market Analysis, Insights and Forecast - by Type
- 10. South America Passive Electronic Components Market Analysis, Insights and Forecast, 2019-2031
- 10.1. Market Analysis, Insights and Forecast - by Type
- 10.1.1. Capacitors
- 10.1.2. resistors
- 10.1.3. inductors
- 10.1.4. other components
- 10.2. Market Analysis, Insights and Forecast - by Application
- 10.2.1. Consumer electronics
- 10.2.2. automotive
- 10.2.3. industrial
- 10.2.4. healthcare
- 10.2.5. aerospace & defense
- 10.1. Market Analysis, Insights and Forecast - by Type
- 11. Europe Passive Electronic Components Market Analysis, Insights and Forecast, 2019-2031
- 12. Asia Pacific Passive Electronic Components Market Analysis, Insights and Forecast, 2019-2031
- 13. Rest of the World Passive Electronic Components Market Analysis, Insights and Forecast, 2019-2031
- 14. Competitive Analysis
- 14.1. Global Market Share Analysis 2024
- 14.2. Company Profiles
- 14.2.1 Vishay Intertechnology Inc
- 14.2.1.1. Overview
- 14.2.1.2. Products
- 14.2.1.3. SWOT Analysis
- 14.2.1.4. Recent Developments
- 14.2.1.5. Financials (Based on Availability)
- 14.2.2 AVX Corporation (Kyocera Corporation)
- 14.2.2.1. Overview
- 14.2.2.2. Products
- 14.2.2.3. SWOT Analysis
- 14.2.2.4. Recent Developments
- 14.2.2.5. Financials (Based on Availability)
- 14.2.3 API Delevan (Fortive Corporation)
- 14.2.3.1. Overview
- 14.2.3.2. Products
- 14.2.3.3. SWOT Analysis
- 14.2.3.4. Recent Developments
- 14.2.3.5. Financials (Based on Availability)
- 14.2.4 Lelon Electronics Corp
- 14.2.4.1. Overview
- 14.2.4.2. Products
- 14.2.4.3. SWOT Analysis
- 14.2.4.4. Recent Developments
- 14.2.4.5. Financials (Based on Availability)
- 14.2.5 WIMA GmbH & Co KG
- 14.2.5.1. Overview
- 14.2.5.2. Products
- 14.2.5.3. SWOT Analysis
- 14.2.5.4. Recent Developments
- 14.2.5.5. Financials (Based on Availability)
- 14.2.6 Delta Electronics Inc
- 14.2.6.1. Overview
- 14.2.6.2. Products
- 14.2.6.3. SWOT Analysis
- 14.2.6.4. Recent Developments
- 14.2.6.5. Financials (Based on Availability)
- 14.2.7 TT Electronics PLC
- 14.2.7.1. Overview
- 14.2.7.2. Products
- 14.2.7.3. SWOT Analysis
- 14.2.7.4. Recent Developments
- 14.2.7.5. Financials (Based on Availability)
- 14.2.8 Susumu Co Ltd
- 14.2.8.1. Overview
- 14.2.8.2. Products
- 14.2.8.3. SWOT Analysis
- 14.2.8.4. Recent Developments
- 14.2.8.5. Financials (Based on Availability)
- 14.2.9 Cornell Dubilier Electronics Inc
- 14.2.9.1. Overview
- 14.2.9.2. Products
- 14.2.9.3. SWOT Analysis
- 14.2.9.4. Recent Developments
- 14.2.9.5. Financials (Based on Availability)
- 14.2.10 Viking Tech Corporation
- 14.2.10.1. Overview
- 14.2.10.2. Products
- 14.2.10.3. SWOT Analysis
- 14.2.10.4. Recent Developments
- 14.2.10.5. Financials (Based on Availability)
- 14.2.11 Coilcraft Inc
- 14.2.11.1. Overview
- 14.2.11.2. Products
- 14.2.11.3. SWOT Analysis
- 14.2.11.4. Recent Developments
- 14.2.11.5. Financials (Based on Availability)
- 14.2.12 KOA Speer Electronics Inc
- 14.2.12.1. Overview
- 14.2.12.2. Products
- 14.2.12.3. SWOT Analysis
- 14.2.12.4. Recent Developments
- 14.2.12.5. Financials (Based on Availability)
- 14.2.13 Yageo Corporation
- 14.2.13.1. Overview
- 14.2.13.2. Products
- 14.2.13.3. SWOT Analysis
- 14.2.13.4. Recent Developments
- 14.2.13.5. Financials (Based on Availability)
- 14.2.14 TE Connectivity Ltd
- 14.2.14.1. Overview
- 14.2.14.2. Products
- 14.2.14.3. SWOT Analysis
- 14.2.14.4. Recent Developments
- 14.2.14.5. Financials (Based on Availability)
- 14.2.15 United Chemi-Con (Nippon Chemi-con Corporation)
- 14.2.15.1. Overview
- 14.2.15.2. Products
- 14.2.15.3. SWOT Analysis
- 14.2.15.4. Recent Developments
- 14.2.15.5. Financials (Based on Availability)
- 14.2.16 Wurth Elektronik Group
- 14.2.16.1. Overview
- 14.2.16.2. Products
- 14.2.16.3. SWOT Analysis
- 14.2.16.4. Recent Developments
- 14.2.16.5. Financials (Based on Availability)
- 14.2.17 Taiyo Yuden Co Ltd
- 14.2.17.1. Overview
- 14.2.17.2. Products
- 14.2.17.3. SWOT Analysis
- 14.2.17.4. Recent Developments
- 14.2.17.5. Financials (Based on Availability)
- 14.2.18 Bourns Inc
- 14.2.18.1. Overview
- 14.2.18.2. Products
- 14.2.18.3. SWOT Analysis
- 14.2.18.4. Recent Developments
- 14.2.18.5. Financials (Based on Availability)
- 14.2.19 TDK Corporation
- 14.2.19.1. Overview
- 14.2.19.2. Products
- 14.2.19.3. SWOT Analysis
- 14.2.19.4. Recent Developments
- 14.2.19.5. Financials (Based on Availability)
- 14.2.20 Murata Manufacturing Co Ltd
- 14.2.20.1. Overview
- 14.2.20.2. Products
- 14.2.20.3. SWOT Analysis
- 14.2.20.4. Recent Developments
- 14.2.20.5. Financials (Based on Availability)
- 14.2.21 Sagami Elec Co Ltd
- 14.2.21.1. Overview
- 14.2.21.2. Products
- 14.2.21.3. SWOT Analysis
- 14.2.21.4. Recent Developments
- 14.2.21.5. Financials (Based on Availability)
- 14.2.22 Ohmite Manufacturing Company
- 14.2.22.1. Overview
- 14.2.22.2. Products
- 14.2.22.3. SWOT Analysis
- 14.2.22.4. Recent Developments
- 14.2.22.5. Financials (Based on Availability)
- 14.2.23 Panasonic Corporation
- 14.2.23.1. Overview
- 14.2.23.2. Products
- 14.2.23.3. SWOT Analysis
- 14.2.23.4. Recent Developments
- 14.2.23.5. Financials (Based on Availability)
- 14.2.24 Honeywell International Inc
- 14.2.24.1. Overview
- 14.2.24.2. Products
- 14.2.24.3. SWOT Analysis
- 14.2.24.4. Recent Developments
- 14.2.24.5. Financials (Based on Availability)
- 14.2.25 Eaton Corporation
- 14.2.25.1. Overview
- 14.2.25.2. Products
- 14.2.25.3. SWOT Analysis
- 14.2.25.4. Recent Developments
- 14.2.25.5. Financials (Based on Availability)
- 14.2.1 Vishay Intertechnology Inc
List of Figures
- Figure 1: Global Passive Electronic Components Market Revenue Breakdown (Million, %) by Region 2024 & 2032
- Figure 2: North America Passive Electronic Components Market Revenue (Million), by Country 2024 & 2032
- Figure 3: North America Passive Electronic Components Market Revenue Share (%), by Country 2024 & 2032
- Figure 4: North America Passive Electronic Components Market Revenue (Million), by Type 2024 & 2032
- Figure 5: North America Passive Electronic Components Market Revenue Share (%), by Type 2024 & 2032
- Figure 6: North America Passive Electronic Components Market Revenue (Million), by Application 2024 & 2032
- Figure 7: North America Passive Electronic Components Market Revenue Share (%), by Application 2024 & 2032
- Figure 8: North America Passive Electronic Components Market Revenue (Million), by Country 2024 & 2032
- Figure 9: North America Passive Electronic Components Market Revenue Share (%), by Country 2024 & 2032
- Figure 10: Europe Passive Electronic Components Market Revenue (Million), by Type 2024 & 2032
- Figure 11: Europe Passive Electronic Components Market Revenue Share (%), by Type 2024 & 2032
- Figure 12: Europe Passive Electronic Components Market Revenue (Million), by Application 2024 & 2032
- Figure 13: Europe Passive Electronic Components Market Revenue Share (%), by Application 2024 & 2032
- Figure 14: Europe Passive Electronic Components Market Revenue (Million), by Country 2024 & 2032
- Figure 15: Europe Passive Electronic Components Market Revenue Share (%), by Country 2024 & 2032
- Figure 16: Asia Pacific Passive Electronic Components Market Revenue (Million), by Type 2024 & 2032
- Figure 17: Asia Pacific Passive Electronic Components Market Revenue Share (%), by Type 2024 & 2032
- Figure 18: Asia Pacific Passive Electronic Components Market Revenue (Million), by Application 2024 & 2032
- Figure 19: Asia Pacific Passive Electronic Components Market Revenue Share (%), by Application 2024 & 2032
- Figure 20: Asia Pacific Passive Electronic Components Market Revenue (Million), by Country 2024 & 2032
- Figure 21: Asia Pacific Passive Electronic Components Market Revenue Share (%), by Country 2024 & 2032
- Figure 22: Middle East and Africa Passive Electronic Components Market Revenue (Million), by Type 2024 & 2032
- Figure 23: Middle East and Africa Passive Electronic Components Market Revenue Share (%), by Type 2024 & 2032
- Figure 24: Middle East and Africa Passive Electronic Components Market Revenue (Million), by Application 2024 & 2032
- Figure 25: Middle East and Africa Passive Electronic Components Market Revenue Share (%), by Application 2024 & 2032
- Figure 26: Middle East and Africa Passive Electronic Components Market Revenue (Million), by Country 2024 & 2032
- Figure 27: Middle East and Africa Passive Electronic Components Market Revenue Share (%), by Country 2024 & 2032
- Figure 28: South America Passive Electronic Components Market Revenue (Million), by Type 2024 & 2032
- Figure 29: South America Passive Electronic Components Market Revenue Share (%), by Type 2024 & 2032
- Figure 30: South America Passive Electronic Components Market Revenue (Million), by Application 2024 & 2032
- Figure 31: South America Passive Electronic Components Market Revenue Share (%), by Application 2024 & 2032
- Figure 32: South America Passive Electronic Components Market Revenue (Million), by Country 2024 & 2032
- Figure 33: South America Passive Electronic Components Market Revenue Share (%), by Country 2024 & 2032
List of Tables
- Table 1: Global Passive Electronic Components Market Revenue Million Forecast, by Region 2019 & 2032
- Table 2: Global Passive Electronic Components Market Revenue Million Forecast, by Type 2019 & 2032
- Table 3: Global Passive Electronic Components Market Revenue Million Forecast, by Application 2019 & 2032
- Table 4: Global Passive Electronic Components Market Revenue Million Forecast, by Region 2019 & 2032
- Table 5: Global Passive Electronic Components Market Revenue Million Forecast, by Country 2019 & 2032
- Table 6: Europe Passive Electronic Components Market Revenue (Million) Forecast, by Application 2019 & 2032
- Table 7: Asia Pacific Passive Electronic Components Market Revenue (Million) Forecast, by Application 2019 & 2032
- Table 8: Rest of the World Passive Electronic Components Market Revenue (Million) Forecast, by Application 2019 & 2032
- Table 9: Global Passive Electronic Components Market Revenue Million Forecast, by Type 2019 & 2032
- Table 10: Global Passive Electronic Components Market Revenue Million Forecast, by Application 2019 & 2032
- Table 11: Global Passive Electronic Components Market Revenue Million Forecast, by Country 2019 & 2032
- Table 12: United States Passive Electronic Components Market Revenue (Million) Forecast, by Application 2019 & 2032
- Table 13: Canada Passive Electronic Components Market Revenue (Million) Forecast, by Application 2019 & 2032
- Table 14: Mexico Passive Electronic Components Market Revenue (Million) Forecast, by Application 2019 & 2032
- Table 15: Global Passive Electronic Components Market Revenue Million Forecast, by Type 2019 & 2032
- Table 16: Global Passive Electronic Components Market Revenue Million Forecast, by Application 2019 & 2032
- Table 17: Global Passive Electronic Components Market Revenue Million Forecast, by Country 2019 & 2032
- Table 18: Germany Passive Electronic Components Market Revenue (Million) Forecast, by Application 2019 & 2032
- Table 19: United Kingdom Passive Electronic Components Market Revenue (Million) Forecast, by Application 2019 & 2032
- Table 20: France Passive Electronic Components Market Revenue (Million) Forecast, by Application 2019 & 2032
- Table 21: Italy Passive Electronic Components Market Revenue (Million) Forecast, by Application 2019 & 2032
- Table 22: Spain Passive Electronic Components Market Revenue (Million) Forecast, by Application 2019 & 2032
- Table 23: Rest of Europe Passive Electronic Components Market Revenue (Million) Forecast, by Application 2019 & 2032
- Table 24: Global Passive Electronic Components Market Revenue Million Forecast, by Type 2019 & 2032
- Table 25: Global Passive Electronic Components Market Revenue Million Forecast, by Application 2019 & 2032
- Table 26: Global Passive Electronic Components Market Revenue Million Forecast, by Country 2019 & 2032
- Table 27: China Passive Electronic Components Market Revenue (Million) Forecast, by Application 2019 & 2032
- Table 28: Japan Passive Electronic Components Market Revenue (Million) Forecast, by Application 2019 & 2032
- Table 29: India Passive Electronic Components Market Revenue (Million) Forecast, by Application 2019 & 2032
- Table 30: Australia Passive Electronic Components Market Revenue (Million) Forecast, by Application 2019 & 2032
- Table 31: South Korea Passive Electronic Components Market Revenue (Million) Forecast, by Application 2019 & 2032
- Table 32: Rest of Asia Pacific Passive Electronic Components Market Revenue (Million) Forecast, by Application 2019 & 2032
- Table 33: Global Passive Electronic Components Market Revenue Million Forecast, by Type 2019 & 2032
- Table 34: Global Passive Electronic Components Market Revenue Million Forecast, by Application 2019 & 2032
- Table 35: Global Passive Electronic Components Market Revenue Million Forecast, by Country 2019 & 2032
- Table 36: GCC Passive Electronic Components Market Revenue (Million) Forecast, by Application 2019 & 2032
- Table 37: South Africa Passive Electronic Components Market Revenue (Million) Forecast, by Application 2019 & 2032
- Table 38: Rest of Middle East and Africa Passive Electronic Components Market Revenue (Million) Forecast, by Application 2019 & 2032
- Table 39: Global Passive Electronic Components Market Revenue Million Forecast, by Type 2019 & 2032
- Table 40: Global Passive Electronic Components Market Revenue Million Forecast, by Application 2019 & 2032
- Table 41: Global Passive Electronic Components Market Revenue Million Forecast, by Country 2019 & 2032
- Table 42: Brazil Passive Electronic Components Market Revenue (Million) Forecast, by Application 2019 & 2032
- Table 43: Argentina Passive Electronic Components Market Revenue (Million) Forecast, by Application 2019 & 2032
- Table 44: Rest of South America Passive Electronic Components Market Revenue (Million) Forecast, by Application 2019 & 2032
Frequently Asked Questions
1. What is the projected Compound Annual Growth Rate (CAGR) of the Passive Electronic Components Market?
The projected CAGR is approximately 6.41%.
2. Which companies are prominent players in the Passive Electronic Components Market?
Key companies in the market include Vishay Intertechnology Inc, AVX Corporation (Kyocera Corporation), API Delevan (Fortive Corporation), Lelon Electronics Corp, WIMA GmbH & Co KG, Delta Electronics Inc, TT Electronics PLC, Susumu Co Ltd, Cornell Dubilier Electronics Inc, Viking Tech Corporation, Coilcraft Inc, KOA Speer Electronics Inc, Yageo Corporation, TE Connectivity Ltd, United Chemi-Con (Nippon Chemi-con Corporation), Wurth Elektronik Group, Taiyo Yuden Co Ltd, Bourns Inc, TDK Corporation, Murata Manufacturing Co Ltd, Sagami Elec Co Ltd, Ohmite Manufacturing Company, Panasonic Corporation, Honeywell International Inc , Eaton Corporation.
3. What are the main segments of the Passive Electronic Components Market?
The market segments include Type, Application.
4. Can you provide details about the market size?
The market size is estimated to be USD 45.53 Million as of 2022.
5. What are some drivers contributing to market growth?
Increasing Complexity of Electronics; Increasing Miniaturized Design Preferences.
6. What are the notable trends driving market growth?
The Consumer Electronics and Computing Industry in the Inductors Segment is Expected to Hold a Significant Market Share.
7. Are there any restraints impacting market growth?
Stringent Regulatory Compliance and Safety Standards.
8. Can you provide examples of recent developments in the market?
November 2023: Fukui Murata Manufacturing Co. Ltd, a manufacturing subsidiary of Murata Manufacturing Co. Ltd, announced its plans to establish a new R&D base, “Ceramic Capacitor R&D Center,” near Echizen-Takefu Station in Fukui Prefecture. The establishment of the Ceramic Capacitor R&D Center aims to improve the company's technological capabilities in developing and manufacturing ceramic capacitors, which is Murata Manufacturing’s core business. The construction commenced in November 2023, with the inauguration planned for April 2026.
9. What pricing options are available for accessing the report?
Pricing options include single-user, multi-user, and enterprise licenses priced at USD 4750, USD 5250, and USD 8750 respectively.
10. Is the market size provided in terms of value or volume?
The market size is provided in terms of value, measured in Million.
11. Are there any specific market keywords associated with the report?
Yes, the market keyword associated with the report is "Passive Electronic Components Market," which aids in identifying and referencing the specific market segment covered.
12. How do I determine which pricing option suits my needs best?
The pricing options vary based on user requirements and access needs. Individual users may opt for single-user licenses, while businesses requiring broader access may choose multi-user or enterprise licenses for cost-effective access to the report.
13. Are there any additional resources or data provided in the Passive Electronic Components Market report?
While the report offers comprehensive insights, it's advisable to review the specific contents or supplementary materials provided to ascertain if additional resources or data are available.
14. How can I stay updated on further developments or reports in the Passive Electronic Components Market?
To stay informed about further developments, trends, and reports in the Passive Electronic Components Market, consider subscribing to industry newsletters, following relevant companies and organizations, or regularly checking reputable industry news sources and publications.
Methodology
Step 1 - Identification of Relevant Samples Size from Population Database


Step 2 - Approaches for Defining Global Market Size (Value, Volume* & Price*)

Note*: In applicable scenarios
Step 3 - Data Sources
Primary Research
- Web Analytics
- Survey Reports
- Research Institute
- Latest Research Reports
- Opinion Leaders
Secondary Research
- Annual Reports
- White Paper
- Latest Press Release
- Industry Association
- Paid Database
- Investor Presentations

Step 4 - Data Triangulation
Involves using different sources of information in order to increase the validity of a study
These sources are likely to be stakeholders in a program - participants, other researchers, program staff, other community members, and so on.
Then we put all data in single framework & apply various statistical tools to find out the dynamic on the market.
During the analysis stage, feedback from the stakeholder groups would be compared to determine areas of agreement as well as areas of divergence


