
Key Insights
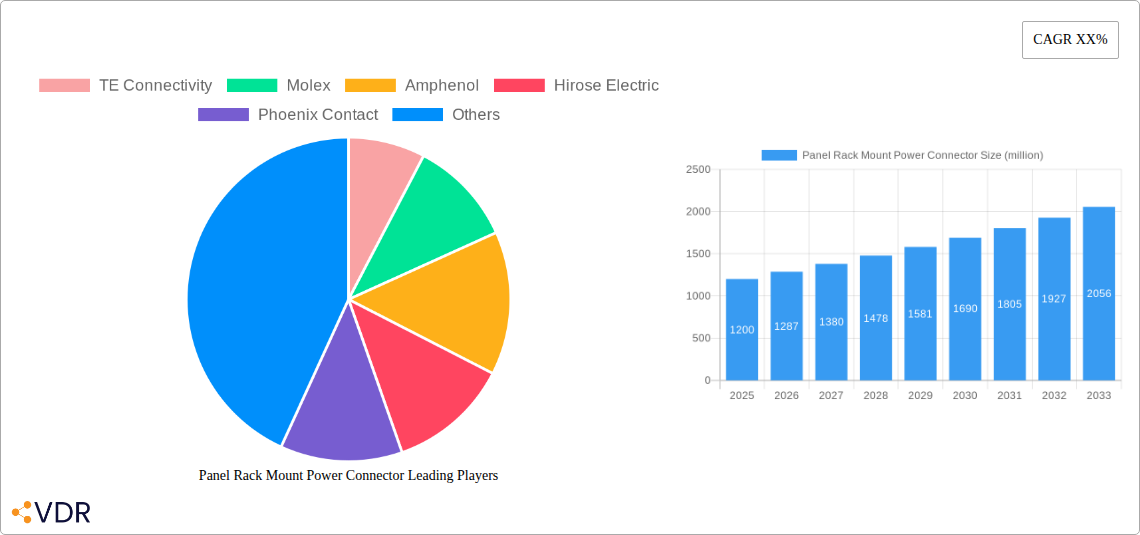
The global Panel Rack Mount Power Connector market is poised for substantial growth, projected to reach an estimated market size of approximately $1,200 million by 2025, with a robust Compound Annual Growth Rate (CAGR) of around 7.5% anticipated between 2025 and 2033. This expansion is primarily fueled by the escalating demand for robust and reliable power connectivity solutions within the burgeoning data center industry. The increasing complexity and power requirements of modern servers, coupled with the relentless growth in cloud computing and big data analytics, necessitate advanced power connectors that offer high current capacity, superior thermal management, and enhanced safety features. Consequently, the adoption of panel rack mount power connectors is becoming indispensable for ensuring uninterrupted operations and system integrity in these critical environments. Furthermore, the ongoing advancements in electrical engineering and material science are driving the development of more compact, efficient, and durable connector designs, further stimulating market demand.
The market is further propelled by the expanding infrastructure of telecommunications networks, the proliferation of industrial automation, and the increasing adoption of advanced power distribution units (PDUs) in various industrial applications. While the market exhibits strong growth drivers, it also faces certain restraints. High manufacturing costs associated with specialized materials and intricate designs, coupled with the stringent regulatory standards for electrical safety and performance in different regions, can pose challenges to market participants. However, the inherent demand for high-performance power solutions in mission-critical applications, such as enterprise servers and industrial control systems, continues to outweigh these constraints. The market is segmented into AC power connectors and DC power connectors, with AC power connectors likely dominating due to the widespread use of AC power in data centers and industrial settings. Server racks and data centers represent the primary applications, underscoring the critical role these connectors play in powering essential IT infrastructure. Key players like TE Connectivity, Molex, and Amphenol are at the forefront of innovation, driving the market with their extensive product portfolios and technological advancements.
Panel Rack Mount Power Connector Market Dynamics & Structure
The global panel rack mount power connector market is characterized by a moderately consolidated structure, with a few key players holding significant market share, alongside a dynamic ecosystem of specialized manufacturers. Technological innovation remains a paramount driver, fueled by the ever-increasing demand for higher power density, improved thermal management, and enhanced reliability in data-intensive environments. The evolution of server rack technology, from 1U to multi-bay configurations, directly influences the design and specifications of these connectors. Regulatory frameworks, particularly concerning electrical safety standards and environmental compliance (e.g., RoHS, REACH), are increasingly shaping product development and manufacturing processes. Competitive product substitutes, though limited for highly specialized rack mount applications, include industrial power distribution units and various cable assemblies, though they often lack the integrated, space-saving benefits of dedicated panel mount connectors. End-user demographics are heavily skewed towards enterprises in the IT, telecommunications, and industrial automation sectors, with a growing presence in renewable energy infrastructure. Mergers and acquisitions (M&A) activity has been steady, driven by companies seeking to expand their product portfolios, gain access to new markets, or acquire innovative technologies. For instance, the acquisition of smaller, specialized connector manufacturers by larger conglomerates is a recurring theme.
- Market Concentration: Dominated by a mix of large, diversified connector manufacturers and niche specialists.
- Technological Innovation Drivers: Higher power handling, miniaturization, EMI/RFI shielding, and hot-swappable capabilities.
- Regulatory Frameworks: Evolving safety certifications (UL, CE), environmental directives (RoHS, REACH), and industry-specific standards.
- Competitive Product Substitutes: Industrial power distribution units, high-current cable assemblies, and plug-in power modules.
- End-User Demographics: Data centers, telecommunications infrastructure, industrial automation, medical equipment, and renewable energy systems.
- M&A Trends: Strategic acquisitions to broaden product offerings and market reach.
Panel Rack Mount Power Connector Growth Trends & Insights
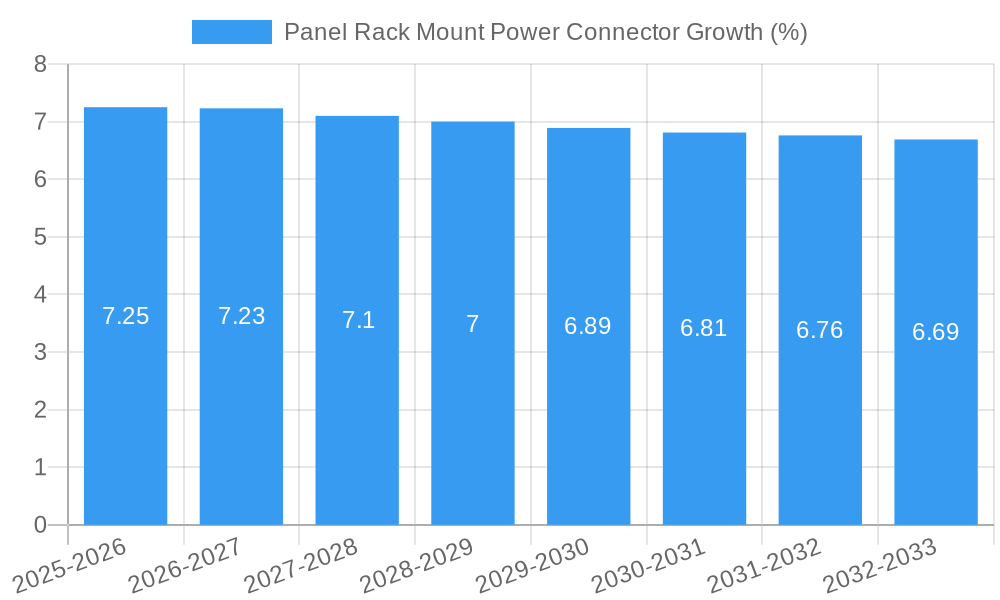
The global panel rack mount power connector market is poised for robust growth, driven by the insatiable demand for digital infrastructure and the escalating power requirements within data centers and server environments. Leveraging advanced analytics and historical data from 2019 to 2024, the market size is projected to witness a significant expansion. The compound annual growth rate (CAGR) is estimated to be around XX% during the forecast period of 2025–2033, reflecting a sustained upward trajectory. This growth is intrinsically linked to the continuous evolution of server hardware, which demands more efficient and higher-capacity power delivery solutions. The widespread adoption of cloud computing, artificial intelligence, and the Internet of Things (IoT) are primary catalysts, necessitating the expansion and upgrading of existing data center facilities and the construction of new ones. Consequently, the demand for reliable, high-performance panel rack mount power connectors is set to surge.
Technological disruptions are playing a pivotal role. Innovations in materials science are enabling connectors with improved thermal dissipation capabilities, crucial for preventing overheating in densely packed racks. Furthermore, advancements in mating and unmating mechanisms are enhancing usability and reducing downtime during maintenance or upgrades. The trend towards miniaturization, driven by space constraints in modern server designs, is pushing manufacturers to develop more compact yet powerful connector solutions. Consumer behavior shifts, particularly among IT infrastructure managers, are leaning towards integrated solutions that offer both power and data connectivity, as well as enhanced safety features. The increasing focus on energy efficiency within data centers also influences connector choices, favoring designs that minimize power loss. The market penetration of advanced, high-density connectors is expected to climb as organizations prioritize operational efficiency and future-proofing their infrastructure. By 2025, the market is estimated to reach a valuation of $XX billion, with substantial growth anticipated over the next decade. The base year of 2025 serves as a crucial benchmark for understanding the current market landscape and projecting future trends.
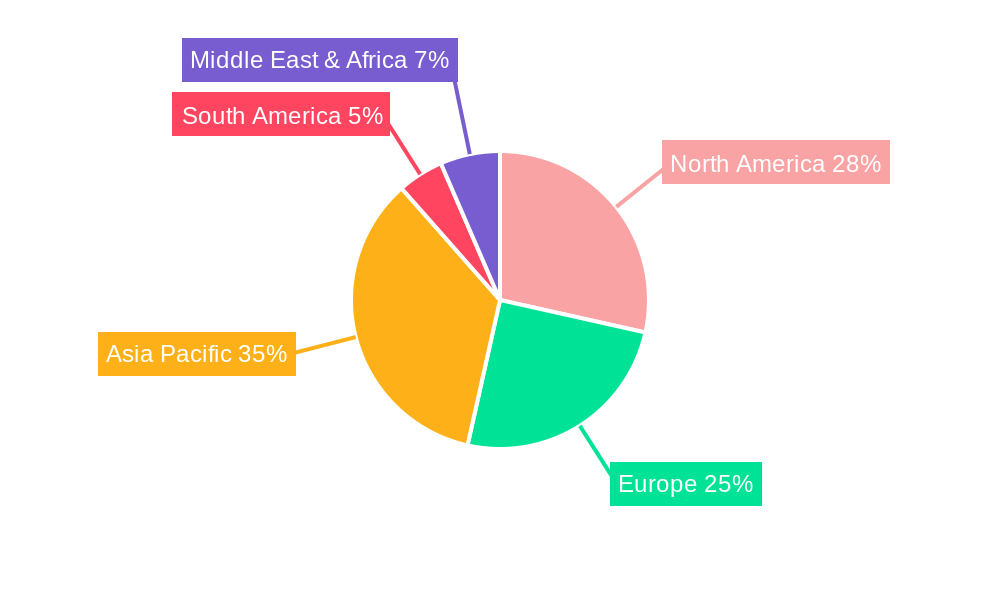
Dominant Regions, Countries, or Segments in Panel Rack Mount Power Connector
The Data Centers segment, across all regions, is the undisputed powerhouse driving the growth of the global panel rack mount power connector market. This dominance stems from the exponential increase in data generation and processing demands, necessitating continuous expansion and modernization of data center infrastructure. North America, particularly the United States, stands out as a leading country due to its established technological ecosystem, significant concentration of hyperscale data centers, and proactive adoption of advanced IT solutions. The region's robust economic policies and substantial investments in digital transformation further bolster its position.
In terms of Applications, the Server Racks segment within data centers is a primary consumer of panel rack mount power connectors. These connectors are critical for providing reliable and efficient power distribution to individual servers, networking equipment, and storage devices housed within these racks. The proliferation of high-performance computing (HPC) and AI workloads, which require immense processing power, directly translates to a higher demand for robust power connectors that can handle increased power loads and ensure uninterrupted operation.
Regarding Types, AC Power Connectors represent a larger share of the market due to their fundamental role in supplying primary power to the vast majority of electronic equipment found in server racks. However, the market is witnessing a significant surge in demand for advanced DC Power Connectors as well, driven by the increasing adoption of DC power distribution within data centers for improved energy efficiency and the proliferation of DC-powered equipment.
Key drivers contributing to this dominance include:
- Economic Policies: Favorable government incentives and investments in digital infrastructure across major economies.
- Infrastructure Development: Continuous construction and upgrading of data centers globally, especially in high-demand regions.
- Technological Advancements: Integration of higher power density, improved cooling, and enhanced safety features in server and networking equipment.
- Cloud Computing Expansion: The relentless growth of cloud services fuels the need for more data storage and processing power.
- AI and Big Data Adoption: The computational demands of AI and big data analytics necessitate highly reliable and powerful infrastructure, including connectors.
The global market size for panel rack mount power connectors is projected to reach $XX billion by 2025, with the data center segment alone accounting for over XX% of this value. Growth potential within this segment remains exceptionally high, driven by ongoing digital transformation initiatives worldwide.
Panel Rack Mount Power Connector Product Landscape
The panel rack mount power connector product landscape is characterized by continuous innovation focused on enhancing power delivery, thermal management, and ease of integration. Manufacturers are developing connectors with higher current and voltage ratings to support increasingly power-hungry server and networking equipment. Advanced materials and design geometries are being employed to improve heat dissipation, a critical factor in preventing thermal runaway within densely populated racks. Innovations in mating and locking mechanisms ensure secure connections and prevent accidental disconnections, crucial for maintaining system uptime. Furthermore, the trend towards miniaturization is leading to more compact connector designs that maximize space utilization within server chassis. The integration of features such as EMI/RFI shielding and robust sealing for harsh environments are also key product differentiators, catering to diverse application requirements from clean data centers to industrial automation.
Key Drivers, Barriers & Challenges in Panel Rack Mount Power Connector
Key Drivers: The panel rack mount power connector market is propelled by several potent forces. The relentless expansion of data centers and the burgeoning demand for cloud computing services are primary catalysts. The increasing adoption of Artificial Intelligence (AI) and the Internet of Things (IoT) necessitate more robust and higher-capacity power solutions for computing infrastructure. Technological advancements in server hardware, demanding greater power density, are a significant driver. Furthermore, the growing emphasis on energy efficiency within data centers favors connector designs that minimize power loss.
Barriers & Challenges: Despite the positive outlook, several challenges can impede market growth. Supply chain disruptions, including raw material shortages and logistics issues, can impact production and delivery timelines, with estimated impacts of XX% on lead times. Stringent and evolving regulatory requirements for electrical safety and environmental compliance can increase manufacturing costs and necessitate product redesigns. Intense competition from established players and emerging manufacturers can exert pressure on pricing. Furthermore, the initial cost of advanced, high-performance connectors can be a barrier for some smaller enterprises. The rapid pace of technological change also presents a challenge, requiring continuous investment in R&D to remain competitive.
Emerging Opportunities in Panel Rack Mount Power Connector
Emerging opportunities in the panel rack mount power connector market lie in the expanding deployment of edge computing infrastructure, which requires localized and ruggedized power solutions. The growing demand for renewable energy systems, particularly solar and wind farms, presents a significant opportunity for connectors capable of handling high power and harsh environmental conditions. Furthermore, the increasing adoption of advanced cooling technologies in data centers, such as liquid cooling, is creating a need for specialized connectors that can interface with these systems. The development of smart connectors with integrated monitoring capabilities for power consumption and temperature is another promising area. The potential for miniaturization and increased power density in connectors for next-generation server architectures also represents a substantial growth avenue.
Growth Accelerators in the Panel Rack Mount Power Connector Industry
Several catalysts are accelerating long-term growth within the panel rack mount power connector industry. The ongoing global digitalization and the subsequent exponential growth in data creation are fundamental growth accelerators. Strategic partnerships between connector manufacturers and server hardware providers are crucial for co-developing solutions that meet evolving industry needs. Market expansion into emerging economies with developing digital infrastructures offers significant untapped potential. Continuous investment in research and development, focusing on next-generation materials and designs that enable higher power density and improved thermal performance, is a key accelerator. The increasing adoption of high-efficiency power architectures within data centers is also driving demand for specialized connectors.
Key Players Shaping the Panel Rack Mount Power Connector Market
TE Connectivity Molex Amphenol Hirose Electric Phoenix Contact Souriau ITT Cannon Samtec FCI Electronics Harting CUI Devices Switchcraft LEMO Weidmuller Bel Power Solutions Bulgin Delta Electronics
Notable Milestones in Panel Rack Mount Power Connector Sector
- 2019: Introduction of higher power density AC connectors for demanding server applications.
- 2020: Launch of modular DC power connector systems for flexible data center power distribution.
- 2021: Development of advanced thermal management solutions integrated into rack mount connectors.
- 2022: Increased focus on sustainable manufacturing practices and materials in connector production.
- 2023: Emergence of smart connectors with built-in diagnostic and monitoring capabilities.
- 2024: Significant advancements in miniaturization leading to smaller form-factor, high-performance connectors.
In-Depth Panel Rack Mount Power Connector Market Outlook
The panel rack mount power connector market is poised for sustained and significant growth, driven by foundational trends in digital transformation and data infrastructure expansion. The continuous need for more powerful and efficient computing resources within data centers, coupled with the rise of AI and IoT, will ensure a robust demand for these critical components. Key growth accelerators include ongoing technological breakthroughs in materials science and electrical engineering, leading to connectors with unprecedented power handling capabilities and thermal efficiency. Strategic partnerships between leading connector manufacturers and server hardware OEMs will further propel innovation and market penetration. As the industry embraces sustainable practices and miniaturization, the market outlook remains exceptionally positive, with projected market expansion into new geographies and emerging applications such as edge computing and advanced renewable energy systems.
Panel Rack Mount Power Connector Segmentation
-
1. Application
- 1.1. Server Racks
- 1.2. Data Centers
- 1.3. Other
-
2. Types
- 2.1. AC Power Connectors
- 2.2. DC Power Connectors
Panel Rack Mount Power Connector Segmentation By Geography
-
1. North America
- 1.1. United States
- 1.2. Canada
- 1.3. Mexico
-
2. South America
- 2.1. Brazil
- 2.2. Argentina
- 2.3. Rest of South America
-
3. Europe
- 3.1. United Kingdom
- 3.2. Germany
- 3.3. France
- 3.4. Italy
- 3.5. Spain
- 3.6. Russia
- 3.7. Benelux
- 3.8. Nordics
- 3.9. Rest of Europe
-
4. Middle East & Africa
- 4.1. Turkey
- 4.2. Israel
- 4.3. GCC
- 4.4. North Africa
- 4.5. South Africa
- 4.6. Rest of Middle East & Africa
-
5. Asia Pacific
- 5.1. China
- 5.2. India
- 5.3. Japan
- 5.4. South Korea
- 5.5. ASEAN
- 5.6. Oceania
- 5.7. Rest of Asia Pacific
Panel Rack Mount Power Connector REPORT HIGHLIGHTS
| Aspects | Details |
|---|---|
| Study Period | 2019-2033 |
| Base Year | 2024 |
| Estimated Year | 2025 |
| Forecast Period | 2025-2033 |
| Historical Period | 2019-2024 |
| Growth Rate | CAGR of XX% from 2019-2033 |
| Segmentation |
|
Table of Contents
- 1. Introduction
- 1.1. Research Scope
- 1.2. Market Segmentation
- 1.3. Research Methodology
- 1.4. Definitions and Assumptions
- 2. Executive Summary
- 2.1. Introduction
- 3. Market Dynamics
- 3.1. Introduction
- 3.2. Market Drivers
- 3.3. Market Restrains
- 3.4. Market Trends
- 4. Market Factor Analysis
- 4.1. Porters Five Forces
- 4.2. Supply/Value Chain
- 4.3. PESTEL analysis
- 4.4. Market Entropy
- 4.5. Patent/Trademark Analysis
- 5. Global Panel Rack Mount Power Connector Analysis, Insights and Forecast, 2019-2031
- 5.1. Market Analysis, Insights and Forecast - by Application
- 5.1.1. Server Racks
- 5.1.2. Data Centers
- 5.1.3. Other
- 5.2. Market Analysis, Insights and Forecast - by Types
- 5.2.1. AC Power Connectors
- 5.2.2. DC Power Connectors
- 5.3. Market Analysis, Insights and Forecast - by Region
- 5.3.1. North America
- 5.3.2. South America
- 5.3.3. Europe
- 5.3.4. Middle East & Africa
- 5.3.5. Asia Pacific
- 5.1. Market Analysis, Insights and Forecast - by Application
- 6. North America Panel Rack Mount Power Connector Analysis, Insights and Forecast, 2019-2031
- 6.1. Market Analysis, Insights and Forecast - by Application
- 6.1.1. Server Racks
- 6.1.2. Data Centers
- 6.1.3. Other
- 6.2. Market Analysis, Insights and Forecast - by Types
- 6.2.1. AC Power Connectors
- 6.2.2. DC Power Connectors
- 6.1. Market Analysis, Insights and Forecast - by Application
- 7. South America Panel Rack Mount Power Connector Analysis, Insights and Forecast, 2019-2031
- 7.1. Market Analysis, Insights and Forecast - by Application
- 7.1.1. Server Racks
- 7.1.2. Data Centers
- 7.1.3. Other
- 7.2. Market Analysis, Insights and Forecast - by Types
- 7.2.1. AC Power Connectors
- 7.2.2. DC Power Connectors
- 7.1. Market Analysis, Insights and Forecast - by Application
- 8. Europe Panel Rack Mount Power Connector Analysis, Insights and Forecast, 2019-2031
- 8.1. Market Analysis, Insights and Forecast - by Application
- 8.1.1. Server Racks
- 8.1.2. Data Centers
- 8.1.3. Other
- 8.2. Market Analysis, Insights and Forecast - by Types
- 8.2.1. AC Power Connectors
- 8.2.2. DC Power Connectors
- 8.1. Market Analysis, Insights and Forecast - by Application
- 9. Middle East & Africa Panel Rack Mount Power Connector Analysis, Insights and Forecast, 2019-2031
- 9.1. Market Analysis, Insights and Forecast - by Application
- 9.1.1. Server Racks
- 9.1.2. Data Centers
- 9.1.3. Other
- 9.2. Market Analysis, Insights and Forecast - by Types
- 9.2.1. AC Power Connectors
- 9.2.2. DC Power Connectors
- 9.1. Market Analysis, Insights and Forecast - by Application
- 10. Asia Pacific Panel Rack Mount Power Connector Analysis, Insights and Forecast, 2019-2031
- 10.1. Market Analysis, Insights and Forecast - by Application
- 10.1.1. Server Racks
- 10.1.2. Data Centers
- 10.1.3. Other
- 10.2. Market Analysis, Insights and Forecast - by Types
- 10.2.1. AC Power Connectors
- 10.2.2. DC Power Connectors
- 10.1. Market Analysis, Insights and Forecast - by Application
- 11. Competitive Analysis
- 11.1. Global Market Share Analysis 2024
- 11.2. Company Profiles
- 11.2.1 TE Connectivity
- 11.2.1.1. Overview
- 11.2.1.2. Products
- 11.2.1.3. SWOT Analysis
- 11.2.1.4. Recent Developments
- 11.2.1.5. Financials (Based on Availability)
- 11.2.2 Molex
- 11.2.2.1. Overview
- 11.2.2.2. Products
- 11.2.2.3. SWOT Analysis
- 11.2.2.4. Recent Developments
- 11.2.2.5. Financials (Based on Availability)
- 11.2.3 Amphenol
- 11.2.3.1. Overview
- 11.2.3.2. Products
- 11.2.3.3. SWOT Analysis
- 11.2.3.4. Recent Developments
- 11.2.3.5. Financials (Based on Availability)
- 11.2.4 Hirose Electric
- 11.2.4.1. Overview
- 11.2.4.2. Products
- 11.2.4.3. SWOT Analysis
- 11.2.4.4. Recent Developments
- 11.2.4.5. Financials (Based on Availability)
- 11.2.5 Phoenix Contact
- 11.2.5.1. Overview
- 11.2.5.2. Products
- 11.2.5.3. SWOT Analysis
- 11.2.5.4. Recent Developments
- 11.2.5.5. Financials (Based on Availability)
- 11.2.6 Souriau
- 11.2.6.1. Overview
- 11.2.6.2. Products
- 11.2.6.3. SWOT Analysis
- 11.2.6.4. Recent Developments
- 11.2.6.5. Financials (Based on Availability)
- 11.2.7 ITT Cannon
- 11.2.7.1. Overview
- 11.2.7.2. Products
- 11.2.7.3. SWOT Analysis
- 11.2.7.4. Recent Developments
- 11.2.7.5. Financials (Based on Availability)
- 11.2.8 Samtec
- 11.2.8.1. Overview
- 11.2.8.2. Products
- 11.2.8.3. SWOT Analysis
- 11.2.8.4. Recent Developments
- 11.2.8.5. Financials (Based on Availability)
- 11.2.9 FCI Electronics
- 11.2.9.1. Overview
- 11.2.9.2. Products
- 11.2.9.3. SWOT Analysis
- 11.2.9.4. Recent Developments
- 11.2.9.5. Financials (Based on Availability)
- 11.2.10 Harting
- 11.2.10.1. Overview
- 11.2.10.2. Products
- 11.2.10.3. SWOT Analysis
- 11.2.10.4. Recent Developments
- 11.2.10.5. Financials (Based on Availability)
- 11.2.11 CUI Devices
- 11.2.11.1. Overview
- 11.2.11.2. Products
- 11.2.11.3. SWOT Analysis
- 11.2.11.4. Recent Developments
- 11.2.11.5. Financials (Based on Availability)
- 11.2.12 Switchcraft
- 11.2.12.1. Overview
- 11.2.12.2. Products
- 11.2.12.3. SWOT Analysis
- 11.2.12.4. Recent Developments
- 11.2.12.5. Financials (Based on Availability)
- 11.2.13 LEMO
- 11.2.13.1. Overview
- 11.2.13.2. Products
- 11.2.13.3. SWOT Analysis
- 11.2.13.4. Recent Developments
- 11.2.13.5. Financials (Based on Availability)
- 11.2.14 Weidmuller
- 11.2.14.1. Overview
- 11.2.14.2. Products
- 11.2.14.3. SWOT Analysis
- 11.2.14.4. Recent Developments
- 11.2.14.5. Financials (Based on Availability)
- 11.2.15 Bel Power Solutions
- 11.2.15.1. Overview
- 11.2.15.2. Products
- 11.2.15.3. SWOT Analysis
- 11.2.15.4. Recent Developments
- 11.2.15.5. Financials (Based on Availability)
- 11.2.16 Bulgin
- 11.2.16.1. Overview
- 11.2.16.2. Products
- 11.2.16.3. SWOT Analysis
- 11.2.16.4. Recent Developments
- 11.2.16.5. Financials (Based on Availability)
- 11.2.17 Delta Electronics
- 11.2.17.1. Overview
- 11.2.17.2. Products
- 11.2.17.3. SWOT Analysis
- 11.2.17.4. Recent Developments
- 11.2.17.5. Financials (Based on Availability)
- 11.2.1 TE Connectivity
List of Figures
- Figure 1: Global Panel Rack Mount Power Connector Revenue Breakdown (million, %) by Region 2024 & 2032
- Figure 2: Global Panel Rack Mount Power Connector Volume Breakdown (K, %) by Region 2024 & 2032
- Figure 3: North America Panel Rack Mount Power Connector Revenue (million), by Application 2024 & 2032
- Figure 4: North America Panel Rack Mount Power Connector Volume (K), by Application 2024 & 2032
- Figure 5: North America Panel Rack Mount Power Connector Revenue Share (%), by Application 2024 & 2032
- Figure 6: North America Panel Rack Mount Power Connector Volume Share (%), by Application 2024 & 2032
- Figure 7: North America Panel Rack Mount Power Connector Revenue (million), by Types 2024 & 2032
- Figure 8: North America Panel Rack Mount Power Connector Volume (K), by Types 2024 & 2032
- Figure 9: North America Panel Rack Mount Power Connector Revenue Share (%), by Types 2024 & 2032
- Figure 10: North America Panel Rack Mount Power Connector Volume Share (%), by Types 2024 & 2032
- Figure 11: North America Panel Rack Mount Power Connector Revenue (million), by Country 2024 & 2032
- Figure 12: North America Panel Rack Mount Power Connector Volume (K), by Country 2024 & 2032
- Figure 13: North America Panel Rack Mount Power Connector Revenue Share (%), by Country 2024 & 2032
- Figure 14: North America Panel Rack Mount Power Connector Volume Share (%), by Country 2024 & 2032
- Figure 15: South America Panel Rack Mount Power Connector Revenue (million), by Application 2024 & 2032
- Figure 16: South America Panel Rack Mount Power Connector Volume (K), by Application 2024 & 2032
- Figure 17: South America Panel Rack Mount Power Connector Revenue Share (%), by Application 2024 & 2032
- Figure 18: South America Panel Rack Mount Power Connector Volume Share (%), by Application 2024 & 2032
- Figure 19: South America Panel Rack Mount Power Connector Revenue (million), by Types 2024 & 2032
- Figure 20: South America Panel Rack Mount Power Connector Volume (K), by Types 2024 & 2032
- Figure 21: South America Panel Rack Mount Power Connector Revenue Share (%), by Types 2024 & 2032
- Figure 22: South America Panel Rack Mount Power Connector Volume Share (%), by Types 2024 & 2032
- Figure 23: South America Panel Rack Mount Power Connector Revenue (million), by Country 2024 & 2032
- Figure 24: South America Panel Rack Mount Power Connector Volume (K), by Country 2024 & 2032
- Figure 25: South America Panel Rack Mount Power Connector Revenue Share (%), by Country 2024 & 2032
- Figure 26: South America Panel Rack Mount Power Connector Volume Share (%), by Country 2024 & 2032
- Figure 27: Europe Panel Rack Mount Power Connector Revenue (million), by Application 2024 & 2032
- Figure 28: Europe Panel Rack Mount Power Connector Volume (K), by Application 2024 & 2032
- Figure 29: Europe Panel Rack Mount Power Connector Revenue Share (%), by Application 2024 & 2032
- Figure 30: Europe Panel Rack Mount Power Connector Volume Share (%), by Application 2024 & 2032
- Figure 31: Europe Panel Rack Mount Power Connector Revenue (million), by Types 2024 & 2032
- Figure 32: Europe Panel Rack Mount Power Connector Volume (K), by Types 2024 & 2032
- Figure 33: Europe Panel Rack Mount Power Connector Revenue Share (%), by Types 2024 & 2032
- Figure 34: Europe Panel Rack Mount Power Connector Volume Share (%), by Types 2024 & 2032
- Figure 35: Europe Panel Rack Mount Power Connector Revenue (million), by Country 2024 & 2032
- Figure 36: Europe Panel Rack Mount Power Connector Volume (K), by Country 2024 & 2032
- Figure 37: Europe Panel Rack Mount Power Connector Revenue Share (%), by Country 2024 & 2032
- Figure 38: Europe Panel Rack Mount Power Connector Volume Share (%), by Country 2024 & 2032
- Figure 39: Middle East & Africa Panel Rack Mount Power Connector Revenue (million), by Application 2024 & 2032
- Figure 40: Middle East & Africa Panel Rack Mount Power Connector Volume (K), by Application 2024 & 2032
- Figure 41: Middle East & Africa Panel Rack Mount Power Connector Revenue Share (%), by Application 2024 & 2032
- Figure 42: Middle East & Africa Panel Rack Mount Power Connector Volume Share (%), by Application 2024 & 2032
- Figure 43: Middle East & Africa Panel Rack Mount Power Connector Revenue (million), by Types 2024 & 2032
- Figure 44: Middle East & Africa Panel Rack Mount Power Connector Volume (K), by Types 2024 & 2032
- Figure 45: Middle East & Africa Panel Rack Mount Power Connector Revenue Share (%), by Types 2024 & 2032
- Figure 46: Middle East & Africa Panel Rack Mount Power Connector Volume Share (%), by Types 2024 & 2032
- Figure 47: Middle East & Africa Panel Rack Mount Power Connector Revenue (million), by Country 2024 & 2032
- Figure 48: Middle East & Africa Panel Rack Mount Power Connector Volume (K), by Country 2024 & 2032
- Figure 49: Middle East & Africa Panel Rack Mount Power Connector Revenue Share (%), by Country 2024 & 2032
- Figure 50: Middle East & Africa Panel Rack Mount Power Connector Volume Share (%), by Country 2024 & 2032
- Figure 51: Asia Pacific Panel Rack Mount Power Connector Revenue (million), by Application 2024 & 2032
- Figure 52: Asia Pacific Panel Rack Mount Power Connector Volume (K), by Application 2024 & 2032
- Figure 53: Asia Pacific Panel Rack Mount Power Connector Revenue Share (%), by Application 2024 & 2032
- Figure 54: Asia Pacific Panel Rack Mount Power Connector Volume Share (%), by Application 2024 & 2032
- Figure 55: Asia Pacific Panel Rack Mount Power Connector Revenue (million), by Types 2024 & 2032
- Figure 56: Asia Pacific Panel Rack Mount Power Connector Volume (K), by Types 2024 & 2032
- Figure 57: Asia Pacific Panel Rack Mount Power Connector Revenue Share (%), by Types 2024 & 2032
- Figure 58: Asia Pacific Panel Rack Mount Power Connector Volume Share (%), by Types 2024 & 2032
- Figure 59: Asia Pacific Panel Rack Mount Power Connector Revenue (million), by Country 2024 & 2032
- Figure 60: Asia Pacific Panel Rack Mount Power Connector Volume (K), by Country 2024 & 2032
- Figure 61: Asia Pacific Panel Rack Mount Power Connector Revenue Share (%), by Country 2024 & 2032
- Figure 62: Asia Pacific Panel Rack Mount Power Connector Volume Share (%), by Country 2024 & 2032
List of Tables
- Table 1: Global Panel Rack Mount Power Connector Revenue million Forecast, by Region 2019 & 2032
- Table 2: Global Panel Rack Mount Power Connector Volume K Forecast, by Region 2019 & 2032
- Table 3: Global Panel Rack Mount Power Connector Revenue million Forecast, by Application 2019 & 2032
- Table 4: Global Panel Rack Mount Power Connector Volume K Forecast, by Application 2019 & 2032
- Table 5: Global Panel Rack Mount Power Connector Revenue million Forecast, by Types 2019 & 2032
- Table 6: Global Panel Rack Mount Power Connector Volume K Forecast, by Types 2019 & 2032
- Table 7: Global Panel Rack Mount Power Connector Revenue million Forecast, by Region 2019 & 2032
- Table 8: Global Panel Rack Mount Power Connector Volume K Forecast, by Region 2019 & 2032
- Table 9: Global Panel Rack Mount Power Connector Revenue million Forecast, by Application 2019 & 2032
- Table 10: Global Panel Rack Mount Power Connector Volume K Forecast, by Application 2019 & 2032
- Table 11: Global Panel Rack Mount Power Connector Revenue million Forecast, by Types 2019 & 2032
- Table 12: Global Panel Rack Mount Power Connector Volume K Forecast, by Types 2019 & 2032
- Table 13: Global Panel Rack Mount Power Connector Revenue million Forecast, by Country 2019 & 2032
- Table 14: Global Panel Rack Mount Power Connector Volume K Forecast, by Country 2019 & 2032
- Table 15: United States Panel Rack Mount Power Connector Revenue (million) Forecast, by Application 2019 & 2032
- Table 16: United States Panel Rack Mount Power Connector Volume (K) Forecast, by Application 2019 & 2032
- Table 17: Canada Panel Rack Mount Power Connector Revenue (million) Forecast, by Application 2019 & 2032
- Table 18: Canada Panel Rack Mount Power Connector Volume (K) Forecast, by Application 2019 & 2032
- Table 19: Mexico Panel Rack Mount Power Connector Revenue (million) Forecast, by Application 2019 & 2032
- Table 20: Mexico Panel Rack Mount Power Connector Volume (K) Forecast, by Application 2019 & 2032
- Table 21: Global Panel Rack Mount Power Connector Revenue million Forecast, by Application 2019 & 2032
- Table 22: Global Panel Rack Mount Power Connector Volume K Forecast, by Application 2019 & 2032
- Table 23: Global Panel Rack Mount Power Connector Revenue million Forecast, by Types 2019 & 2032
- Table 24: Global Panel Rack Mount Power Connector Volume K Forecast, by Types 2019 & 2032
- Table 25: Global Panel Rack Mount Power Connector Revenue million Forecast, by Country 2019 & 2032
- Table 26: Global Panel Rack Mount Power Connector Volume K Forecast, by Country 2019 & 2032
- Table 27: Brazil Panel Rack Mount Power Connector Revenue (million) Forecast, by Application 2019 & 2032
- Table 28: Brazil Panel Rack Mount Power Connector Volume (K) Forecast, by Application 2019 & 2032
- Table 29: Argentina Panel Rack Mount Power Connector Revenue (million) Forecast, by Application 2019 & 2032
- Table 30: Argentina Panel Rack Mount Power Connector Volume (K) Forecast, by Application 2019 & 2032
- Table 31: Rest of South America Panel Rack Mount Power Connector Revenue (million) Forecast, by Application 2019 & 2032
- Table 32: Rest of South America Panel Rack Mount Power Connector Volume (K) Forecast, by Application 2019 & 2032
- Table 33: Global Panel Rack Mount Power Connector Revenue million Forecast, by Application 2019 & 2032
- Table 34: Global Panel Rack Mount Power Connector Volume K Forecast, by Application 2019 & 2032
- Table 35: Global Panel Rack Mount Power Connector Revenue million Forecast, by Types 2019 & 2032
- Table 36: Global Panel Rack Mount Power Connector Volume K Forecast, by Types 2019 & 2032
- Table 37: Global Panel Rack Mount Power Connector Revenue million Forecast, by Country 2019 & 2032
- Table 38: Global Panel Rack Mount Power Connector Volume K Forecast, by Country 2019 & 2032
- Table 39: United Kingdom Panel Rack Mount Power Connector Revenue (million) Forecast, by Application 2019 & 2032
- Table 40: United Kingdom Panel Rack Mount Power Connector Volume (K) Forecast, by Application 2019 & 2032
- Table 41: Germany Panel Rack Mount Power Connector Revenue (million) Forecast, by Application 2019 & 2032
- Table 42: Germany Panel Rack Mount Power Connector Volume (K) Forecast, by Application 2019 & 2032
- Table 43: France Panel Rack Mount Power Connector Revenue (million) Forecast, by Application 2019 & 2032
- Table 44: France Panel Rack Mount Power Connector Volume (K) Forecast, by Application 2019 & 2032
- Table 45: Italy Panel Rack Mount Power Connector Revenue (million) Forecast, by Application 2019 & 2032
- Table 46: Italy Panel Rack Mount Power Connector Volume (K) Forecast, by Application 2019 & 2032
- Table 47: Spain Panel Rack Mount Power Connector Revenue (million) Forecast, by Application 2019 & 2032
- Table 48: Spain Panel Rack Mount Power Connector Volume (K) Forecast, by Application 2019 & 2032
- Table 49: Russia Panel Rack Mount Power Connector Revenue (million) Forecast, by Application 2019 & 2032
- Table 50: Russia Panel Rack Mount Power Connector Volume (K) Forecast, by Application 2019 & 2032
- Table 51: Benelux Panel Rack Mount Power Connector Revenue (million) Forecast, by Application 2019 & 2032
- Table 52: Benelux Panel Rack Mount Power Connector Volume (K) Forecast, by Application 2019 & 2032
- Table 53: Nordics Panel Rack Mount Power Connector Revenue (million) Forecast, by Application 2019 & 2032
- Table 54: Nordics Panel Rack Mount Power Connector Volume (K) Forecast, by Application 2019 & 2032
- Table 55: Rest of Europe Panel Rack Mount Power Connector Revenue (million) Forecast, by Application 2019 & 2032
- Table 56: Rest of Europe Panel Rack Mount Power Connector Volume (K) Forecast, by Application 2019 & 2032
- Table 57: Global Panel Rack Mount Power Connector Revenue million Forecast, by Application 2019 & 2032
- Table 58: Global Panel Rack Mount Power Connector Volume K Forecast, by Application 2019 & 2032
- Table 59: Global Panel Rack Mount Power Connector Revenue million Forecast, by Types 2019 & 2032
- Table 60: Global Panel Rack Mount Power Connector Volume K Forecast, by Types 2019 & 2032
- Table 61: Global Panel Rack Mount Power Connector Revenue million Forecast, by Country 2019 & 2032
- Table 62: Global Panel Rack Mount Power Connector Volume K Forecast, by Country 2019 & 2032
- Table 63: Turkey Panel Rack Mount Power Connector Revenue (million) Forecast, by Application 2019 & 2032
- Table 64: Turkey Panel Rack Mount Power Connector Volume (K) Forecast, by Application 2019 & 2032
- Table 65: Israel Panel Rack Mount Power Connector Revenue (million) Forecast, by Application 2019 & 2032
- Table 66: Israel Panel Rack Mount Power Connector Volume (K) Forecast, by Application 2019 & 2032
- Table 67: GCC Panel Rack Mount Power Connector Revenue (million) Forecast, by Application 2019 & 2032
- Table 68: GCC Panel Rack Mount Power Connector Volume (K) Forecast, by Application 2019 & 2032
- Table 69: North Africa Panel Rack Mount Power Connector Revenue (million) Forecast, by Application 2019 & 2032
- Table 70: North Africa Panel Rack Mount Power Connector Volume (K) Forecast, by Application 2019 & 2032
- Table 71: South Africa Panel Rack Mount Power Connector Revenue (million) Forecast, by Application 2019 & 2032
- Table 72: South Africa Panel Rack Mount Power Connector Volume (K) Forecast, by Application 2019 & 2032
- Table 73: Rest of Middle East & Africa Panel Rack Mount Power Connector Revenue (million) Forecast, by Application 2019 & 2032
- Table 74: Rest of Middle East & Africa Panel Rack Mount Power Connector Volume (K) Forecast, by Application 2019 & 2032
- Table 75: Global Panel Rack Mount Power Connector Revenue million Forecast, by Application 2019 & 2032
- Table 76: Global Panel Rack Mount Power Connector Volume K Forecast, by Application 2019 & 2032
- Table 77: Global Panel Rack Mount Power Connector Revenue million Forecast, by Types 2019 & 2032
- Table 78: Global Panel Rack Mount Power Connector Volume K Forecast, by Types 2019 & 2032
- Table 79: Global Panel Rack Mount Power Connector Revenue million Forecast, by Country 2019 & 2032
- Table 80: Global Panel Rack Mount Power Connector Volume K Forecast, by Country 2019 & 2032
- Table 81: China Panel Rack Mount Power Connector Revenue (million) Forecast, by Application 2019 & 2032
- Table 82: China Panel Rack Mount Power Connector Volume (K) Forecast, by Application 2019 & 2032
- Table 83: India Panel Rack Mount Power Connector Revenue (million) Forecast, by Application 2019 & 2032
- Table 84: India Panel Rack Mount Power Connector Volume (K) Forecast, by Application 2019 & 2032
- Table 85: Japan Panel Rack Mount Power Connector Revenue (million) Forecast, by Application 2019 & 2032
- Table 86: Japan Panel Rack Mount Power Connector Volume (K) Forecast, by Application 2019 & 2032
- Table 87: South Korea Panel Rack Mount Power Connector Revenue (million) Forecast, by Application 2019 & 2032
- Table 88: South Korea Panel Rack Mount Power Connector Volume (K) Forecast, by Application 2019 & 2032
- Table 89: ASEAN Panel Rack Mount Power Connector Revenue (million) Forecast, by Application 2019 & 2032
- Table 90: ASEAN Panel Rack Mount Power Connector Volume (K) Forecast, by Application 2019 & 2032
- Table 91: Oceania Panel Rack Mount Power Connector Revenue (million) Forecast, by Application 2019 & 2032
- Table 92: Oceania Panel Rack Mount Power Connector Volume (K) Forecast, by Application 2019 & 2032
- Table 93: Rest of Asia Pacific Panel Rack Mount Power Connector Revenue (million) Forecast, by Application 2019 & 2032
- Table 94: Rest of Asia Pacific Panel Rack Mount Power Connector Volume (K) Forecast, by Application 2019 & 2032
Frequently Asked Questions
1. What is the projected Compound Annual Growth Rate (CAGR) of the Panel Rack Mount Power Connector?
The projected CAGR is approximately XX%.
2. Which companies are prominent players in the Panel Rack Mount Power Connector?
Key companies in the market include TE Connectivity, Molex, Amphenol, Hirose Electric, Phoenix Contact, Souriau, ITT Cannon, Samtec, FCI Electronics, Harting, CUI Devices, Switchcraft, LEMO, Weidmuller, Bel Power Solutions, Bulgin, Delta Electronics.
3. What are the main segments of the Panel Rack Mount Power Connector?
The market segments include Application, Types.
4. Can you provide details about the market size?
The market size is estimated to be USD XXX million as of 2022.
5. What are some drivers contributing to market growth?
N/A
6. What are the notable trends driving market growth?
N/A
7. Are there any restraints impacting market growth?
N/A
8. Can you provide examples of recent developments in the market?
N/A
9. What pricing options are available for accessing the report?
Pricing options include single-user, multi-user, and enterprise licenses priced at USD 3950.00, USD 5925.00, and USD 7900.00 respectively.
10. Is the market size provided in terms of value or volume?
The market size is provided in terms of value, measured in million and volume, measured in K.
11. Are there any specific market keywords associated with the report?
Yes, the market keyword associated with the report is "Panel Rack Mount Power Connector," which aids in identifying and referencing the specific market segment covered.
12. How do I determine which pricing option suits my needs best?
The pricing options vary based on user requirements and access needs. Individual users may opt for single-user licenses, while businesses requiring broader access may choose multi-user or enterprise licenses for cost-effective access to the report.
13. Are there any additional resources or data provided in the Panel Rack Mount Power Connector report?
While the report offers comprehensive insights, it's advisable to review the specific contents or supplementary materials provided to ascertain if additional resources or data are available.
14. How can I stay updated on further developments or reports in the Panel Rack Mount Power Connector?
To stay informed about further developments, trends, and reports in the Panel Rack Mount Power Connector, consider subscribing to industry newsletters, following relevant companies and organizations, or regularly checking reputable industry news sources and publications.
Methodology
Step 1 - Identification of Relevant Samples Size from Population Database


Step 2 - Approaches for Defining Global Market Size (Value, Volume* & Price*)

Note*: In applicable scenarios
Step 3 - Data Sources
Primary Research
- Web Analytics
- Survey Reports
- Research Institute
- Latest Research Reports
- Opinion Leaders
Secondary Research
- Annual Reports
- White Paper
- Latest Press Release
- Industry Association
- Paid Database
- Investor Presentations

Step 4 - Data Triangulation
Involves using different sources of information in order to increase the validity of a study
These sources are likely to be stakeholders in a program - participants, other researchers, program staff, other community members, and so on.
Then we put all data in single framework & apply various statistical tools to find out the dynamic on the market.
During the analysis stage, feedback from the stakeholder groups would be compared to determine areas of agreement as well as areas of divergence


