

Key Insights
The global Non-Destructive Testing (NDT) market for power generation is experiencing substantial expansion. Driven by the imperative to ensure power plant safety, reliability, and operational longevity, this sector is projected to grow at a Compound Annual Growth Rate (CAGR) of 6.24%. This significant growth trajectory, from a market size of $4.18 billion in the base year 2025, is propelled by stringent regulatory compliance and the ongoing need to maintain aging power infrastructure. The demand for advanced NDT methods, including ultrasonic and radiography testing, remains high for detecting critical component flaws in turbines, boilers, and pipelines. The market is segmented by testing technology (radiography, ultrasonic, visual, eddy current, etc.), equipment, and services. Growth is further supported by the increasing adoption of predictive maintenance strategies, leveraging NDT to prevent failures and optimize efficiency. While initial equipment investment is considerable, the long-term cost savings from avoiding costly repairs and downtime offer significant returns. The integration of digitalization and automation in NDT processes is enhancing inspection speed, accuracy, and efficiency, further stimulating market growth. Key industry leaders are strategically investing in research and development and expanding service portfolios to capture market opportunities. Geographical expansion, especially in rapidly developing Asia-Pacific economies, is also a significant contributor to overall market growth.
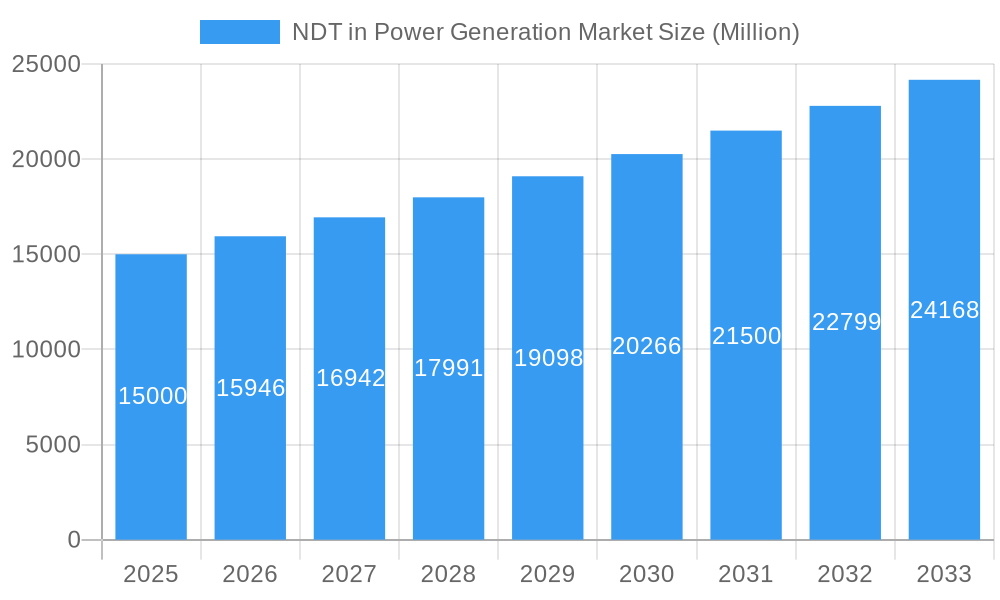
NDT in Power Generation Market Market Size (In Billion)
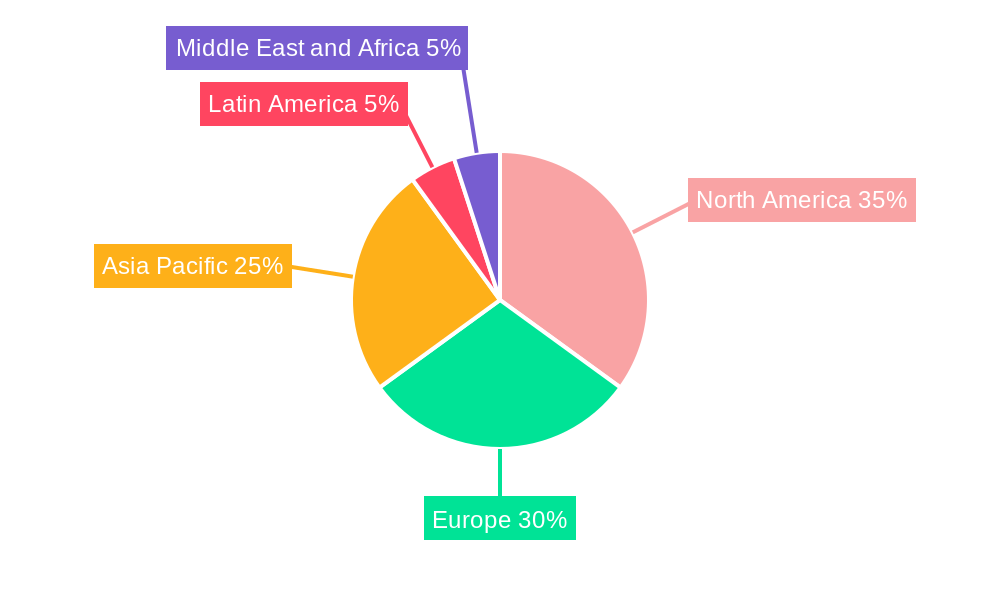
Geographically, the NDT market in power generation is shaped by regional infrastructure development and regulatory environments. North America and Europe currently lead market share due to mature power grids and stringent safety mandates. However, the Asia-Pacific region, led by China and India, exhibits the fastest growth, fueled by rapid industrialization and increased investment in power generation infrastructure, presenting substantial expansion opportunities for NDT providers. Latin America and the Middle East & Africa are also anticipated to grow, albeit at a slower pace, driven by rising energy demands and infrastructure development projects. The competitive landscape is characterized by a dynamic interplay of large multinational corporations and specialized NDT service providers, fostering both consolidation and innovation.
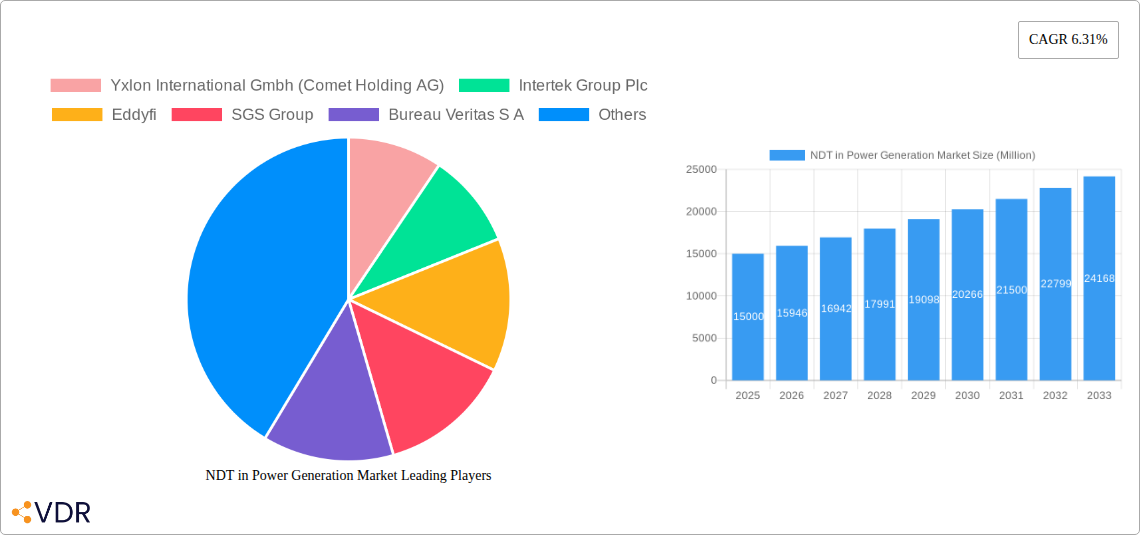
NDT in Power Generation Market Company Market Share
This report offers a comprehensive analysis of the Non-Destructive Testing (NDT) market within the power generation industry. It provides in-depth insights into market dynamics, growth trends, key players, and emerging opportunities, equipping industry professionals with actionable intelligence to navigate this evolving sector. The analysis employs a robust methodology, integrating both qualitative and quantitative data for a thorough and effective understanding of the NDT in Power Generation market.
NDT in Power Generation Market Market Dynamics & Structure
The NDT in power generation market is characterized by moderate concentration, with several major players holding significant market share. The market is driven by stringent safety regulations, aging infrastructure necessitating increased inspections, and the growing adoption of advanced NDT technologies. The increasing demand for renewable energy sources further fuels market growth, with NDT playing a critical role in ensuring the integrity of wind turbines, solar farms, and other renewable energy infrastructure. The market also witnesses continuous technological innovation, with AI and machine learning being integrated into NDT processes to improve accuracy and efficiency. Mergers and acquisitions (M&A) activity is significant, with larger companies acquiring smaller specialized firms to expand their service offerings and geographical reach.
- Market Concentration: Moderately concentrated, with the top 5 players holding approximately xx% of the market share in 2025.
- Technological Innovation: Significant advancements in AI-powered NDT, improved sensor technologies, and faster data processing capabilities are driving market growth.
- Regulatory Framework: Stringent safety and quality standards imposed by governments globally mandate regular NDT inspections, boosting demand.
- Competitive Substitutes: Limited direct substitutes exist for NDT methods; however, cost pressures may lead to some adoption of alternative inspection techniques.
- End-User Demographics: Primarily power generation companies, including utilities, independent power producers (IPPs), and equipment manufacturers.
- M&A Trends: A steady increase in M&A activity, with an estimated xx deals in the power generation NDT sector between 2019 and 2024.
NDT in Power Generation Market Growth Trends & Insights
The NDT in power generation market is experiencing robust growth, driven by increasing investments in power infrastructure, rising demand for enhanced safety, and the adoption of sophisticated NDT technologies. The market size is projected to reach xx Million by 2025 and further expand to xx Million by 2033, exhibiting a compound annual growth rate (CAGR) of xx% during the forecast period (2025-2033). The adoption rate of advanced NDT techniques, such as AI-powered solutions, is growing rapidly, enhancing inspection efficiency and accuracy. Consumer behavior is shifting towards the preference for faster, more reliable, and data-driven NDT services. This trend is pushing the market towards greater digitalization and the adoption of integrated NDT solutions.
Dominant Regions, Countries, or Segments in NDT in Power Generation Market
North America and Europe currently dominate the NDT in power generation market, driven by stringent safety regulations, mature infrastructure, and high adoption rates of advanced NDT technologies. Within these regions, countries with significant power generation capacities, such as the United States, Canada, Germany, and France, exhibit substantial market growth. Among the segments, the services segment holds the largest market share, followed by equipment. Within testing technologies, ultrasonic testing and radiography testing are the most dominant, largely due to their widespread applicability and established industry standards.
- Key Drivers in North America: Stringent safety regulations, robust power generation infrastructure, and substantial investments in renewable energy projects.
- Key Drivers in Europe: Aging power infrastructure requiring frequent inspections, stringent environmental regulations, and increasing adoption of AI-powered NDT solutions.
- Dominant Segment: Services segment holds the largest market share, driven by the outsourcing of NDT services to specialized firms.
- Dominant Testing Technology: Ultrasonic Testing and Radiography Testing dominate due to their established reliability and widespread applicability.
NDT in Power Generation Market Product Landscape
The NDT product landscape is characterized by a diverse range of equipment and services, catering to various testing needs within power generation. Products include advanced ultrasonic testing systems with enhanced resolution and real-time data analysis, portable radiography units with improved safety features, and sophisticated eddy current testing devices offering high sensitivity and accuracy. Key selling propositions include improved accuracy, enhanced speed, and reduced inspection time, leading to cost savings and enhanced operational efficiency. Technological advancements focus on AI-driven automation, data analytics, and advanced visualization capabilities.
Key Drivers, Barriers & Challenges in NDT in Power Generation Market
Key Drivers:
- Increasing demand for reliable and safe power generation infrastructure.
- Stringent regulatory compliance requirements for NDT inspections.
- Growing investments in renewable energy projects requiring rigorous quality control.
- Technological advancements leading to improved NDT techniques and equipment.
Challenges and Restraints:
- High initial investment costs for advanced NDT equipment.
- Skilled labor shortages limiting the availability of qualified NDT technicians.
- The complexity of some NDT techniques requiring specialized expertise.
- Supply chain disruptions impacting the availability of critical components. This has resulted in an estimated xx% increase in the cost of certain NDT equipment.
Emerging Opportunities in NDT in Power Generation Market
- Expansion into emerging markets with growing power generation capacities.
- Adoption of AI-powered NDT solutions for increased efficiency and accuracy.
- Development of specialized NDT techniques for specific materials and applications in renewable energy infrastructure.
- The integration of NDT data with digital twin technologies for predictive maintenance.
Growth Accelerators in the NDT in Power Generation Market Industry
The long-term growth of the NDT in power generation market will be accelerated by continued technological advancements, including the integration of AI and machine learning. Strategic partnerships between NDT providers and power generation companies will enhance the adoption of advanced solutions. The expansion into emerging markets with significant power generation needs, especially within renewable energy sectors, presents substantial growth opportunities. The market will also be driven by initiatives focused on improved workforce training and the development of skilled NDT technicians.
Key Players Shaping the NDT in Power Generation Market Market
Notable Milestones in NDT in Power Generation Market Sector
- June 2022: ALEIA and Omexom NDT Engineering & Services launch the AUTEND project, leveraging AI to accelerate nuclear power plant inspections using eddy current and ultrasonic testing.
- April 2021: IR Supplies and Services partner with Creative Electron, expanding NDT service offerings in Canada's power generation sector.
- March 2021: Applus+ acquires Inecosa and Adícora, strengthening its position in power generation and renewable energy NDT services.
In-Depth NDT in Power Generation Market Market Outlook
The future of the NDT in power generation market is bright, driven by technological advancements, rising safety regulations, and the increasing demand for renewable energy. Strategic partnerships and investments in research and development will further propel market growth. Opportunities abound in the adoption of AI-powered solutions, expansion into emerging markets, and the development of innovative NDT techniques for new materials and technologies. The market is poised for sustained growth, with significant potential for expansion across various regions and segments in the coming years.
NDT in Power Generation Market Segmentation
-
1. Type
- 1.1. Services
- 1.2. Equipment
-
2. Testing Technology
- 2.1. Radiography Testing
- 2.2. Ultrasonic Testing
- 2.3. Visual Inspection Testing
- 2.4. Eddy Current Testing
- 2.5. Other Testing Technologies
NDT in Power Generation Market Segmentation By Geography
-
1. North America
- 1.1. United States
- 1.2. Canada
-
2. Europe
- 2.1. United Kingdom
- 2.2. Germany
- 2.3. France
- 2.4. Rest of Europe
-
3. Asia Pacific
- 3.1. China
- 3.2. Japan
- 3.3. India
- 3.4. Rest of Asia Pacific
- 4. Latin America
- 5. Middle East and Africa
NDT in Power Generation Market Regional Market Share
Geographic Coverage of NDT in Power Generation Market
NDT in Power Generation Market REPORT HIGHLIGHTS
| Aspects | Details |
|---|---|
| Study Period | 2020-2034 |
| Base Year | 2025 |
| Estimated Year | 2026 |
| Forecast Period | 2026-2034 |
| Historical Period | 2020-2025 |
| Growth Rate | CAGR of 6.24% from 2020-2034 |
| Segmentation |
|
Table of Contents
- 1. Introduction
- 1.1. Research Scope
- 1.2. Market Segmentation
- 1.3. Research Objective
- 1.4. Definitions and Assumptions
- 2. Executive Summary
- 2.1. Market Snapshot
- 3. Market Dynamics
- 3.1. Market Drivers
- 3.2. Market Restrains
- 3.3. Market Trends
- 3.4. Market Opportunities
- 4. Market Factor Analysis
- 4.1. Porters Five Forces
- 4.1.1. Bargaining Power of Suppliers
- 4.1.2. Bargaining Power of Buyers
- 4.1.3. Threat of New Entrants
- 4.1.4. Threat of Substitutes
- 4.1.5. Competitive Rivalry
- 4.2. PESTEL analysis
- 4.3. BCG Analysis
- 4.3.1. Stars (High Growth, High Market Share)
- 4.3.2. Cash Cows (Low Growth, High Market Share)
- 4.3.3. Question Mark (High Growth, Low Market Share)
- 4.3.4. Dogs (Low Growth, Low Market Share)
- 4.4. Ansoff Matrix Analysis
- 4.5. Supply Chain Analysis
- 4.6. Regulatory Landscape
- 4.7. Current Market Potential and Opportunity Assessment (TAM–SAM–SOM Framework)
- 4.8. VDR Analyst Note
- 4.1. Porters Five Forces
- 5. Market Analysis, Insights and Forecast 2021-2033
- 5.1. Market Analysis, Insights and Forecast - by Type
- 5.1.1. Services
- 5.1.2. Equipment
- 5.2. Market Analysis, Insights and Forecast - by Testing Technology
- 5.2.1. Radiography Testing
- 5.2.2. Ultrasonic Testing
- 5.2.3. Visual Inspection Testing
- 5.2.4. Eddy Current Testing
- 5.2.5. Other Testing Technologies
- 5.3. Market Analysis, Insights and Forecast - by Region
- 5.3.1. North America
- 5.3.2. Europe
- 5.3.3. Asia Pacific
- 5.3.4. Latin America
- 5.3.5. Middle East and Africa
- 5.1. Market Analysis, Insights and Forecast - by Type
- 6. Global NDT in Power Generation Market Analysis, Insights and Forecast, 2021-2033
- 6.1. Market Analysis, Insights and Forecast - by Type
- 6.1.1. Services
- 6.1.2. Equipment
- 6.2. Market Analysis, Insights and Forecast - by Testing Technology
- 6.2.1. Radiography Testing
- 6.2.2. Ultrasonic Testing
- 6.2.3. Visual Inspection Testing
- 6.2.4. Eddy Current Testing
- 6.2.5. Other Testing Technologies
- 6.1. Market Analysis, Insights and Forecast - by Type
- 7. North America NDT in Power Generation Market Analysis, Insights and Forecast, 2021-2033
- 7.1. Market Analysis, Insights and Forecast - by Type
- 7.1.1. Services
- 7.1.2. Equipment
- 7.2. Market Analysis, Insights and Forecast - by Testing Technology
- 7.2.1. Radiography Testing
- 7.2.2. Ultrasonic Testing
- 7.2.3. Visual Inspection Testing
- 7.2.4. Eddy Current Testing
- 7.2.5. Other Testing Technologies
- 7.1. Market Analysis, Insights and Forecast - by Type
- 8. Europe NDT in Power Generation Market Analysis, Insights and Forecast, 2021-2033
- 8.1. Market Analysis, Insights and Forecast - by Type
- 8.1.1. Services
- 8.1.2. Equipment
- 8.2. Market Analysis, Insights and Forecast - by Testing Technology
- 8.2.1. Radiography Testing
- 8.2.2. Ultrasonic Testing
- 8.2.3. Visual Inspection Testing
- 8.2.4. Eddy Current Testing
- 8.2.5. Other Testing Technologies
- 8.1. Market Analysis, Insights and Forecast - by Type
- 9. Asia Pacific NDT in Power Generation Market Analysis, Insights and Forecast, 2021-2033
- 9.1. Market Analysis, Insights and Forecast - by Type
- 9.1.1. Services
- 9.1.2. Equipment
- 9.2. Market Analysis, Insights and Forecast - by Testing Technology
- 9.2.1. Radiography Testing
- 9.2.2. Ultrasonic Testing
- 9.2.3. Visual Inspection Testing
- 9.2.4. Eddy Current Testing
- 9.2.5. Other Testing Technologies
- 9.1. Market Analysis, Insights and Forecast - by Type
- 10. Latin America NDT in Power Generation Market Analysis, Insights and Forecast, 2021-2033
- 10.1. Market Analysis, Insights and Forecast - by Type
- 10.1.1. Services
- 10.1.2. Equipment
- 10.2. Market Analysis, Insights and Forecast - by Testing Technology
- 10.2.1. Radiography Testing
- 10.2.2. Ultrasonic Testing
- 10.2.3. Visual Inspection Testing
- 10.2.4. Eddy Current Testing
- 10.2.5. Other Testing Technologies
- 10.1. Market Analysis, Insights and Forecast - by Type
- 11. Middle East and Africa NDT in Power Generation Market Analysis, Insights and Forecast, 2021-2033
- 11.1. Market Analysis, Insights and Forecast - by Type
- 11.1.1. Services
- 11.1.2. Equipment
- 11.2. Market Analysis, Insights and Forecast - by Testing Technology
- 11.2.1. Radiography Testing
- 11.2.2. Ultrasonic Testing
- 11.2.3. Visual Inspection Testing
- 11.2.4. Eddy Current Testing
- 11.2.5. Other Testing Technologies
- 11.1. Market Analysis, Insights and Forecast - by Type
- 12. Competitive Analysis
- 12.1. Company Profiles
- 12.1.1 Yxlon International Gmbh (Comet Holding AG)
- 12.1.1.1. Company Overview
- 12.1.1.2. Products
- 12.1.1.3. Company Financials
- 12.1.1.4. SWOT Analysis
- 12.1.2 Intertek Group Plc
- 12.1.2.1. Company Overview
- 12.1.2.2. Products
- 12.1.2.3. Company Financials
- 12.1.2.4. SWOT Analysis
- 12.1.3 Eddyfi
- 12.1.3.1. Company Overview
- 12.1.3.2. Products
- 12.1.3.3. Company Financials
- 12.1.3.4. SWOT Analysis
- 12.1.4 SGS Group
- 12.1.4.1. Company Overview
- 12.1.4.2. Products
- 12.1.4.3. Company Financials
- 12.1.4.4. SWOT Analysis
- 12.1.5 Bureau Veritas S A
- 12.1.5.1. Company Overview
- 12.1.5.2. Products
- 12.1.5.3. Company Financials
- 12.1.5.4. SWOT Analysis
- 12.1.6 Fujifilm Corporation
- 12.1.6.1. Company Overview
- 12.1.6.2. Products
- 12.1.6.3. Company Financials
- 12.1.6.4. SWOT Analysis
- 12.1.7 Mistras Group Inc
- 12.1.7.1. Company Overview
- 12.1.7.2. Products
- 12.1.7.3. Company Financials
- 12.1.7.4. SWOT Analysis
- 12.1.8 Zetec Inc
- 12.1.8.1. Company Overview
- 12.1.8.2. Products
- 12.1.8.3. Company Financials
- 12.1.8.4. SWOT Analysis
- 12.1.9 Applus+ Services Technologies S L
- 12.1.9.1. Company Overview
- 12.1.9.2. Products
- 12.1.9.3. Company Financials
- 12.1.9.4. SWOT Analysis
- 12.1.10 Baker Hughes Company
- 12.1.10.1. Company Overview
- 12.1.10.2. Products
- 12.1.10.3. Company Financials
- 12.1.10.4. SWOT Analysis
- 12.1.11 Team Inc *List Not Exhaustive
- 12.1.11.1. Company Overview
- 12.1.11.2. Products
- 12.1.11.3. Company Financials
- 12.1.11.4. SWOT Analysis
- 12.1.12 Olympus Corporation
- 12.1.12.1. Company Overview
- 12.1.12.2. Products
- 12.1.12.3. Company Financials
- 12.1.12.4. SWOT Analysis
- 12.1.1 Yxlon International Gmbh (Comet Holding AG)
- 12.2. Market Entropy
- 12.2.1 Company's Key Areas Served
- 12.2.2 Recent Developments
- 12.3. Company Market Share Analysis 2025
- 12.3.1 Top 5 Companies Market Share Analysis
- 12.3.2 Top 3 Companies Market Share Analysis
- 12.4. List of Potential Customers
- 13. Research Methodology
List of Figures
- Figure 1: Global NDT in Power Generation Market Revenue Breakdown (billion, %) by Region 2025 & 2033
- Figure 2: North America NDT in Power Generation Market Revenue (billion), by Type 2025 & 2033
- Figure 3: North America NDT in Power Generation Market Revenue Share (%), by Type 2025 & 2033
- Figure 4: North America NDT in Power Generation Market Revenue (billion), by Testing Technology 2025 & 2033
- Figure 5: North America NDT in Power Generation Market Revenue Share (%), by Testing Technology 2025 & 2033
- Figure 6: North America NDT in Power Generation Market Revenue (billion), by Country 2025 & 2033
- Figure 7: North America NDT in Power Generation Market Revenue Share (%), by Country 2025 & 2033
- Figure 8: Europe NDT in Power Generation Market Revenue (billion), by Type 2025 & 2033
- Figure 9: Europe NDT in Power Generation Market Revenue Share (%), by Type 2025 & 2033
- Figure 10: Europe NDT in Power Generation Market Revenue (billion), by Testing Technology 2025 & 2033
- Figure 11: Europe NDT in Power Generation Market Revenue Share (%), by Testing Technology 2025 & 2033
- Figure 12: Europe NDT in Power Generation Market Revenue (billion), by Country 2025 & 2033
- Figure 13: Europe NDT in Power Generation Market Revenue Share (%), by Country 2025 & 2033
- Figure 14: Asia Pacific NDT in Power Generation Market Revenue (billion), by Type 2025 & 2033
- Figure 15: Asia Pacific NDT in Power Generation Market Revenue Share (%), by Type 2025 & 2033
- Figure 16: Asia Pacific NDT in Power Generation Market Revenue (billion), by Testing Technology 2025 & 2033
- Figure 17: Asia Pacific NDT in Power Generation Market Revenue Share (%), by Testing Technology 2025 & 2033
- Figure 18: Asia Pacific NDT in Power Generation Market Revenue (billion), by Country 2025 & 2033
- Figure 19: Asia Pacific NDT in Power Generation Market Revenue Share (%), by Country 2025 & 2033
- Figure 20: Latin America NDT in Power Generation Market Revenue (billion), by Type 2025 & 2033
- Figure 21: Latin America NDT in Power Generation Market Revenue Share (%), by Type 2025 & 2033
- Figure 22: Latin America NDT in Power Generation Market Revenue (billion), by Testing Technology 2025 & 2033
- Figure 23: Latin America NDT in Power Generation Market Revenue Share (%), by Testing Technology 2025 & 2033
- Figure 24: Latin America NDT in Power Generation Market Revenue (billion), by Country 2025 & 2033
- Figure 25: Latin America NDT in Power Generation Market Revenue Share (%), by Country 2025 & 2033
- Figure 26: Middle East and Africa NDT in Power Generation Market Revenue (billion), by Type 2025 & 2033
- Figure 27: Middle East and Africa NDT in Power Generation Market Revenue Share (%), by Type 2025 & 2033
- Figure 28: Middle East and Africa NDT in Power Generation Market Revenue (billion), by Testing Technology 2025 & 2033
- Figure 29: Middle East and Africa NDT in Power Generation Market Revenue Share (%), by Testing Technology 2025 & 2033
- Figure 30: Middle East and Africa NDT in Power Generation Market Revenue (billion), by Country 2025 & 2033
- Figure 31: Middle East and Africa NDT in Power Generation Market Revenue Share (%), by Country 2025 & 2033
List of Tables
- Table 1: Global NDT in Power Generation Market Revenue billion Forecast, by Type 2020 & 2033
- Table 2: Global NDT in Power Generation Market Revenue billion Forecast, by Testing Technology 2020 & 2033
- Table 3: Global NDT in Power Generation Market Revenue billion Forecast, by Region 2020 & 2033
- Table 4: Global NDT in Power Generation Market Revenue billion Forecast, by Type 2020 & 2033
- Table 5: Global NDT in Power Generation Market Revenue billion Forecast, by Testing Technology 2020 & 2033
- Table 6: Global NDT in Power Generation Market Revenue billion Forecast, by Country 2020 & 2033
- Table 7: United States NDT in Power Generation Market Revenue (billion) Forecast, by Application 2020 & 2033
- Table 8: Canada NDT in Power Generation Market Revenue (billion) Forecast, by Application 2020 & 2033
- Table 9: Global NDT in Power Generation Market Revenue billion Forecast, by Type 2020 & 2033
- Table 10: Global NDT in Power Generation Market Revenue billion Forecast, by Testing Technology 2020 & 2033
- Table 11: Global NDT in Power Generation Market Revenue billion Forecast, by Country 2020 & 2033
- Table 12: United Kingdom NDT in Power Generation Market Revenue (billion) Forecast, by Application 2020 & 2033
- Table 13: Germany NDT in Power Generation Market Revenue (billion) Forecast, by Application 2020 & 2033
- Table 14: France NDT in Power Generation Market Revenue (billion) Forecast, by Application 2020 & 2033
- Table 15: Rest of Europe NDT in Power Generation Market Revenue (billion) Forecast, by Application 2020 & 2033
- Table 16: Global NDT in Power Generation Market Revenue billion Forecast, by Type 2020 & 2033
- Table 17: Global NDT in Power Generation Market Revenue billion Forecast, by Testing Technology 2020 & 2033
- Table 18: Global NDT in Power Generation Market Revenue billion Forecast, by Country 2020 & 2033
- Table 19: China NDT in Power Generation Market Revenue (billion) Forecast, by Application 2020 & 2033
- Table 20: Japan NDT in Power Generation Market Revenue (billion) Forecast, by Application 2020 & 2033
- Table 21: India NDT in Power Generation Market Revenue (billion) Forecast, by Application 2020 & 2033
- Table 22: Rest of Asia Pacific NDT in Power Generation Market Revenue (billion) Forecast, by Application 2020 & 2033
- Table 23: Global NDT in Power Generation Market Revenue billion Forecast, by Type 2020 & 2033
- Table 24: Global NDT in Power Generation Market Revenue billion Forecast, by Testing Technology 2020 & 2033
- Table 25: Global NDT in Power Generation Market Revenue billion Forecast, by Country 2020 & 2033
- Table 26: Global NDT in Power Generation Market Revenue billion Forecast, by Type 2020 & 2033
- Table 27: Global NDT in Power Generation Market Revenue billion Forecast, by Testing Technology 2020 & 2033
- Table 28: Global NDT in Power Generation Market Revenue billion Forecast, by Country 2020 & 2033
Frequently Asked Questions
1. What is the projected Compound Annual Growth Rate (CAGR) of the NDT in Power Generation Market?
The projected CAGR is approximately 6.24%.
2. Which companies are prominent players in the NDT in Power Generation Market?
Key companies in the market include Yxlon International Gmbh (Comet Holding AG), Intertek Group Plc, Eddyfi, SGS Group, Bureau Veritas S A, Fujifilm Corporation, Mistras Group Inc, Zetec Inc, Applus+ Services Technologies S L, Baker Hughes Company, Team Inc *List Not Exhaustive, Olympus Corporation.
3. What are the main segments of the NDT in Power Generation Market?
The market segments include Type, Testing Technology.
4. Can you provide details about the market size?
The market size is estimated to be USD 4.18 billion as of 2022.
5. What are some drivers contributing to market growth?
Stringent Regulations Mandating Safety Standards; Increase in Demand for Flaw Detection to Reduce Repair Cost; Aging Infrastructure and Increasing Need for Maintenance.
6. What are the notable trends driving market growth?
Visual Inspection Testing is Expected to Witness a Significant Growth.
7. Are there any restraints impacting market growth?
Lack of Skilled Workforce and Training Regulations.
8. Can you provide examples of recent developments in the market?
June 2022 - ALEIA, a startup specializing in AI, and Omexom NDT Engineering & Services, in collaboration with the Laboratoire d'Acoustique de l'Université du Mans (LAUM) UMR CNRS, have announced the deployment of the AUTEND project. The project is aimed to accelerate the inspection of nuclear power plants through AI. Moreover, the project is presently focusing on Non-Destructive Testing, which is an inspection process for nuclear infrastructures using eddy current or ultrasonic testing methods.
9. What pricing options are available for accessing the report?
Pricing options include single-user, multi-user, and enterprise licenses priced at USD 4750, USD 5250, and USD 8750 respectively.
10. Is the market size provided in terms of value or volume?
The market size is provided in terms of value, measured in billion.
11. Are there any specific market keywords associated with the report?
Yes, the market keyword associated with the report is "NDT in Power Generation Market," which aids in identifying and referencing the specific market segment covered.
12. How do I determine which pricing option suits my needs best?
The pricing options vary based on user requirements and access needs. Individual users may opt for single-user licenses, while businesses requiring broader access may choose multi-user or enterprise licenses for cost-effective access to the report.
13. Are there any additional resources or data provided in the NDT in Power Generation Market report?
While the report offers comprehensive insights, it's advisable to review the specific contents or supplementary materials provided to ascertain if additional resources or data are available.
14. How can I stay updated on further developments or reports in the NDT in Power Generation Market?
To stay informed about further developments, trends, and reports in the NDT in Power Generation Market, consider subscribing to industry newsletters, following relevant companies and organizations, or regularly checking reputable industry news sources and publications.
Methodology
Step 1 - Identification of Relevant Samples Size from Population Database


Step 2 - Approaches for Defining Global Market Size (Value, Volume* & Price*)

Note*: In applicable scenarios
Step 3 - Data Sources
Primary Research
- Web Analytics
- Survey Reports
- Research Institute
- Latest Research Reports
- Opinion Leaders
Secondary Research
- Annual Reports
- White Paper
- Latest Press Release
- Industry Association
- Paid Database
- Investor Presentations

Step 4 - Data Triangulation
Involves using different sources of information in order to increase the validity of a study
These sources are likely to be stakeholders in a program - participants, other researchers, program staff, other community members, and so on.
Then we put all data in single framework & apply various statistical tools to find out the dynamic on the market.
During the analysis stage, feedback from the stakeholder groups would be compared to determine areas of agreement as well as areas of divergence