
Key Insights
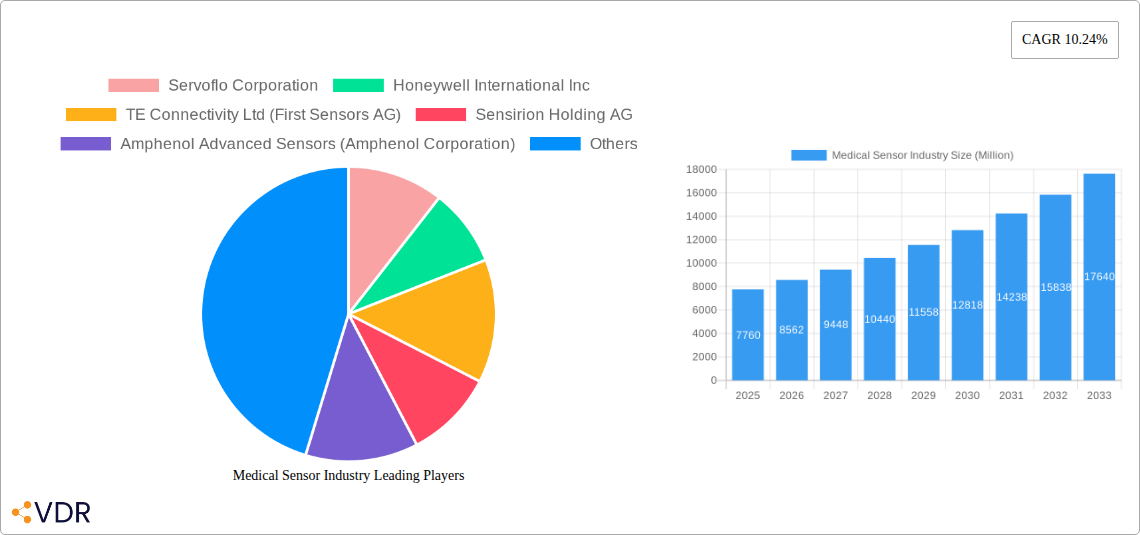
The medical sensor market, valued at $7.76 billion in 2025, is projected to experience robust growth, driven by a compound annual growth rate (CAGR) of 10.24% from 2025 to 2033. This expansion is fueled by several key factors. The increasing prevalence of chronic diseases globally necessitates advanced diagnostic and monitoring tools, significantly boosting the demand for sophisticated medical sensors. Technological advancements, including the development of miniaturized, highly sensitive, and wireless sensors, are enhancing the accuracy and convenience of medical applications. Furthermore, the growing adoption of telehealth and remote patient monitoring systems is further propelling market growth, as these technologies rely heavily on real-time data acquisition through sensors. The integration of artificial intelligence (AI) and machine learning (ML) in medical sensor technology is leading to improved diagnostic capabilities and personalized treatment plans, creating lucrative opportunities within the market. The market is segmented by component (flow, biosensors, temperature, pressure, and others) and application (clinical and consumer). Clinical applications currently dominate, but the consumer segment is rapidly expanding due to the growing awareness of personal health management and the availability of wearable health trackers.
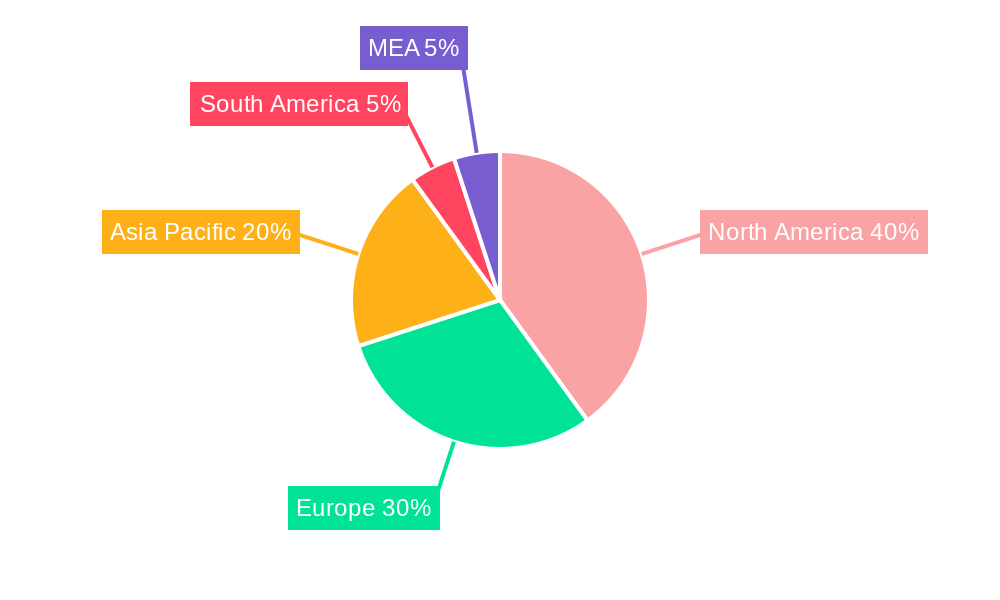
Geographical analysis reveals North America and Europe as currently leading the market, owing to established healthcare infrastructure and high adoption rates of advanced medical technologies. However, the Asia-Pacific region is predicted to exhibit the highest growth potential in the forecast period, driven by rising healthcare expenditure, increasing disposable incomes, and a growing geriatric population. This rapid expansion in the Asia-Pacific region is particularly noticeable in countries like China, India, and Japan, which are investing heavily in improving their healthcare systems and adopting advanced medical technologies. Competitive dynamics within the market are shaped by established players like Honeywell, TE Connectivity, and Siemens, alongside emerging innovative companies. The market is expected to remain highly competitive, with companies focused on product differentiation through enhanced accuracy, miniaturization, and integration with data analytics platforms.
Medical Sensor Industry Market Report: 2019-2033
This comprehensive report provides an in-depth analysis of the Medical Sensor Industry, encompassing market dynamics, growth trends, regional dominance, product landscape, key players, and future outlook. The report covers the period 2019-2033, with a focus on the base year 2025 and a forecast period of 2025-2033. The study segments the market by component (Flow Sensor, Biosensor, Temperature Sensor, Pressure Sensor, Other Types) and application (Clinical Applications, Consumer Applications), providing granular insights into the parent and child markets. The global medical sensor market size is predicted to reach xx Million units by 2033.
Medical Sensor Industry Market Dynamics & Structure
The medical sensor market is characterized by moderate concentration, with several key players holding significant market share. Technological innovation, particularly in miniaturization, wireless connectivity, and AI integration, is a major driver. Stringent regulatory frameworks, including those governing medical device approvals, significantly impact market entry and product development. Competitive pressure from substitute technologies, such as imaging techniques, also plays a role. End-user demographics, including an aging population and increasing prevalence of chronic diseases, fuel demand. M&A activity has been notable, with several significant acquisitions reshaping the competitive landscape.
- Market Concentration: Moderately concentrated, with top 10 players holding approximately xx% market share in 2024.
- Technological Innovation: Miniaturization, wireless capabilities, AI-driven diagnostics are key drivers.
- Regulatory Landscape: Stringent FDA, CE, and other regional approvals create barriers to entry.
- Competitive Substitutes: Imaging technologies (MRI, CT scans) present alternative diagnostic methods.
- End-User Demographics: Aging population and increasing prevalence of chronic diseases drive demand.
- M&A Activity: Significant acquisitions observed in recent years, with an average of xx deals per year between 2019 and 2024.
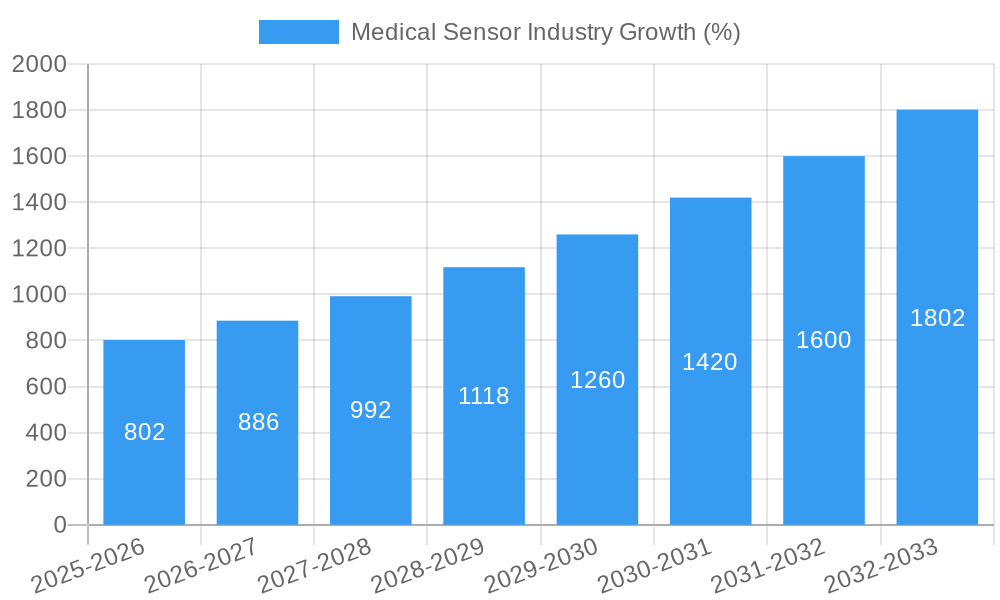
Medical Sensor Industry Growth Trends & Insights
The medical sensor market exhibits robust growth, driven by technological advancements, increasing healthcare expenditure, and rising adoption across various applications. The market experienced a CAGR of xx% during the historical period (2019-2024) and is projected to grow at a CAGR of xx% during the forecast period (2025-2033). This growth is fueled by the increasing demand for point-of-care diagnostics, remote patient monitoring, and wearable health trackers. Technological disruptions, such as the integration of nanotechnology and the Internet of Medical Things (IoMT), are further accelerating market expansion. Consumer behavior shifts towards proactive healthcare management and personalized medicine are also contributing factors. Market penetration of medical sensors in various clinical settings is expected to reach xx% by 2033.
Dominant Regions, Countries, or Segments in Medical Sensor Industry
North America and Europe currently dominate the medical sensor market, owing to well-established healthcare infrastructure, high adoption rates, and substantial research & development investments. However, Asia-Pacific is expected to witness the fastest growth in the coming years due to rising healthcare spending, expanding medical device industry, and a large and aging population.
By Component:
- Biosensors: The biosensor segment is experiencing rapid growth, driven by advancements in diagnostic technologies and increasing demand for personalized medicine. This segment is expected to account for approximately xx% of the market by 2033.
- Temperature Sensors: Widely used in various medical applications, temperature sensors represent a significant market share. Continued innovation in accuracy and miniaturization further enhances its market potential.
By Application:
- Clinical Applications: Clinical applications, including diagnostics, monitoring, and therapeutics, constitute the largest segment, with a market share of approximately xx%. The increasing prevalence of chronic diseases directly fuels this segment's growth.
- Consumer Applications: The consumer applications segment is witnessing rapid growth driven by the rising popularity of wearable health trackers and remote patient monitoring devices. This segment is estimated to reach xx Million units by 2033.
Key Drivers:
- Advanced healthcare infrastructure in developed regions.
- High healthcare expenditure and government initiatives.
- Technological advancements in sensor technology.
- Rising prevalence of chronic diseases.
- Growing adoption of wearable technologies.
Medical Sensor Industry Product Landscape
Medical sensors are witnessing continuous innovations, encompassing improved accuracy, miniaturization, wireless connectivity, and integration with advanced data analytics platforms. Unique selling propositions include enhanced sensitivity, real-time monitoring capabilities, and seamless integration with existing healthcare IT systems. Advancements in materials science, microelectronics, and biocompatible materials contribute to improved sensor performance and patient comfort.
Key Drivers, Barriers & Challenges in Medical Sensor Industry
Key Drivers:
- The increasing prevalence of chronic diseases necessitates continuous health monitoring, driving demand for medical sensors.
- Technological advancements, such as miniaturization and wireless connectivity, enhance usability and accessibility.
- Government initiatives promoting telehealth and remote patient monitoring foster sensor adoption.
Key Challenges and Restraints:
- High initial investment costs for sensor development and manufacturing can limit market entry for smaller companies.
- Stringent regulatory requirements for medical device approval impose significant time and cost burdens.
- Concerns regarding data security and privacy related to patient health data collected by sensors need to be addressed effectively. The market impact of these challenges is estimated to be xx% by 2033.
Emerging Opportunities in Medical Sensor Industry
- Expansion into untapped markets, such as developing economies with increasing healthcare awareness.
- Development of innovative applications, including personalized medicine, smart prosthetics, and advanced diagnostics.
- Integration of AI and machine learning algorithms for improved data analysis and predictive capabilities.
Growth Accelerators in the Medical Sensor Industry
Technological breakthroughs in materials science, microelectronics, and nanotechnology are driving the development of highly sensitive, miniaturized, and cost-effective sensors. Strategic partnerships between sensor manufacturers, healthcare providers, and technology companies are accelerating market growth. Expansion into new markets through distribution agreements and international collaborations is creating new growth opportunities.
Key Players Shaping the Medical Sensor Industry Market
- Servoflo Corporation
- Honeywell International Inc
- TE Connectivity Ltd (First Sensors AG)
- Sensirion Holding AG
- Amphenol Advanced Sensors (Amphenol Corporation)
- Siemens AG
- Omron Corporation
- STMicroelectronics NV
- NXP Semiconductors (Freescale Semiconductor)
- GE Healthcare Inc
Notable Milestones in Medical Sensor Industry Sector
- August 2022: Sibel Health secured USD 33 million in Series B funding for scaling wearable sensors for remote hospital monitoring.
- August 2022: Nottingham Trent University and Nottingham University Hospitals NHS Trust developed a new biosensor for chronic wound monitoring.
- September 2021: TE Connectivity Ltd acquired Toolbox Medical Innovations, Wi Inc., and micro liquid, enhancing its global reach.
- May 2021: Honeywell expanded its ThermoRebellion temperature monitoring solution deployment at Boston Logan International Airport.
In-Depth Medical Sensor Industry Market Outlook
The future of the medical sensor industry is bright, with continued growth driven by technological innovations, increasing healthcare spending, and a growing global population. Strategic partnerships, market expansions, and the development of new applications will further accelerate market expansion. The market is poised for significant growth in the coming years, presenting lucrative opportunities for established players and new entrants alike.
Medical Sensor Industry Segmentation
-
1. Component
- 1.1. Flow Sensor
- 1.2. Biosensor
- 1.3. Temperature Sensor
- 1.4. Pressure Sensor
- 1.5. Other Types
-
2. Application
- 2.1. Clinical Applications
- 2.2. Consumer Applications
Medical Sensor Industry Segmentation By Geography
- 1. North America
- 2. Europe
- 3. Asia
- 4. Australia and New Zealand
- 5. Latin America
- 6. Middle East and Africa
Medical Sensor Industry REPORT HIGHLIGHTS
| Aspects | Details |
|---|---|
| Study Period | 2019-2033 |
| Base Year | 2024 |
| Estimated Year | 2025 |
| Forecast Period | 2025-2033 |
| Historical Period | 2019-2024 |
| Growth Rate | CAGR of 10.24% from 2019-2033 |
| Segmentation |
|
Table of Contents
- 1. Introduction
- 1.1. Research Scope
- 1.2. Market Segmentation
- 1.3. Research Methodology
- 1.4. Definitions and Assumptions
- 2. Executive Summary
- 2.1. Introduction
- 3. Market Dynamics
- 3.1. Introduction
- 3.2. Market Drivers
- 3.2.1. Miniaturization of Sensors Leading to Ease in Integration; Increasing Advancement in Medical Devices and Accessories
- 3.3. Market Restrains
- 3.3.1. Lack of Proper IoT Technology Skills across Healthcare Organizations; High Deployment Cost of Necessary Infrastructure and Connected Medical Devices
- 3.4. Market Trends
- 3.4.1. Pressure Sensors Play a Significant Role in the Medical Sensor Market
- 4. Market Factor Analysis
- 4.1. Porters Five Forces
- 4.2. Supply/Value Chain
- 4.3. PESTEL analysis
- 4.4. Market Entropy
- 4.5. Patent/Trademark Analysis
- 5. Global Medical Sensor Industry Analysis, Insights and Forecast, 2019-2031
- 5.1. Market Analysis, Insights and Forecast - by Component
- 5.1.1. Flow Sensor
- 5.1.2. Biosensor
- 5.1.3. Temperature Sensor
- 5.1.4. Pressure Sensor
- 5.1.5. Other Types
- 5.2. Market Analysis, Insights and Forecast - by Application
- 5.2.1. Clinical Applications
- 5.2.2. Consumer Applications
- 5.3. Market Analysis, Insights and Forecast - by Region
- 5.3.1. North America
- 5.3.2. Europe
- 5.3.3. Asia
- 5.3.4. Australia and New Zealand
- 5.3.5. Latin America
- 5.3.6. Middle East and Africa
- 5.1. Market Analysis, Insights and Forecast - by Component
- 6. North America Medical Sensor Industry Analysis, Insights and Forecast, 2019-2031
- 6.1. Market Analysis, Insights and Forecast - by Component
- 6.1.1. Flow Sensor
- 6.1.2. Biosensor
- 6.1.3. Temperature Sensor
- 6.1.4. Pressure Sensor
- 6.1.5. Other Types
- 6.2. Market Analysis, Insights and Forecast - by Application
- 6.2.1. Clinical Applications
- 6.2.2. Consumer Applications
- 6.1. Market Analysis, Insights and Forecast - by Component
- 7. Europe Medical Sensor Industry Analysis, Insights and Forecast, 2019-2031
- 7.1. Market Analysis, Insights and Forecast - by Component
- 7.1.1. Flow Sensor
- 7.1.2. Biosensor
- 7.1.3. Temperature Sensor
- 7.1.4. Pressure Sensor
- 7.1.5. Other Types
- 7.2. Market Analysis, Insights and Forecast - by Application
- 7.2.1. Clinical Applications
- 7.2.2. Consumer Applications
- 7.1. Market Analysis, Insights and Forecast - by Component
- 8. Asia Medical Sensor Industry Analysis, Insights and Forecast, 2019-2031
- 8.1. Market Analysis, Insights and Forecast - by Component
- 8.1.1. Flow Sensor
- 8.1.2. Biosensor
- 8.1.3. Temperature Sensor
- 8.1.4. Pressure Sensor
- 8.1.5. Other Types
- 8.2. Market Analysis, Insights and Forecast - by Application
- 8.2.1. Clinical Applications
- 8.2.2. Consumer Applications
- 8.1. Market Analysis, Insights and Forecast - by Component
- 9. Australia and New Zealand Medical Sensor Industry Analysis, Insights and Forecast, 2019-2031
- 9.1. Market Analysis, Insights and Forecast - by Component
- 9.1.1. Flow Sensor
- 9.1.2. Biosensor
- 9.1.3. Temperature Sensor
- 9.1.4. Pressure Sensor
- 9.1.5. Other Types
- 9.2. Market Analysis, Insights and Forecast - by Application
- 9.2.1. Clinical Applications
- 9.2.2. Consumer Applications
- 9.1. Market Analysis, Insights and Forecast - by Component
- 10. Latin America Medical Sensor Industry Analysis, Insights and Forecast, 2019-2031
- 10.1. Market Analysis, Insights and Forecast - by Component
- 10.1.1. Flow Sensor
- 10.1.2. Biosensor
- 10.1.3. Temperature Sensor
- 10.1.4. Pressure Sensor
- 10.1.5. Other Types
- 10.2. Market Analysis, Insights and Forecast - by Application
- 10.2.1. Clinical Applications
- 10.2.2. Consumer Applications
- 10.1. Market Analysis, Insights and Forecast - by Component
- 11. Middle East and Africa Medical Sensor Industry Analysis, Insights and Forecast, 2019-2031
- 11.1. Market Analysis, Insights and Forecast - by Component
- 11.1.1. Flow Sensor
- 11.1.2. Biosensor
- 11.1.3. Temperature Sensor
- 11.1.4. Pressure Sensor
- 11.1.5. Other Types
- 11.2. Market Analysis, Insights and Forecast - by Application
- 11.2.1. Clinical Applications
- 11.2.2. Consumer Applications
- 11.1. Market Analysis, Insights and Forecast - by Component
- 12. North America Medical Sensor Industry Analysis, Insights and Forecast, 2019-2031
- 12.1. Market Analysis, Insights and Forecast - By Country/Sub-region
- 12.1.1 United States
- 12.1.2 Canada
- 12.1.3 Mexico
- 13. Europe Medical Sensor Industry Analysis, Insights and Forecast, 2019-2031
- 13.1. Market Analysis, Insights and Forecast - By Country/Sub-region
- 13.1.1 Germany
- 13.1.2 United Kingdom
- 13.1.3 France
- 13.1.4 Spain
- 13.1.5 Italy
- 13.1.6 Spain
- 13.1.7 Belgium
- 13.1.8 Netherland
- 13.1.9 Nordics
- 13.1.10 Rest of Europe
- 14. Asia Pacific Medical Sensor Industry Analysis, Insights and Forecast, 2019-2031
- 14.1. Market Analysis, Insights and Forecast - By Country/Sub-region
- 14.1.1 China
- 14.1.2 Japan
- 14.1.3 India
- 14.1.4 South Korea
- 14.1.5 Southeast Asia
- 14.1.6 Australia
- 14.1.7 Indonesia
- 14.1.8 Phillipes
- 14.1.9 Singapore
- 14.1.10 Thailandc
- 14.1.11 Rest of Asia Pacific
- 15. South America Medical Sensor Industry Analysis, Insights and Forecast, 2019-2031
- 15.1. Market Analysis, Insights and Forecast - By Country/Sub-region
- 15.1.1 Brazil
- 15.1.2 Argentina
- 15.1.3 Peru
- 15.1.4 Chile
- 15.1.5 Colombia
- 15.1.6 Ecuador
- 15.1.7 Venezuela
- 15.1.8 Rest of South America
- 16. North America Medical Sensor Industry Analysis, Insights and Forecast, 2019-2031
- 16.1. Market Analysis, Insights and Forecast - By Country/Sub-region
- 16.1.1 United States
- 16.1.2 Canada
- 16.1.3 Mexico
- 17. MEA Medical Sensor Industry Analysis, Insights and Forecast, 2019-2031
- 17.1. Market Analysis, Insights and Forecast - By Country/Sub-region
- 17.1.1 United Arab Emirates
- 17.1.2 Saudi Arabia
- 17.1.3 South Africa
- 17.1.4 Rest of Middle East and Africa
- 18. Competitive Analysis
- 18.1. Global Market Share Analysis 2024
- 18.2. Company Profiles
- 18.2.1 Servoflo Corporation
- 18.2.1.1. Overview
- 18.2.1.2. Products
- 18.2.1.3. SWOT Analysis
- 18.2.1.4. Recent Developments
- 18.2.1.5. Financials (Based on Availability)
- 18.2.2 Honeywell International Inc
- 18.2.2.1. Overview
- 18.2.2.2. Products
- 18.2.2.3. SWOT Analysis
- 18.2.2.4. Recent Developments
- 18.2.2.5. Financials (Based on Availability)
- 18.2.3 TE Connectivity Ltd (First Sensors AG)
- 18.2.3.1. Overview
- 18.2.3.2. Products
- 18.2.3.3. SWOT Analysis
- 18.2.3.4. Recent Developments
- 18.2.3.5. Financials (Based on Availability)
- 18.2.4 Sensirion Holding AG
- 18.2.4.1. Overview
- 18.2.4.2. Products
- 18.2.4.3. SWOT Analysis
- 18.2.4.4. Recent Developments
- 18.2.4.5. Financials (Based on Availability)
- 18.2.5 Amphenol Advanced Sensors (Amphenol Corporation)
- 18.2.5.1. Overview
- 18.2.5.2. Products
- 18.2.5.3. SWOT Analysis
- 18.2.5.4. Recent Developments
- 18.2.5.5. Financials (Based on Availability)
- 18.2.6 Siemens AG
- 18.2.6.1. Overview
- 18.2.6.2. Products
- 18.2.6.3. SWOT Analysis
- 18.2.6.4. Recent Developments
- 18.2.6.5. Financials (Based on Availability)
- 18.2.7 Omron Corporation
- 18.2.7.1. Overview
- 18.2.7.2. Products
- 18.2.7.3. SWOT Analysis
- 18.2.7.4. Recent Developments
- 18.2.7.5. Financials (Based on Availability)
- 18.2.8 STMicroelectronics NV
- 18.2.8.1. Overview
- 18.2.8.2. Products
- 18.2.8.3. SWOT Analysis
- 18.2.8.4. Recent Developments
- 18.2.8.5. Financials (Based on Availability)
- 18.2.9 NXP Semiconductors (Freescale Semiconductor)
- 18.2.9.1. Overview
- 18.2.9.2. Products
- 18.2.9.3. SWOT Analysis
- 18.2.9.4. Recent Developments
- 18.2.9.5. Financials (Based on Availability)
- 18.2.10 GE Healthcare Inc
- 18.2.10.1. Overview
- 18.2.10.2. Products
- 18.2.10.3. SWOT Analysis
- 18.2.10.4. Recent Developments
- 18.2.10.5. Financials (Based on Availability)
- 18.2.1 Servoflo Corporation
List of Figures
- Figure 1: Global Medical Sensor Industry Revenue Breakdown (Million, %) by Region 2024 & 2032
- Figure 2: Global Medical Sensor Industry Volume Breakdown (K Unit, %) by Region 2024 & 2032
- Figure 3: North America Medical Sensor Industry Revenue (Million), by Country 2024 & 2032
- Figure 4: North America Medical Sensor Industry Volume (K Unit), by Country 2024 & 2032
- Figure 5: North America Medical Sensor Industry Revenue Share (%), by Country 2024 & 2032
- Figure 6: North America Medical Sensor Industry Volume Share (%), by Country 2024 & 2032
- Figure 7: Europe Medical Sensor Industry Revenue (Million), by Country 2024 & 2032
- Figure 8: Europe Medical Sensor Industry Volume (K Unit), by Country 2024 & 2032
- Figure 9: Europe Medical Sensor Industry Revenue Share (%), by Country 2024 & 2032
- Figure 10: Europe Medical Sensor Industry Volume Share (%), by Country 2024 & 2032
- Figure 11: Asia Pacific Medical Sensor Industry Revenue (Million), by Country 2024 & 2032
- Figure 12: Asia Pacific Medical Sensor Industry Volume (K Unit), by Country 2024 & 2032
- Figure 13: Asia Pacific Medical Sensor Industry Revenue Share (%), by Country 2024 & 2032
- Figure 14: Asia Pacific Medical Sensor Industry Volume Share (%), by Country 2024 & 2032
- Figure 15: South America Medical Sensor Industry Revenue (Million), by Country 2024 & 2032
- Figure 16: South America Medical Sensor Industry Volume (K Unit), by Country 2024 & 2032
- Figure 17: South America Medical Sensor Industry Revenue Share (%), by Country 2024 & 2032
- Figure 18: South America Medical Sensor Industry Volume Share (%), by Country 2024 & 2032
- Figure 19: North America Medical Sensor Industry Revenue (Million), by Country 2024 & 2032
- Figure 20: North America Medical Sensor Industry Volume (K Unit), by Country 2024 & 2032
- Figure 21: North America Medical Sensor Industry Revenue Share (%), by Country 2024 & 2032
- Figure 22: North America Medical Sensor Industry Volume Share (%), by Country 2024 & 2032
- Figure 23: MEA Medical Sensor Industry Revenue (Million), by Country 2024 & 2032
- Figure 24: MEA Medical Sensor Industry Volume (K Unit), by Country 2024 & 2032
- Figure 25: MEA Medical Sensor Industry Revenue Share (%), by Country 2024 & 2032
- Figure 26: MEA Medical Sensor Industry Volume Share (%), by Country 2024 & 2032
- Figure 27: North America Medical Sensor Industry Revenue (Million), by Component 2024 & 2032
- Figure 28: North America Medical Sensor Industry Volume (K Unit), by Component 2024 & 2032
- Figure 29: North America Medical Sensor Industry Revenue Share (%), by Component 2024 & 2032
- Figure 30: North America Medical Sensor Industry Volume Share (%), by Component 2024 & 2032
- Figure 31: North America Medical Sensor Industry Revenue (Million), by Application 2024 & 2032
- Figure 32: North America Medical Sensor Industry Volume (K Unit), by Application 2024 & 2032
- Figure 33: North America Medical Sensor Industry Revenue Share (%), by Application 2024 & 2032
- Figure 34: North America Medical Sensor Industry Volume Share (%), by Application 2024 & 2032
- Figure 35: North America Medical Sensor Industry Revenue (Million), by Country 2024 & 2032
- Figure 36: North America Medical Sensor Industry Volume (K Unit), by Country 2024 & 2032
- Figure 37: North America Medical Sensor Industry Revenue Share (%), by Country 2024 & 2032
- Figure 38: North America Medical Sensor Industry Volume Share (%), by Country 2024 & 2032
- Figure 39: Europe Medical Sensor Industry Revenue (Million), by Component 2024 & 2032
- Figure 40: Europe Medical Sensor Industry Volume (K Unit), by Component 2024 & 2032
- Figure 41: Europe Medical Sensor Industry Revenue Share (%), by Component 2024 & 2032
- Figure 42: Europe Medical Sensor Industry Volume Share (%), by Component 2024 & 2032
- Figure 43: Europe Medical Sensor Industry Revenue (Million), by Application 2024 & 2032
- Figure 44: Europe Medical Sensor Industry Volume (K Unit), by Application 2024 & 2032
- Figure 45: Europe Medical Sensor Industry Revenue Share (%), by Application 2024 & 2032
- Figure 46: Europe Medical Sensor Industry Volume Share (%), by Application 2024 & 2032
- Figure 47: Europe Medical Sensor Industry Revenue (Million), by Country 2024 & 2032
- Figure 48: Europe Medical Sensor Industry Volume (K Unit), by Country 2024 & 2032
- Figure 49: Europe Medical Sensor Industry Revenue Share (%), by Country 2024 & 2032
- Figure 50: Europe Medical Sensor Industry Volume Share (%), by Country 2024 & 2032
- Figure 51: Asia Medical Sensor Industry Revenue (Million), by Component 2024 & 2032
- Figure 52: Asia Medical Sensor Industry Volume (K Unit), by Component 2024 & 2032
- Figure 53: Asia Medical Sensor Industry Revenue Share (%), by Component 2024 & 2032
- Figure 54: Asia Medical Sensor Industry Volume Share (%), by Component 2024 & 2032
- Figure 55: Asia Medical Sensor Industry Revenue (Million), by Application 2024 & 2032
- Figure 56: Asia Medical Sensor Industry Volume (K Unit), by Application 2024 & 2032
- Figure 57: Asia Medical Sensor Industry Revenue Share (%), by Application 2024 & 2032
- Figure 58: Asia Medical Sensor Industry Volume Share (%), by Application 2024 & 2032
- Figure 59: Asia Medical Sensor Industry Revenue (Million), by Country 2024 & 2032
- Figure 60: Asia Medical Sensor Industry Volume (K Unit), by Country 2024 & 2032
- Figure 61: Asia Medical Sensor Industry Revenue Share (%), by Country 2024 & 2032
- Figure 62: Asia Medical Sensor Industry Volume Share (%), by Country 2024 & 2032
- Figure 63: Australia and New Zealand Medical Sensor Industry Revenue (Million), by Component 2024 & 2032
- Figure 64: Australia and New Zealand Medical Sensor Industry Volume (K Unit), by Component 2024 & 2032
- Figure 65: Australia and New Zealand Medical Sensor Industry Revenue Share (%), by Component 2024 & 2032
- Figure 66: Australia and New Zealand Medical Sensor Industry Volume Share (%), by Component 2024 & 2032
- Figure 67: Australia and New Zealand Medical Sensor Industry Revenue (Million), by Application 2024 & 2032
- Figure 68: Australia and New Zealand Medical Sensor Industry Volume (K Unit), by Application 2024 & 2032
- Figure 69: Australia and New Zealand Medical Sensor Industry Revenue Share (%), by Application 2024 & 2032
- Figure 70: Australia and New Zealand Medical Sensor Industry Volume Share (%), by Application 2024 & 2032
- Figure 71: Australia and New Zealand Medical Sensor Industry Revenue (Million), by Country 2024 & 2032
- Figure 72: Australia and New Zealand Medical Sensor Industry Volume (K Unit), by Country 2024 & 2032
- Figure 73: Australia and New Zealand Medical Sensor Industry Revenue Share (%), by Country 2024 & 2032
- Figure 74: Australia and New Zealand Medical Sensor Industry Volume Share (%), by Country 2024 & 2032
- Figure 75: Latin America Medical Sensor Industry Revenue (Million), by Component 2024 & 2032
- Figure 76: Latin America Medical Sensor Industry Volume (K Unit), by Component 2024 & 2032
- Figure 77: Latin America Medical Sensor Industry Revenue Share (%), by Component 2024 & 2032
- Figure 78: Latin America Medical Sensor Industry Volume Share (%), by Component 2024 & 2032
- Figure 79: Latin America Medical Sensor Industry Revenue (Million), by Application 2024 & 2032
- Figure 80: Latin America Medical Sensor Industry Volume (K Unit), by Application 2024 & 2032
- Figure 81: Latin America Medical Sensor Industry Revenue Share (%), by Application 2024 & 2032
- Figure 82: Latin America Medical Sensor Industry Volume Share (%), by Application 2024 & 2032
- Figure 83: Latin America Medical Sensor Industry Revenue (Million), by Country 2024 & 2032
- Figure 84: Latin America Medical Sensor Industry Volume (K Unit), by Country 2024 & 2032
- Figure 85: Latin America Medical Sensor Industry Revenue Share (%), by Country 2024 & 2032
- Figure 86: Latin America Medical Sensor Industry Volume Share (%), by Country 2024 & 2032
- Figure 87: Middle East and Africa Medical Sensor Industry Revenue (Million), by Component 2024 & 2032
- Figure 88: Middle East and Africa Medical Sensor Industry Volume (K Unit), by Component 2024 & 2032
- Figure 89: Middle East and Africa Medical Sensor Industry Revenue Share (%), by Component 2024 & 2032
- Figure 90: Middle East and Africa Medical Sensor Industry Volume Share (%), by Component 2024 & 2032
- Figure 91: Middle East and Africa Medical Sensor Industry Revenue (Million), by Application 2024 & 2032
- Figure 92: Middle East and Africa Medical Sensor Industry Volume (K Unit), by Application 2024 & 2032
- Figure 93: Middle East and Africa Medical Sensor Industry Revenue Share (%), by Application 2024 & 2032
- Figure 94: Middle East and Africa Medical Sensor Industry Volume Share (%), by Application 2024 & 2032
- Figure 95: Middle East and Africa Medical Sensor Industry Revenue (Million), by Country 2024 & 2032
- Figure 96: Middle East and Africa Medical Sensor Industry Volume (K Unit), by Country 2024 & 2032
- Figure 97: Middle East and Africa Medical Sensor Industry Revenue Share (%), by Country 2024 & 2032
- Figure 98: Middle East and Africa Medical Sensor Industry Volume Share (%), by Country 2024 & 2032
List of Tables
- Table 1: Global Medical Sensor Industry Revenue Million Forecast, by Region 2019 & 2032
- Table 2: Global Medical Sensor Industry Volume K Unit Forecast, by Region 2019 & 2032
- Table 3: Global Medical Sensor Industry Revenue Million Forecast, by Component 2019 & 2032
- Table 4: Global Medical Sensor Industry Volume K Unit Forecast, by Component 2019 & 2032
- Table 5: Global Medical Sensor Industry Revenue Million Forecast, by Application 2019 & 2032
- Table 6: Global Medical Sensor Industry Volume K Unit Forecast, by Application 2019 & 2032
- Table 7: Global Medical Sensor Industry Revenue Million Forecast, by Region 2019 & 2032
- Table 8: Global Medical Sensor Industry Volume K Unit Forecast, by Region 2019 & 2032
- Table 9: Global Medical Sensor Industry Revenue Million Forecast, by Country 2019 & 2032
- Table 10: Global Medical Sensor Industry Volume K Unit Forecast, by Country 2019 & 2032
- Table 11: United States Medical Sensor Industry Revenue (Million) Forecast, by Application 2019 & 2032
- Table 12: United States Medical Sensor Industry Volume (K Unit) Forecast, by Application 2019 & 2032
- Table 13: Canada Medical Sensor Industry Revenue (Million) Forecast, by Application 2019 & 2032
- Table 14: Canada Medical Sensor Industry Volume (K Unit) Forecast, by Application 2019 & 2032
- Table 15: Mexico Medical Sensor Industry Revenue (Million) Forecast, by Application 2019 & 2032
- Table 16: Mexico Medical Sensor Industry Volume (K Unit) Forecast, by Application 2019 & 2032
- Table 17: Global Medical Sensor Industry Revenue Million Forecast, by Country 2019 & 2032
- Table 18: Global Medical Sensor Industry Volume K Unit Forecast, by Country 2019 & 2032
- Table 19: Germany Medical Sensor Industry Revenue (Million) Forecast, by Application 2019 & 2032
- Table 20: Germany Medical Sensor Industry Volume (K Unit) Forecast, by Application 2019 & 2032
- Table 21: United Kingdom Medical Sensor Industry Revenue (Million) Forecast, by Application 2019 & 2032
- Table 22: United Kingdom Medical Sensor Industry Volume (K Unit) Forecast, by Application 2019 & 2032
- Table 23: France Medical Sensor Industry Revenue (Million) Forecast, by Application 2019 & 2032
- Table 24: France Medical Sensor Industry Volume (K Unit) Forecast, by Application 2019 & 2032
- Table 25: Spain Medical Sensor Industry Revenue (Million) Forecast, by Application 2019 & 2032
- Table 26: Spain Medical Sensor Industry Volume (K Unit) Forecast, by Application 2019 & 2032
- Table 27: Italy Medical Sensor Industry Revenue (Million) Forecast, by Application 2019 & 2032
- Table 28: Italy Medical Sensor Industry Volume (K Unit) Forecast, by Application 2019 & 2032
- Table 29: Spain Medical Sensor Industry Revenue (Million) Forecast, by Application 2019 & 2032
- Table 30: Spain Medical Sensor Industry Volume (K Unit) Forecast, by Application 2019 & 2032
- Table 31: Belgium Medical Sensor Industry Revenue (Million) Forecast, by Application 2019 & 2032
- Table 32: Belgium Medical Sensor Industry Volume (K Unit) Forecast, by Application 2019 & 2032
- Table 33: Netherland Medical Sensor Industry Revenue (Million) Forecast, by Application 2019 & 2032
- Table 34: Netherland Medical Sensor Industry Volume (K Unit) Forecast, by Application 2019 & 2032
- Table 35: Nordics Medical Sensor Industry Revenue (Million) Forecast, by Application 2019 & 2032
- Table 36: Nordics Medical Sensor Industry Volume (K Unit) Forecast, by Application 2019 & 2032
- Table 37: Rest of Europe Medical Sensor Industry Revenue (Million) Forecast, by Application 2019 & 2032
- Table 38: Rest of Europe Medical Sensor Industry Volume (K Unit) Forecast, by Application 2019 & 2032
- Table 39: Global Medical Sensor Industry Revenue Million Forecast, by Country 2019 & 2032
- Table 40: Global Medical Sensor Industry Volume K Unit Forecast, by Country 2019 & 2032
- Table 41: China Medical Sensor Industry Revenue (Million) Forecast, by Application 2019 & 2032
- Table 42: China Medical Sensor Industry Volume (K Unit) Forecast, by Application 2019 & 2032
- Table 43: Japan Medical Sensor Industry Revenue (Million) Forecast, by Application 2019 & 2032
- Table 44: Japan Medical Sensor Industry Volume (K Unit) Forecast, by Application 2019 & 2032
- Table 45: India Medical Sensor Industry Revenue (Million) Forecast, by Application 2019 & 2032
- Table 46: India Medical Sensor Industry Volume (K Unit) Forecast, by Application 2019 & 2032
- Table 47: South Korea Medical Sensor Industry Revenue (Million) Forecast, by Application 2019 & 2032
- Table 48: South Korea Medical Sensor Industry Volume (K Unit) Forecast, by Application 2019 & 2032
- Table 49: Southeast Asia Medical Sensor Industry Revenue (Million) Forecast, by Application 2019 & 2032
- Table 50: Southeast Asia Medical Sensor Industry Volume (K Unit) Forecast, by Application 2019 & 2032
- Table 51: Australia Medical Sensor Industry Revenue (Million) Forecast, by Application 2019 & 2032
- Table 52: Australia Medical Sensor Industry Volume (K Unit) Forecast, by Application 2019 & 2032
- Table 53: Indonesia Medical Sensor Industry Revenue (Million) Forecast, by Application 2019 & 2032
- Table 54: Indonesia Medical Sensor Industry Volume (K Unit) Forecast, by Application 2019 & 2032
- Table 55: Phillipes Medical Sensor Industry Revenue (Million) Forecast, by Application 2019 & 2032
- Table 56: Phillipes Medical Sensor Industry Volume (K Unit) Forecast, by Application 2019 & 2032
- Table 57: Singapore Medical Sensor Industry Revenue (Million) Forecast, by Application 2019 & 2032
- Table 58: Singapore Medical Sensor Industry Volume (K Unit) Forecast, by Application 2019 & 2032
- Table 59: Thailandc Medical Sensor Industry Revenue (Million) Forecast, by Application 2019 & 2032
- Table 60: Thailandc Medical Sensor Industry Volume (K Unit) Forecast, by Application 2019 & 2032
- Table 61: Rest of Asia Pacific Medical Sensor Industry Revenue (Million) Forecast, by Application 2019 & 2032
- Table 62: Rest of Asia Pacific Medical Sensor Industry Volume (K Unit) Forecast, by Application 2019 & 2032
- Table 63: Global Medical Sensor Industry Revenue Million Forecast, by Country 2019 & 2032
- Table 64: Global Medical Sensor Industry Volume K Unit Forecast, by Country 2019 & 2032
- Table 65: Brazil Medical Sensor Industry Revenue (Million) Forecast, by Application 2019 & 2032
- Table 66: Brazil Medical Sensor Industry Volume (K Unit) Forecast, by Application 2019 & 2032
- Table 67: Argentina Medical Sensor Industry Revenue (Million) Forecast, by Application 2019 & 2032
- Table 68: Argentina Medical Sensor Industry Volume (K Unit) Forecast, by Application 2019 & 2032
- Table 69: Peru Medical Sensor Industry Revenue (Million) Forecast, by Application 2019 & 2032
- Table 70: Peru Medical Sensor Industry Volume (K Unit) Forecast, by Application 2019 & 2032
- Table 71: Chile Medical Sensor Industry Revenue (Million) Forecast, by Application 2019 & 2032
- Table 72: Chile Medical Sensor Industry Volume (K Unit) Forecast, by Application 2019 & 2032
- Table 73: Colombia Medical Sensor Industry Revenue (Million) Forecast, by Application 2019 & 2032
- Table 74: Colombia Medical Sensor Industry Volume (K Unit) Forecast, by Application 2019 & 2032
- Table 75: Ecuador Medical Sensor Industry Revenue (Million) Forecast, by Application 2019 & 2032
- Table 76: Ecuador Medical Sensor Industry Volume (K Unit) Forecast, by Application 2019 & 2032
- Table 77: Venezuela Medical Sensor Industry Revenue (Million) Forecast, by Application 2019 & 2032
- Table 78: Venezuela Medical Sensor Industry Volume (K Unit) Forecast, by Application 2019 & 2032
- Table 79: Rest of South America Medical Sensor Industry Revenue (Million) Forecast, by Application 2019 & 2032
- Table 80: Rest of South America Medical Sensor Industry Volume (K Unit) Forecast, by Application 2019 & 2032
- Table 81: Global Medical Sensor Industry Revenue Million Forecast, by Country 2019 & 2032
- Table 82: Global Medical Sensor Industry Volume K Unit Forecast, by Country 2019 & 2032
- Table 83: United States Medical Sensor Industry Revenue (Million) Forecast, by Application 2019 & 2032
- Table 84: United States Medical Sensor Industry Volume (K Unit) Forecast, by Application 2019 & 2032
- Table 85: Canada Medical Sensor Industry Revenue (Million) Forecast, by Application 2019 & 2032
- Table 86: Canada Medical Sensor Industry Volume (K Unit) Forecast, by Application 2019 & 2032
- Table 87: Mexico Medical Sensor Industry Revenue (Million) Forecast, by Application 2019 & 2032
- Table 88: Mexico Medical Sensor Industry Volume (K Unit) Forecast, by Application 2019 & 2032
- Table 89: Global Medical Sensor Industry Revenue Million Forecast, by Country 2019 & 2032
- Table 90: Global Medical Sensor Industry Volume K Unit Forecast, by Country 2019 & 2032
- Table 91: United Arab Emirates Medical Sensor Industry Revenue (Million) Forecast, by Application 2019 & 2032
- Table 92: United Arab Emirates Medical Sensor Industry Volume (K Unit) Forecast, by Application 2019 & 2032
- Table 93: Saudi Arabia Medical Sensor Industry Revenue (Million) Forecast, by Application 2019 & 2032
- Table 94: Saudi Arabia Medical Sensor Industry Volume (K Unit) Forecast, by Application 2019 & 2032
- Table 95: South Africa Medical Sensor Industry Revenue (Million) Forecast, by Application 2019 & 2032
- Table 96: South Africa Medical Sensor Industry Volume (K Unit) Forecast, by Application 2019 & 2032
- Table 97: Rest of Middle East and Africa Medical Sensor Industry Revenue (Million) Forecast, by Application 2019 & 2032
- Table 98: Rest of Middle East and Africa Medical Sensor Industry Volume (K Unit) Forecast, by Application 2019 & 2032
- Table 99: Global Medical Sensor Industry Revenue Million Forecast, by Component 2019 & 2032
- Table 100: Global Medical Sensor Industry Volume K Unit Forecast, by Component 2019 & 2032
- Table 101: Global Medical Sensor Industry Revenue Million Forecast, by Application 2019 & 2032
- Table 102: Global Medical Sensor Industry Volume K Unit Forecast, by Application 2019 & 2032
- Table 103: Global Medical Sensor Industry Revenue Million Forecast, by Country 2019 & 2032
- Table 104: Global Medical Sensor Industry Volume K Unit Forecast, by Country 2019 & 2032
- Table 105: Global Medical Sensor Industry Revenue Million Forecast, by Component 2019 & 2032
- Table 106: Global Medical Sensor Industry Volume K Unit Forecast, by Component 2019 & 2032
- Table 107: Global Medical Sensor Industry Revenue Million Forecast, by Application 2019 & 2032
- Table 108: Global Medical Sensor Industry Volume K Unit Forecast, by Application 2019 & 2032
- Table 109: Global Medical Sensor Industry Revenue Million Forecast, by Country 2019 & 2032
- Table 110: Global Medical Sensor Industry Volume K Unit Forecast, by Country 2019 & 2032
- Table 111: Global Medical Sensor Industry Revenue Million Forecast, by Component 2019 & 2032
- Table 112: Global Medical Sensor Industry Volume K Unit Forecast, by Component 2019 & 2032
- Table 113: Global Medical Sensor Industry Revenue Million Forecast, by Application 2019 & 2032
- Table 114: Global Medical Sensor Industry Volume K Unit Forecast, by Application 2019 & 2032
- Table 115: Global Medical Sensor Industry Revenue Million Forecast, by Country 2019 & 2032
- Table 116: Global Medical Sensor Industry Volume K Unit Forecast, by Country 2019 & 2032
- Table 117: Global Medical Sensor Industry Revenue Million Forecast, by Component 2019 & 2032
- Table 118: Global Medical Sensor Industry Volume K Unit Forecast, by Component 2019 & 2032
- Table 119: Global Medical Sensor Industry Revenue Million Forecast, by Application 2019 & 2032
- Table 120: Global Medical Sensor Industry Volume K Unit Forecast, by Application 2019 & 2032
- Table 121: Global Medical Sensor Industry Revenue Million Forecast, by Country 2019 & 2032
- Table 122: Global Medical Sensor Industry Volume K Unit Forecast, by Country 2019 & 2032
- Table 123: Global Medical Sensor Industry Revenue Million Forecast, by Component 2019 & 2032
- Table 124: Global Medical Sensor Industry Volume K Unit Forecast, by Component 2019 & 2032
- Table 125: Global Medical Sensor Industry Revenue Million Forecast, by Application 2019 & 2032
- Table 126: Global Medical Sensor Industry Volume K Unit Forecast, by Application 2019 & 2032
- Table 127: Global Medical Sensor Industry Revenue Million Forecast, by Country 2019 & 2032
- Table 128: Global Medical Sensor Industry Volume K Unit Forecast, by Country 2019 & 2032
- Table 129: Global Medical Sensor Industry Revenue Million Forecast, by Component 2019 & 2032
- Table 130: Global Medical Sensor Industry Volume K Unit Forecast, by Component 2019 & 2032
- Table 131: Global Medical Sensor Industry Revenue Million Forecast, by Application 2019 & 2032
- Table 132: Global Medical Sensor Industry Volume K Unit Forecast, by Application 2019 & 2032
- Table 133: Global Medical Sensor Industry Revenue Million Forecast, by Country 2019 & 2032
- Table 134: Global Medical Sensor Industry Volume K Unit Forecast, by Country 2019 & 2032
Frequently Asked Questions
1. What is the projected Compound Annual Growth Rate (CAGR) of the Medical Sensor Industry?
The projected CAGR is approximately 10.24%.
2. Which companies are prominent players in the Medical Sensor Industry?
Key companies in the market include Servoflo Corporation, Honeywell International Inc, TE Connectivity Ltd (First Sensors AG), Sensirion Holding AG, Amphenol Advanced Sensors (Amphenol Corporation), Siemens AG, Omron Corporation, STMicroelectronics NV, NXP Semiconductors (Freescale Semiconductor), GE Healthcare Inc.
3. What are the main segments of the Medical Sensor Industry?
The market segments include Component, Application.
4. Can you provide details about the market size?
The market size is estimated to be USD 7.76 Million as of 2022.
5. What are some drivers contributing to market growth?
Miniaturization of Sensors Leading to Ease in Integration; Increasing Advancement in Medical Devices and Accessories.
6. What are the notable trends driving market growth?
Pressure Sensors Play a Significant Role in the Medical Sensor Market.
7. Are there any restraints impacting market growth?
Lack of Proper IoT Technology Skills across Healthcare Organizations; High Deployment Cost of Necessary Infrastructure and Connected Medical Devices.
8. Can you provide examples of recent developments in the market?
August 2022 - Sibel Health announced raising USD 33 million in its Series B financing round. The funding aims to scale wearable sensors for remote monitoring in the hospital.
9. What pricing options are available for accessing the report?
Pricing options include single-user, multi-user, and enterprise licenses priced at USD 4750, USD 5250, and USD 8750 respectively.
10. Is the market size provided in terms of value or volume?
The market size is provided in terms of value, measured in Million and volume, measured in K Unit.
11. Are there any specific market keywords associated with the report?
Yes, the market keyword associated with the report is "Medical Sensor Industry," which aids in identifying and referencing the specific market segment covered.
12. How do I determine which pricing option suits my needs best?
The pricing options vary based on user requirements and access needs. Individual users may opt for single-user licenses, while businesses requiring broader access may choose multi-user or enterprise licenses for cost-effective access to the report.
13. Are there any additional resources or data provided in the Medical Sensor Industry report?
While the report offers comprehensive insights, it's advisable to review the specific contents or supplementary materials provided to ascertain if additional resources or data are available.
14. How can I stay updated on further developments or reports in the Medical Sensor Industry?
To stay informed about further developments, trends, and reports in the Medical Sensor Industry, consider subscribing to industry newsletters, following relevant companies and organizations, or regularly checking reputable industry news sources and publications.
Methodology
Step 1 - Identification of Relevant Samples Size from Population Database


Step 2 - Approaches for Defining Global Market Size (Value, Volume* & Price*)

Note*: In applicable scenarios
Step 3 - Data Sources
Primary Research
- Web Analytics
- Survey Reports
- Research Institute
- Latest Research Reports
- Opinion Leaders
Secondary Research
- Annual Reports
- White Paper
- Latest Press Release
- Industry Association
- Paid Database
- Investor Presentations

Step 4 - Data Triangulation
Involves using different sources of information in order to increase the validity of a study
These sources are likely to be stakeholders in a program - participants, other researchers, program staff, other community members, and so on.
Then we put all data in single framework & apply various statistical tools to find out the dynamic on the market.
During the analysis stage, feedback from the stakeholder groups would be compared to determine areas of agreement as well as areas of divergence


