
Key Insights
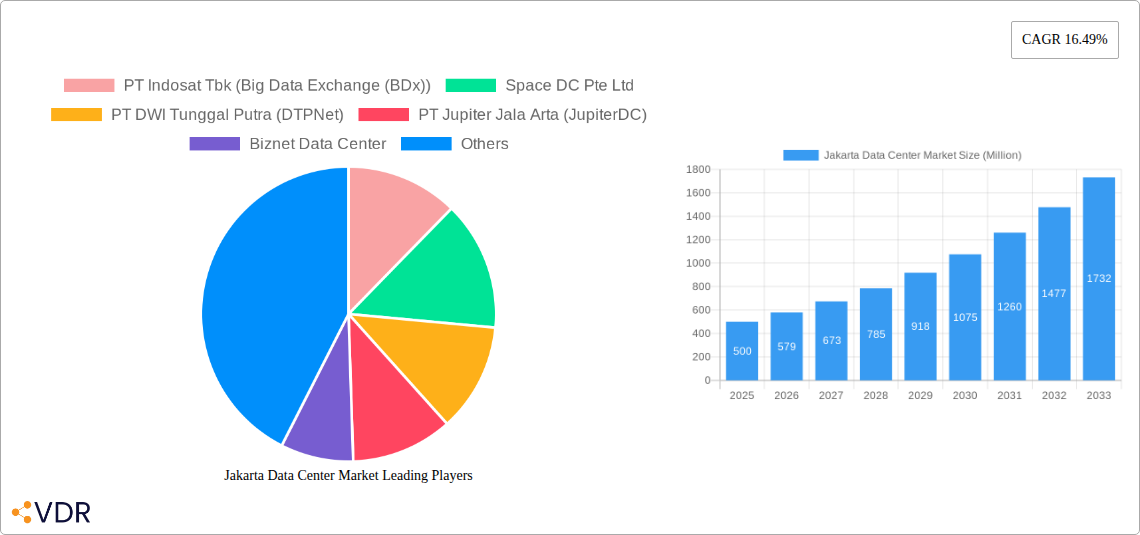
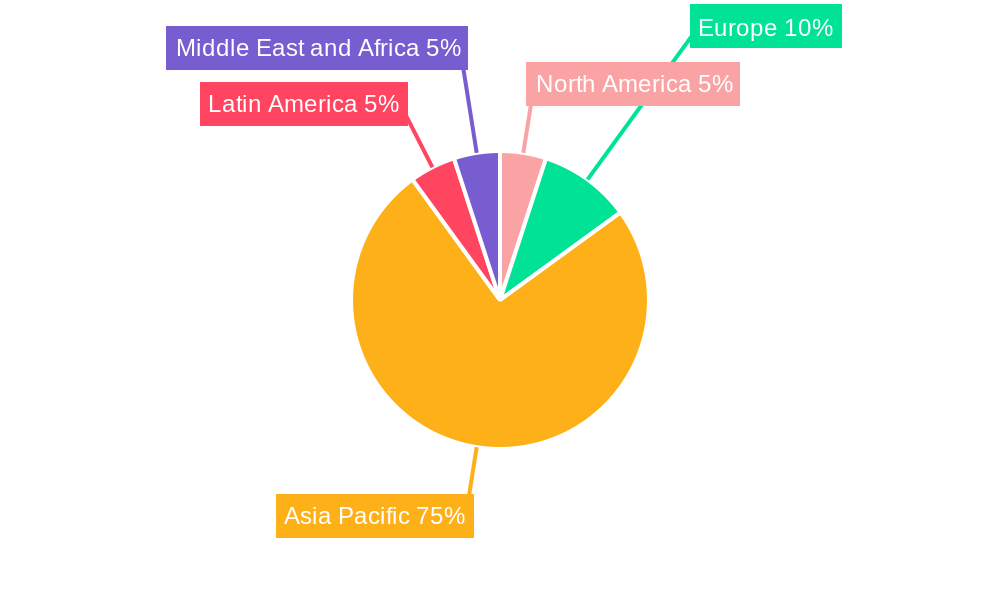
The Jakarta data center market is experiencing robust growth, fueled by Indonesia's burgeoning digital economy and increasing demand for cloud services, colocation, and digital infrastructure. A 16.49% Compound Annual Growth Rate (CAGR) indicates significant expansion, projecting substantial market value increases over the forecast period (2025-2033). Key drivers include the rising adoption of cloud computing across various sectors (BFSI, e-commerce, government), the expansion of 5G networks enhancing connectivity, and increasing investments in digital infrastructure by both domestic and international players. The market segmentation reveals a diverse landscape, with significant demand across various DC sizes (from small to mega), tiered service levels, and colocation types (retail, wholesale, hyperscale). While specific regional data is unavailable, the Asia-Pacific region, particularly Indonesia, is a significant contributor to global data center growth, indicating strong potential for Jakarta. The presence of major players like PT Indosat Tbk (BDx), Space DC, and DCI Indonesia Tbk signifies a competitive yet rapidly evolving market. However, challenges like potential power infrastructure limitations and the need for robust regulatory frameworks need to be addressed to ensure sustained and scalable growth.
The Jakarta data center market's growth trajectory is projected to be driven by sustained investments in digital transformation across industries. The increasing penetration of internet and mobile devices, coupled with the government's initiatives to promote digitalization, further bolsters market expansion. Specific segments like hyperscale colocation and large-scale data centers are expected to witness the most significant growth, reflecting the demand for advanced digital infrastructure from major cloud providers and large enterprises. Competition among existing players and potential new entrants will intensify, further driving innovation and improvements in service offerings. The ongoing expansion of interconnected data centers within Jakarta will also enhance network resilience and connectivity. While specific revenue figures for individual segments are not provided, it is reasonable to project that the higher-tier services (Tier 1, hyperscale colocation, large-scale data centers) will command a higher price point and contribute significantly to the overall market revenue. Therefore, sustained focus on these segments by existing and new market entrants is expected.
Jakarta Data Center Market: A Comprehensive Report (2019-2033)
This in-depth report provides a comprehensive analysis of the Jakarta data center market, covering market dynamics, growth trends, key players, and future outlook. The study period spans from 2019 to 2033, with 2025 serving as both the base and estimated year. The report offers invaluable insights for industry professionals, investors, and strategic decision-makers seeking to navigate this rapidly evolving landscape. We analyze the parent market (Indonesia Data Center Market) and the child market (Jakarta Data Center Market) to provide a holistic view.
Jakarta Data Center Market Dynamics & Structure
The Jakarta data center market is characterized by a dynamic interplay of technological advancements, regulatory changes, and intense competition. Market concentration is currently moderate, with several key players vying for market share. Technological innovation, driven by the need for higher capacity, improved efficiency, and enhanced security, is a major driver. The Indonesian government's supportive policies towards digital infrastructure development also contribute significantly. However, regulatory hurdles and the availability of skilled labor pose challenges. The increasing adoption of cloud computing and the rise of hyperscale data centers are reshaping the competitive landscape. Significant M&A activity is expected to further consolidate the market. The total market size in 2025 is estimated at xx Million.
- Market Concentration: Moderate, with top 5 players holding xx% market share (2025).
- Technological Innovation: Focus on greenfield data centers, higher power capacity, and improved PUE.
- Regulatory Framework: Supportive government policies, but bureaucratic processes can be slow.
- Competitive Product Substitutes: Cloud services, edge computing.
- End-User Demographics: Dominated by Cloud & IT, Telecom, and BFSI sectors.
- M&A Trends: Increasing consolidation through acquisitions and partnerships.
Jakarta Data Center Market Growth Trends & Insights
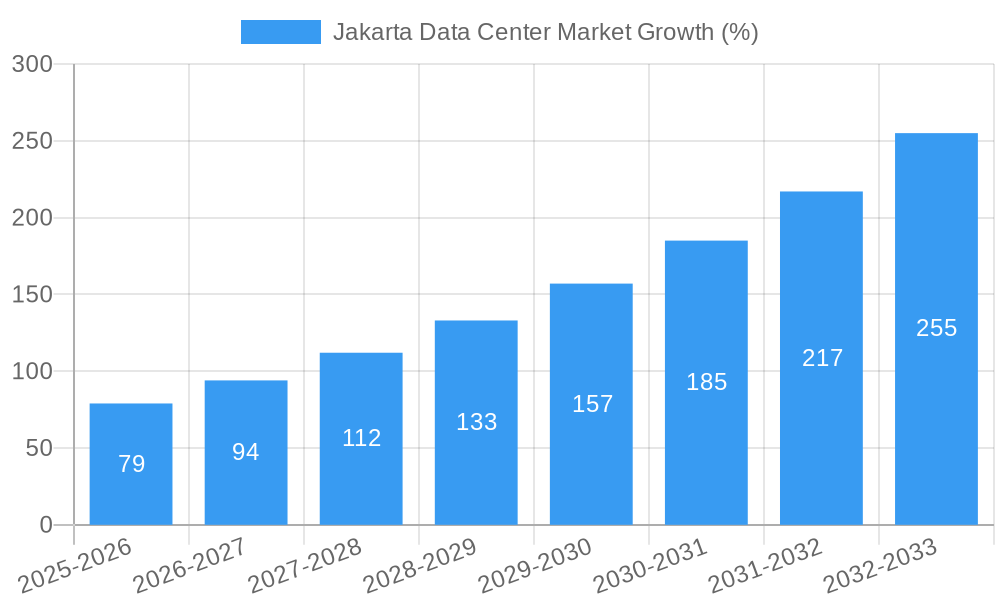
The Jakarta data center market exhibits robust growth, driven by increasing digitalization across various sectors. The market size has grown significantly from xx Million in 2019 to an estimated xx Million in 2025, exhibiting a CAGR of xx% during the historical period (2019-2024). This growth is projected to continue into the forecast period (2025-2033), with a forecasted CAGR of xx%. Key factors driving this expansion include the rising adoption of cloud services, the growing demand for colocation services, and the government's push for digital transformation. Technological disruptions, such as the increasing adoption of AI and IoT, are also fueling market growth.
Dominant Regions, Countries, or Segments in Jakarta Data Center Market
South Jakarta is the dominant region, driven by its established IT infrastructure and proximity to major businesses. The Large and Mega data center segments are experiencing the fastest growth, catering to the needs of hyperscalers and large enterprises. The Utilized absorption segment dominates the market, reflecting the high demand for data center capacity. Retail colocation is currently the most prevalent type, but wholesale and hyperscale deployments are expected to gain traction. The Cloud & IT sector is the largest end-user segment, closely followed by Telecom and BFSI.
- Key Drivers: Strong economic growth, supportive government policies, expanding digital infrastructure.
- Dominance Factors: Existing infrastructure, skilled workforce, proximity to key businesses.
- Growth Potential: High, driven by continued digitalization and government initiatives.
Jakarta Data Center Market Product Landscape
The Jakarta data center market features a diverse range of products, from small colocation facilities to massive hyperscale data centers. Innovations focus on improving energy efficiency (PUE), enhancing security, and increasing scalability. Key features include advanced cooling systems, high-density racks, and redundant power and network infrastructure. Data centers are increasingly adopting sustainable practices, such as using renewable energy sources. The market is witnessing a shift towards modular and prefabricated data center designs for faster deployment and reduced costs.
Key Drivers, Barriers & Challenges in Jakarta Data Center Market
Key Drivers:
- Increasing digitalization across industries.
- Growing adoption of cloud computing and IoT.
- Government initiatives promoting digital infrastructure development.
Challenges & Restraints:
- High land costs and limited space in prime locations.
- Infrastructure limitations, including power supply and network connectivity.
- Competition from regional data center markets. This leads to a potential loss of xx Million in revenue annually if not mitigated.
Emerging Opportunities in Jakarta Data Center Market
- Edge Computing: Growing demand for low-latency data processing near end-users.
- Hyperscale Data Centers: Increasing deployments by global cloud providers.
- Green Data Centers: Growing focus on sustainability and energy efficiency.
- Specialized Data Centers: Growing niche demand for specific industry needs.
Growth Accelerators in the Jakarta Data Center Market Industry
The long-term growth of the Jakarta data center market is driven by several factors. Technological advancements in energy-efficient designs and sustainable practices will play a vital role. Strategic partnerships between local and international players will enhance market penetration. Government initiatives to improve infrastructure and regulatory frameworks will create a favorable environment for investment and expansion.
Key Players Shaping the Jakarta Data Center Market
- PT Indosat Tbk (Big Data Exchange (BDx))
- Space DC Pte Ltd
- PT DWI Tunggal Putra (DTPNet)
- PT Jupiter Jala Arta (JupiterDC)
- Biznet Data Center
- PT Sigma Cipta Caraka (Telkomsigma)
- Digital Edge DC
- EdgeConneX Inc (GTN Data Centers)
- PT DCI Indonesia Tbk
- NEX Data Center Indonesia
- PT XL Axiata Tbk (Princeton Digital Group)
- NTT Ltd
- Nusantara Data Center
Notable Milestones in Jakarta Data Center Market Sector
- Apr 2023: BDxIndonesia commences construction of its 15 MW CGK3A data center in South Jakarta, featuring Tier 3 facilities and a PUE of 1.4.
- Dec 2022: ST Telemedia completes the structure of STT Jakarta 1, a 19.5 MW facility, part of a larger 72 MW campus.
In-Depth Jakarta Data Center Market Outlook
The future of the Jakarta data center market is bright, with significant growth potential driven by technological advancements, government support, and increasing demand from various sectors. Strategic investments in infrastructure and skilled workforce development will further enhance the market's competitiveness. The focus on sustainability and green initiatives will attract environmentally conscious businesses and investors. This market is poised for substantial expansion in the coming years, offering attractive opportunities for both established players and new entrants.
Jakarta Data Center Market Segmentation
-
1. DC Size
- 1.1. Small
- 1.2. Medium
- 1.3. Large
- 1.4. Massive
- 1.5. Mega
-
2. Tier Type
- 2.1. Tier 1 & 2
- 2.2. Tier 3
- 2.3. Tier 4
-
3. Absorption
-
3.1. Utilized
-
3.1.1. Colocation Type
- 3.1.1.1. Retail
- 3.1.1.2. Wholesale
- 3.1.1.3. Hyperscale
-
3.1.2. End User
- 3.1.2.1. Cloud & IT
- 3.1.2.2. Telecom
- 3.1.2.3. Media & Entertainment
- 3.1.2.4. Government
- 3.1.2.5. BFSI
- 3.1.2.6. Manufacturing
- 3.1.2.7. E-Commerce
- 3.1.2.8. Other End User
-
3.1.1. Colocation Type
- 3.2. Non-Utilized
-
3.1. Utilized
Jakarta Data Center Market Segmentation By Geography
-
1. North America
- 1.1. United States
- 1.2. Canada
- 1.3. Mexico
-
2. South America
- 2.1. Brazil
- 2.2. Argentina
- 2.3. Rest of South America
-
3. Europe
- 3.1. United Kingdom
- 3.2. Germany
- 3.3. France
- 3.4. Italy
- 3.5. Spain
- 3.6. Russia
- 3.7. Benelux
- 3.8. Nordics
- 3.9. Rest of Europe
-
4. Middle East & Africa
- 4.1. Turkey
- 4.2. Israel
- 4.3. GCC
- 4.4. North Africa
- 4.5. South Africa
- 4.6. Rest of Middle East & Africa
-
5. Asia Pacific
- 5.1. China
- 5.2. India
- 5.3. Japan
- 5.4. South Korea
- 5.5. ASEAN
- 5.6. Oceania
- 5.7. Rest of Asia Pacific
Jakarta Data Center Market REPORT HIGHLIGHTS
| Aspects | Details |
|---|---|
| Study Period | 2019-2033 |
| Base Year | 2024 |
| Estimated Year | 2025 |
| Forecast Period | 2025-2033 |
| Historical Period | 2019-2024 |
| Growth Rate | CAGR of 16.49% from 2019-2033 |
| Segmentation |
|
Table of Contents
- 1. Introduction
- 1.1. Research Scope
- 1.2. Market Segmentation
- 1.3. Research Methodology
- 1.4. Definitions and Assumptions
- 2. Executive Summary
- 2.1. Introduction
- 3. Market Dynamics
- 3.1. Introduction
- 3.2. Market Drivers
- 3.2.1. Regulations Promoting Proper Lighting for Worker Safety in Hazardous Locations; Rising Demand for Cost-effective and Energy-efficient LED Lighting Solutions
- 3.3. Market Restrains
- 3.3.1. High Costs of Equipment
- 3.4. Market Trends
- 3.4.1. Tier 4 is Expected to Hold Significant Share of the Market
- 4. Market Factor Analysis
- 4.1. Porters Five Forces
- 4.2. Supply/Value Chain
- 4.3. PESTEL analysis
- 4.4. Market Entropy
- 4.5. Patent/Trademark Analysis
- 5. Global Jakarta Data Center Market Analysis, Insights and Forecast, 2019-2031
- 5.1. Market Analysis, Insights and Forecast - by DC Size
- 5.1.1. Small
- 5.1.2. Medium
- 5.1.3. Large
- 5.1.4. Massive
- 5.1.5. Mega
- 5.2. Market Analysis, Insights and Forecast - by Tier Type
- 5.2.1. Tier 1 & 2
- 5.2.2. Tier 3
- 5.2.3. Tier 4
- 5.3. Market Analysis, Insights and Forecast - by Absorption
- 5.3.1. Utilized
- 5.3.1.1. Colocation Type
- 5.3.1.1.1. Retail
- 5.3.1.1.2. Wholesale
- 5.3.1.1.3. Hyperscale
- 5.3.1.2. End User
- 5.3.1.2.1. Cloud & IT
- 5.3.1.2.2. Telecom
- 5.3.1.2.3. Media & Entertainment
- 5.3.1.2.4. Government
- 5.3.1.2.5. BFSI
- 5.3.1.2.6. Manufacturing
- 5.3.1.2.7. E-Commerce
- 5.3.1.2.8. Other End User
- 5.3.1.1. Colocation Type
- 5.3.2. Non-Utilized
- 5.3.1. Utilized
- 5.4. Market Analysis, Insights and Forecast - by Region
- 5.4.1. North America
- 5.4.2. South America
- 5.4.3. Europe
- 5.4.4. Middle East & Africa
- 5.4.5. Asia Pacific
- 5.1. Market Analysis, Insights and Forecast - by DC Size
- 6. North America Jakarta Data Center Market Analysis, Insights and Forecast, 2019-2031
- 6.1. Market Analysis, Insights and Forecast - by DC Size
- 6.1.1. Small
- 6.1.2. Medium
- 6.1.3. Large
- 6.1.4. Massive
- 6.1.5. Mega
- 6.2. Market Analysis, Insights and Forecast - by Tier Type
- 6.2.1. Tier 1 & 2
- 6.2.2. Tier 3
- 6.2.3. Tier 4
- 6.3. Market Analysis, Insights and Forecast - by Absorption
- 6.3.1. Utilized
- 6.3.1.1. Colocation Type
- 6.3.1.1.1. Retail
- 6.3.1.1.2. Wholesale
- 6.3.1.1.3. Hyperscale
- 6.3.1.2. End User
- 6.3.1.2.1. Cloud & IT
- 6.3.1.2.2. Telecom
- 6.3.1.2.3. Media & Entertainment
- 6.3.1.2.4. Government
- 6.3.1.2.5. BFSI
- 6.3.1.2.6. Manufacturing
- 6.3.1.2.7. E-Commerce
- 6.3.1.2.8. Other End User
- 6.3.1.1. Colocation Type
- 6.3.2. Non-Utilized
- 6.3.1. Utilized
- 6.1. Market Analysis, Insights and Forecast - by DC Size
- 7. South America Jakarta Data Center Market Analysis, Insights and Forecast, 2019-2031
- 7.1. Market Analysis, Insights and Forecast - by DC Size
- 7.1.1. Small
- 7.1.2. Medium
- 7.1.3. Large
- 7.1.4. Massive
- 7.1.5. Mega
- 7.2. Market Analysis, Insights and Forecast - by Tier Type
- 7.2.1. Tier 1 & 2
- 7.2.2. Tier 3
- 7.2.3. Tier 4
- 7.3. Market Analysis, Insights and Forecast - by Absorption
- 7.3.1. Utilized
- 7.3.1.1. Colocation Type
- 7.3.1.1.1. Retail
- 7.3.1.1.2. Wholesale
- 7.3.1.1.3. Hyperscale
- 7.3.1.2. End User
- 7.3.1.2.1. Cloud & IT
- 7.3.1.2.2. Telecom
- 7.3.1.2.3. Media & Entertainment
- 7.3.1.2.4. Government
- 7.3.1.2.5. BFSI
- 7.3.1.2.6. Manufacturing
- 7.3.1.2.7. E-Commerce
- 7.3.1.2.8. Other End User
- 7.3.1.1. Colocation Type
- 7.3.2. Non-Utilized
- 7.3.1. Utilized
- 7.1. Market Analysis, Insights and Forecast - by DC Size
- 8. Europe Jakarta Data Center Market Analysis, Insights and Forecast, 2019-2031
- 8.1. Market Analysis, Insights and Forecast - by DC Size
- 8.1.1. Small
- 8.1.2. Medium
- 8.1.3. Large
- 8.1.4. Massive
- 8.1.5. Mega
- 8.2. Market Analysis, Insights and Forecast - by Tier Type
- 8.2.1. Tier 1 & 2
- 8.2.2. Tier 3
- 8.2.3. Tier 4
- 8.3. Market Analysis, Insights and Forecast - by Absorption
- 8.3.1. Utilized
- 8.3.1.1. Colocation Type
- 8.3.1.1.1. Retail
- 8.3.1.1.2. Wholesale
- 8.3.1.1.3. Hyperscale
- 8.3.1.2. End User
- 8.3.1.2.1. Cloud & IT
- 8.3.1.2.2. Telecom
- 8.3.1.2.3. Media & Entertainment
- 8.3.1.2.4. Government
- 8.3.1.2.5. BFSI
- 8.3.1.2.6. Manufacturing
- 8.3.1.2.7. E-Commerce
- 8.3.1.2.8. Other End User
- 8.3.1.1. Colocation Type
- 8.3.2. Non-Utilized
- 8.3.1. Utilized
- 8.1. Market Analysis, Insights and Forecast - by DC Size
- 9. Middle East & Africa Jakarta Data Center Market Analysis, Insights and Forecast, 2019-2031
- 9.1. Market Analysis, Insights and Forecast - by DC Size
- 9.1.1. Small
- 9.1.2. Medium
- 9.1.3. Large
- 9.1.4. Massive
- 9.1.5. Mega
- 9.2. Market Analysis, Insights and Forecast - by Tier Type
- 9.2.1. Tier 1 & 2
- 9.2.2. Tier 3
- 9.2.3. Tier 4
- 9.3. Market Analysis, Insights and Forecast - by Absorption
- 9.3.1. Utilized
- 9.3.1.1. Colocation Type
- 9.3.1.1.1. Retail
- 9.3.1.1.2. Wholesale
- 9.3.1.1.3. Hyperscale
- 9.3.1.2. End User
- 9.3.1.2.1. Cloud & IT
- 9.3.1.2.2. Telecom
- 9.3.1.2.3. Media & Entertainment
- 9.3.1.2.4. Government
- 9.3.1.2.5. BFSI
- 9.3.1.2.6. Manufacturing
- 9.3.1.2.7. E-Commerce
- 9.3.1.2.8. Other End User
- 9.3.1.1. Colocation Type
- 9.3.2. Non-Utilized
- 9.3.1. Utilized
- 9.1. Market Analysis, Insights and Forecast - by DC Size
- 10. Asia Pacific Jakarta Data Center Market Analysis, Insights and Forecast, 2019-2031
- 10.1. Market Analysis, Insights and Forecast - by DC Size
- 10.1.1. Small
- 10.1.2. Medium
- 10.1.3. Large
- 10.1.4. Massive
- 10.1.5. Mega
- 10.2. Market Analysis, Insights and Forecast - by Tier Type
- 10.2.1. Tier 1 & 2
- 10.2.2. Tier 3
- 10.2.3. Tier 4
- 10.3. Market Analysis, Insights and Forecast - by Absorption
- 10.3.1. Utilized
- 10.3.1.1. Colocation Type
- 10.3.1.1.1. Retail
- 10.3.1.1.2. Wholesale
- 10.3.1.1.3. Hyperscale
- 10.3.1.2. End User
- 10.3.1.2.1. Cloud & IT
- 10.3.1.2.2. Telecom
- 10.3.1.2.3. Media & Entertainment
- 10.3.1.2.4. Government
- 10.3.1.2.5. BFSI
- 10.3.1.2.6. Manufacturing
- 10.3.1.2.7. E-Commerce
- 10.3.1.2.8. Other End User
- 10.3.1.1. Colocation Type
- 10.3.2. Non-Utilized
- 10.3.1. Utilized
- 10.1. Market Analysis, Insights and Forecast - by DC Size
- 11. North America Jakarta Data Center Market Analysis, Insights and Forecast, 2019-2031
- 11.1. Market Analysis, Insights and Forecast - By Country/Sub-region
- 11.1.1.
- 12. Europe Jakarta Data Center Market Analysis, Insights and Forecast, 2019-2031
- 12.1. Market Analysis, Insights and Forecast - By Country/Sub-region
- 12.1.1.
- 13. Asia Pacific Jakarta Data Center Market Analysis, Insights and Forecast, 2019-2031
- 13.1. Market Analysis, Insights and Forecast - By Country/Sub-region
- 13.1.1.
- 14. Latin America Jakarta Data Center Market Analysis, Insights and Forecast, 2019-2031
- 14.1. Market Analysis, Insights and Forecast - By Country/Sub-region
- 14.1.1.
- 15. Middle East and Africa Jakarta Data Center Market Analysis, Insights and Forecast, 2019-2031
- 15.1. Market Analysis, Insights and Forecast - By Country/Sub-region
- 15.1.1.
- 16. Competitive Analysis
- 16.1. Global Market Share Analysis 2024
- 16.2. Company Profiles
- 16.2.1 PT Indosat Tbk (Big Data Exchange (BDx))
- 16.2.1.1. Overview
- 16.2.1.2. Products
- 16.2.1.3. SWOT Analysis
- 16.2.1.4. Recent Developments
- 16.2.1.5. Financials (Based on Availability)
- 16.2.2 Space DC Pte Ltd
- 16.2.2.1. Overview
- 16.2.2.2. Products
- 16.2.2.3. SWOT Analysis
- 16.2.2.4. Recent Developments
- 16.2.2.5. Financials (Based on Availability)
- 16.2.3 PT DWI Tunggal Putra (DTPNet)
- 16.2.3.1. Overview
- 16.2.3.2. Products
- 16.2.3.3. SWOT Analysis
- 16.2.3.4. Recent Developments
- 16.2.3.5. Financials (Based on Availability)
- 16.2.4 PT Jupiter Jala Arta (JupiterDC)
- 16.2.4.1. Overview
- 16.2.4.2. Products
- 16.2.4.3. SWOT Analysis
- 16.2.4.4. Recent Developments
- 16.2.4.5. Financials (Based on Availability)
- 16.2.5 Biznet Data Center
- 16.2.5.1. Overview
- 16.2.5.2. Products
- 16.2.5.3. SWOT Analysis
- 16.2.5.4. Recent Developments
- 16.2.5.5. Financials (Based on Availability)
- 16.2.6 PT Sigma Cipta Caraka (Telkomsigma)
- 16.2.6.1. Overview
- 16.2.6.2. Products
- 16.2.6.3. SWOT Analysis
- 16.2.6.4. Recent Developments
- 16.2.6.5. Financials (Based on Availability)
- 16.2.7 Digital Edge DC
- 16.2.7.1. Overview
- 16.2.7.2. Products
- 16.2.7.3. SWOT Analysis
- 16.2.7.4. Recent Developments
- 16.2.7.5. Financials (Based on Availability)
- 16.2.8 EdgeConneX Inc (GTN Data Centers)
- 16.2.8.1. Overview
- 16.2.8.2. Products
- 16.2.8.3. SWOT Analysis
- 16.2.8.4. Recent Developments
- 16.2.8.5. Financials (Based on Availability)
- 16.2.9 PT DCI Indonesia Tbk
- 16.2.9.1. Overview
- 16.2.9.2. Products
- 16.2.9.3. SWOT Analysis
- 16.2.9.4. Recent Developments
- 16.2.9.5. Financials (Based on Availability)
- 16.2.10 NEX Data Center Indonesia
- 16.2.10.1. Overview
- 16.2.10.2. Products
- 16.2.10.3. SWOT Analysis
- 16.2.10.4. Recent Developments
- 16.2.10.5. Financials (Based on Availability)
- 16.2.11 PT XL Axiata Tbk (Princeton Digital Group)
- 16.2.11.1. Overview
- 16.2.11.2. Products
- 16.2.11.3. SWOT Analysis
- 16.2.11.4. Recent Developments
- 16.2.11.5. Financials (Based on Availability)
- 16.2.12 NTT Ltd
- 16.2.12.1. Overview
- 16.2.12.2. Products
- 16.2.12.3. SWOT Analysis
- 16.2.12.4. Recent Developments
- 16.2.12.5. Financials (Based on Availability)
- 16.2.13 Nusantara Data Center
- 16.2.13.1. Overview
- 16.2.13.2. Products
- 16.2.13.3. SWOT Analysis
- 16.2.13.4. Recent Developments
- 16.2.13.5. Financials (Based on Availability)
- 16.2.1 PT Indosat Tbk (Big Data Exchange (BDx))
List of Figures
- Figure 1: Global Jakarta Data Center Market Revenue Breakdown (Million, %) by Region 2024 & 2032
- Figure 2: North America Jakarta Data Center Market Revenue (Million), by Country 2024 & 2032
- Figure 3: North America Jakarta Data Center Market Revenue Share (%), by Country 2024 & 2032
- Figure 4: Europe Jakarta Data Center Market Revenue (Million), by Country 2024 & 2032
- Figure 5: Europe Jakarta Data Center Market Revenue Share (%), by Country 2024 & 2032
- Figure 6: Asia Pacific Jakarta Data Center Market Revenue (Million), by Country 2024 & 2032
- Figure 7: Asia Pacific Jakarta Data Center Market Revenue Share (%), by Country 2024 & 2032
- Figure 8: Latin America Jakarta Data Center Market Revenue (Million), by Country 2024 & 2032
- Figure 9: Latin America Jakarta Data Center Market Revenue Share (%), by Country 2024 & 2032
- Figure 10: Middle East and Africa Jakarta Data Center Market Revenue (Million), by Country 2024 & 2032
- Figure 11: Middle East and Africa Jakarta Data Center Market Revenue Share (%), by Country 2024 & 2032
- Figure 12: North America Jakarta Data Center Market Revenue (Million), by DC Size 2024 & 2032
- Figure 13: North America Jakarta Data Center Market Revenue Share (%), by DC Size 2024 & 2032
- Figure 14: North America Jakarta Data Center Market Revenue (Million), by Tier Type 2024 & 2032
- Figure 15: North America Jakarta Data Center Market Revenue Share (%), by Tier Type 2024 & 2032
- Figure 16: North America Jakarta Data Center Market Revenue (Million), by Absorption 2024 & 2032
- Figure 17: North America Jakarta Data Center Market Revenue Share (%), by Absorption 2024 & 2032
- Figure 18: North America Jakarta Data Center Market Revenue (Million), by Country 2024 & 2032
- Figure 19: North America Jakarta Data Center Market Revenue Share (%), by Country 2024 & 2032
- Figure 20: South America Jakarta Data Center Market Revenue (Million), by DC Size 2024 & 2032
- Figure 21: South America Jakarta Data Center Market Revenue Share (%), by DC Size 2024 & 2032
- Figure 22: South America Jakarta Data Center Market Revenue (Million), by Tier Type 2024 & 2032
- Figure 23: South America Jakarta Data Center Market Revenue Share (%), by Tier Type 2024 & 2032
- Figure 24: South America Jakarta Data Center Market Revenue (Million), by Absorption 2024 & 2032
- Figure 25: South America Jakarta Data Center Market Revenue Share (%), by Absorption 2024 & 2032
- Figure 26: South America Jakarta Data Center Market Revenue (Million), by Country 2024 & 2032
- Figure 27: South America Jakarta Data Center Market Revenue Share (%), by Country 2024 & 2032
- Figure 28: Europe Jakarta Data Center Market Revenue (Million), by DC Size 2024 & 2032
- Figure 29: Europe Jakarta Data Center Market Revenue Share (%), by DC Size 2024 & 2032
- Figure 30: Europe Jakarta Data Center Market Revenue (Million), by Tier Type 2024 & 2032
- Figure 31: Europe Jakarta Data Center Market Revenue Share (%), by Tier Type 2024 & 2032
- Figure 32: Europe Jakarta Data Center Market Revenue (Million), by Absorption 2024 & 2032
- Figure 33: Europe Jakarta Data Center Market Revenue Share (%), by Absorption 2024 & 2032
- Figure 34: Europe Jakarta Data Center Market Revenue (Million), by Country 2024 & 2032
- Figure 35: Europe Jakarta Data Center Market Revenue Share (%), by Country 2024 & 2032
- Figure 36: Middle East & Africa Jakarta Data Center Market Revenue (Million), by DC Size 2024 & 2032
- Figure 37: Middle East & Africa Jakarta Data Center Market Revenue Share (%), by DC Size 2024 & 2032
- Figure 38: Middle East & Africa Jakarta Data Center Market Revenue (Million), by Tier Type 2024 & 2032
- Figure 39: Middle East & Africa Jakarta Data Center Market Revenue Share (%), by Tier Type 2024 & 2032
- Figure 40: Middle East & Africa Jakarta Data Center Market Revenue (Million), by Absorption 2024 & 2032
- Figure 41: Middle East & Africa Jakarta Data Center Market Revenue Share (%), by Absorption 2024 & 2032
- Figure 42: Middle East & Africa Jakarta Data Center Market Revenue (Million), by Country 2024 & 2032
- Figure 43: Middle East & Africa Jakarta Data Center Market Revenue Share (%), by Country 2024 & 2032
- Figure 44: Asia Pacific Jakarta Data Center Market Revenue (Million), by DC Size 2024 & 2032
- Figure 45: Asia Pacific Jakarta Data Center Market Revenue Share (%), by DC Size 2024 & 2032
- Figure 46: Asia Pacific Jakarta Data Center Market Revenue (Million), by Tier Type 2024 & 2032
- Figure 47: Asia Pacific Jakarta Data Center Market Revenue Share (%), by Tier Type 2024 & 2032
- Figure 48: Asia Pacific Jakarta Data Center Market Revenue (Million), by Absorption 2024 & 2032
- Figure 49: Asia Pacific Jakarta Data Center Market Revenue Share (%), by Absorption 2024 & 2032
- Figure 50: Asia Pacific Jakarta Data Center Market Revenue (Million), by Country 2024 & 2032
- Figure 51: Asia Pacific Jakarta Data Center Market Revenue Share (%), by Country 2024 & 2032
List of Tables
- Table 1: Global Jakarta Data Center Market Revenue Million Forecast, by Region 2019 & 2032
- Table 2: Global Jakarta Data Center Market Revenue Million Forecast, by DC Size 2019 & 2032
- Table 3: Global Jakarta Data Center Market Revenue Million Forecast, by Tier Type 2019 & 2032
- Table 4: Global Jakarta Data Center Market Revenue Million Forecast, by Absorption 2019 & 2032
- Table 5: Global Jakarta Data Center Market Revenue Million Forecast, by Region 2019 & 2032
- Table 6: Global Jakarta Data Center Market Revenue Million Forecast, by Country 2019 & 2032
- Table 7: Jakarta Data Center Market Revenue (Million) Forecast, by Application 2019 & 2032
- Table 8: Global Jakarta Data Center Market Revenue Million Forecast, by Country 2019 & 2032
- Table 9: Jakarta Data Center Market Revenue (Million) Forecast, by Application 2019 & 2032
- Table 10: Global Jakarta Data Center Market Revenue Million Forecast, by Country 2019 & 2032
- Table 11: Jakarta Data Center Market Revenue (Million) Forecast, by Application 2019 & 2032
- Table 12: Global Jakarta Data Center Market Revenue Million Forecast, by Country 2019 & 2032
- Table 13: Jakarta Data Center Market Revenue (Million) Forecast, by Application 2019 & 2032
- Table 14: Global Jakarta Data Center Market Revenue Million Forecast, by Country 2019 & 2032
- Table 15: Jakarta Data Center Market Revenue (Million) Forecast, by Application 2019 & 2032
- Table 16: Global Jakarta Data Center Market Revenue Million Forecast, by DC Size 2019 & 2032
- Table 17: Global Jakarta Data Center Market Revenue Million Forecast, by Tier Type 2019 & 2032
- Table 18: Global Jakarta Data Center Market Revenue Million Forecast, by Absorption 2019 & 2032
- Table 19: Global Jakarta Data Center Market Revenue Million Forecast, by Country 2019 & 2032
- Table 20: United States Jakarta Data Center Market Revenue (Million) Forecast, by Application 2019 & 2032
- Table 21: Canada Jakarta Data Center Market Revenue (Million) Forecast, by Application 2019 & 2032
- Table 22: Mexico Jakarta Data Center Market Revenue (Million) Forecast, by Application 2019 & 2032
- Table 23: Global Jakarta Data Center Market Revenue Million Forecast, by DC Size 2019 & 2032
- Table 24: Global Jakarta Data Center Market Revenue Million Forecast, by Tier Type 2019 & 2032
- Table 25: Global Jakarta Data Center Market Revenue Million Forecast, by Absorption 2019 & 2032
- Table 26: Global Jakarta Data Center Market Revenue Million Forecast, by Country 2019 & 2032
- Table 27: Brazil Jakarta Data Center Market Revenue (Million) Forecast, by Application 2019 & 2032
- Table 28: Argentina Jakarta Data Center Market Revenue (Million) Forecast, by Application 2019 & 2032
- Table 29: Rest of South America Jakarta Data Center Market Revenue (Million) Forecast, by Application 2019 & 2032
- Table 30: Global Jakarta Data Center Market Revenue Million Forecast, by DC Size 2019 & 2032
- Table 31: Global Jakarta Data Center Market Revenue Million Forecast, by Tier Type 2019 & 2032
- Table 32: Global Jakarta Data Center Market Revenue Million Forecast, by Absorption 2019 & 2032
- Table 33: Global Jakarta Data Center Market Revenue Million Forecast, by Country 2019 & 2032
- Table 34: United Kingdom Jakarta Data Center Market Revenue (Million) Forecast, by Application 2019 & 2032
- Table 35: Germany Jakarta Data Center Market Revenue (Million) Forecast, by Application 2019 & 2032
- Table 36: France Jakarta Data Center Market Revenue (Million) Forecast, by Application 2019 & 2032
- Table 37: Italy Jakarta Data Center Market Revenue (Million) Forecast, by Application 2019 & 2032
- Table 38: Spain Jakarta Data Center Market Revenue (Million) Forecast, by Application 2019 & 2032
- Table 39: Russia Jakarta Data Center Market Revenue (Million) Forecast, by Application 2019 & 2032
- Table 40: Benelux Jakarta Data Center Market Revenue (Million) Forecast, by Application 2019 & 2032
- Table 41: Nordics Jakarta Data Center Market Revenue (Million) Forecast, by Application 2019 & 2032
- Table 42: Rest of Europe Jakarta Data Center Market Revenue (Million) Forecast, by Application 2019 & 2032
- Table 43: Global Jakarta Data Center Market Revenue Million Forecast, by DC Size 2019 & 2032
- Table 44: Global Jakarta Data Center Market Revenue Million Forecast, by Tier Type 2019 & 2032
- Table 45: Global Jakarta Data Center Market Revenue Million Forecast, by Absorption 2019 & 2032
- Table 46: Global Jakarta Data Center Market Revenue Million Forecast, by Country 2019 & 2032
- Table 47: Turkey Jakarta Data Center Market Revenue (Million) Forecast, by Application 2019 & 2032
- Table 48: Israel Jakarta Data Center Market Revenue (Million) Forecast, by Application 2019 & 2032
- Table 49: GCC Jakarta Data Center Market Revenue (Million) Forecast, by Application 2019 & 2032
- Table 50: North Africa Jakarta Data Center Market Revenue (Million) Forecast, by Application 2019 & 2032
- Table 51: South Africa Jakarta Data Center Market Revenue (Million) Forecast, by Application 2019 & 2032
- Table 52: Rest of Middle East & Africa Jakarta Data Center Market Revenue (Million) Forecast, by Application 2019 & 2032
- Table 53: Global Jakarta Data Center Market Revenue Million Forecast, by DC Size 2019 & 2032
- Table 54: Global Jakarta Data Center Market Revenue Million Forecast, by Tier Type 2019 & 2032
- Table 55: Global Jakarta Data Center Market Revenue Million Forecast, by Absorption 2019 & 2032
- Table 56: Global Jakarta Data Center Market Revenue Million Forecast, by Country 2019 & 2032
- Table 57: China Jakarta Data Center Market Revenue (Million) Forecast, by Application 2019 & 2032
- Table 58: India Jakarta Data Center Market Revenue (Million) Forecast, by Application 2019 & 2032
- Table 59: Japan Jakarta Data Center Market Revenue (Million) Forecast, by Application 2019 & 2032
- Table 60: South Korea Jakarta Data Center Market Revenue (Million) Forecast, by Application 2019 & 2032
- Table 61: ASEAN Jakarta Data Center Market Revenue (Million) Forecast, by Application 2019 & 2032
- Table 62: Oceania Jakarta Data Center Market Revenue (Million) Forecast, by Application 2019 & 2032
- Table 63: Rest of Asia Pacific Jakarta Data Center Market Revenue (Million) Forecast, by Application 2019 & 2032
Frequently Asked Questions
1. What is the projected Compound Annual Growth Rate (CAGR) of the Jakarta Data Center Market?
The projected CAGR is approximately 16.49%.
2. Which companies are prominent players in the Jakarta Data Center Market?
Key companies in the market include PT Indosat Tbk (Big Data Exchange (BDx)), Space DC Pte Ltd, PT DWI Tunggal Putra (DTPNet), PT Jupiter Jala Arta (JupiterDC), Biznet Data Center, PT Sigma Cipta Caraka (Telkomsigma), Digital Edge DC, EdgeConneX Inc (GTN Data Centers), PT DCI Indonesia Tbk, NEX Data Center Indonesia, PT XL Axiata Tbk (Princeton Digital Group), NTT Ltd, Nusantara Data Center.
3. What are the main segments of the Jakarta Data Center Market?
The market segments include DC Size, Tier Type, Absorption.
4. Can you provide details about the market size?
The market size is estimated to be USD XX Million as of 2022.
5. What are some drivers contributing to market growth?
Regulations Promoting Proper Lighting for Worker Safety in Hazardous Locations; Rising Demand for Cost-effective and Energy-efficient LED Lighting Solutions.
6. What are the notable trends driving market growth?
Tier 4 is Expected to Hold Significant Share of the Market.
7. Are there any restraints impacting market growth?
High Costs of Equipment.
8. Can you provide examples of recent developments in the market?
Apr 2023: BDxIndonesia, a BDxaffiliate, began constructing a new greenfield data center, CGK3A, in TB Simatupang, South Jakarta. The data center, which has a capacity of 15 MW, seeks to deliver top data center services to Indonesian businesses and hyperscalers. The new 14,127-square-meter data center is outfitted with Tier 3 data center facilities, advanced security systems, automation technology, and high network uptime, as well as a below-average power usage effectiveness (PUE) of 1.4, which provides operational excellence and a sustainable solution without sacrificing productivity and scalability.
9. What pricing options are available for accessing the report?
Pricing options include single-user, multi-user, and enterprise licenses priced at USD 3800, USD 4500, and USD 5800 respectively.
10. Is the market size provided in terms of value or volume?
The market size is provided in terms of value, measured in Million.
11. Are there any specific market keywords associated with the report?
Yes, the market keyword associated with the report is "Jakarta Data Center Market," which aids in identifying and referencing the specific market segment covered.
12. How do I determine which pricing option suits my needs best?
The pricing options vary based on user requirements and access needs. Individual users may opt for single-user licenses, while businesses requiring broader access may choose multi-user or enterprise licenses for cost-effective access to the report.
13. Are there any additional resources or data provided in the Jakarta Data Center Market report?
While the report offers comprehensive insights, it's advisable to review the specific contents or supplementary materials provided to ascertain if additional resources or data are available.
14. How can I stay updated on further developments or reports in the Jakarta Data Center Market?
To stay informed about further developments, trends, and reports in the Jakarta Data Center Market, consider subscribing to industry newsletters, following relevant companies and organizations, or regularly checking reputable industry news sources and publications.
Methodology
Step 1 - Identification of Relevant Samples Size from Population Database


Step 2 - Approaches for Defining Global Market Size (Value, Volume* & Price*)

Note*: In applicable scenarios
Step 3 - Data Sources
Primary Research
- Web Analytics
- Survey Reports
- Research Institute
- Latest Research Reports
- Opinion Leaders
Secondary Research
- Annual Reports
- White Paper
- Latest Press Release
- Industry Association
- Paid Database
- Investor Presentations

Step 4 - Data Triangulation
Involves using different sources of information in order to increase the validity of a study
These sources are likely to be stakeholders in a program - participants, other researchers, program staff, other community members, and so on.
Then we put all data in single framework & apply various statistical tools to find out the dynamic on the market.
During the analysis stage, feedback from the stakeholder groups would be compared to determine areas of agreement as well as areas of divergence


