
Key Insights
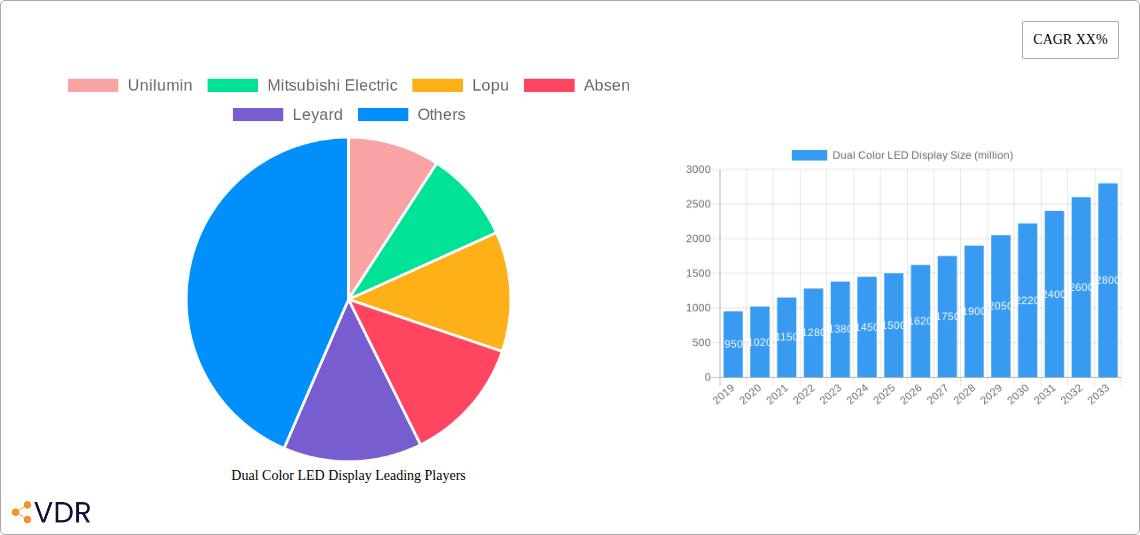
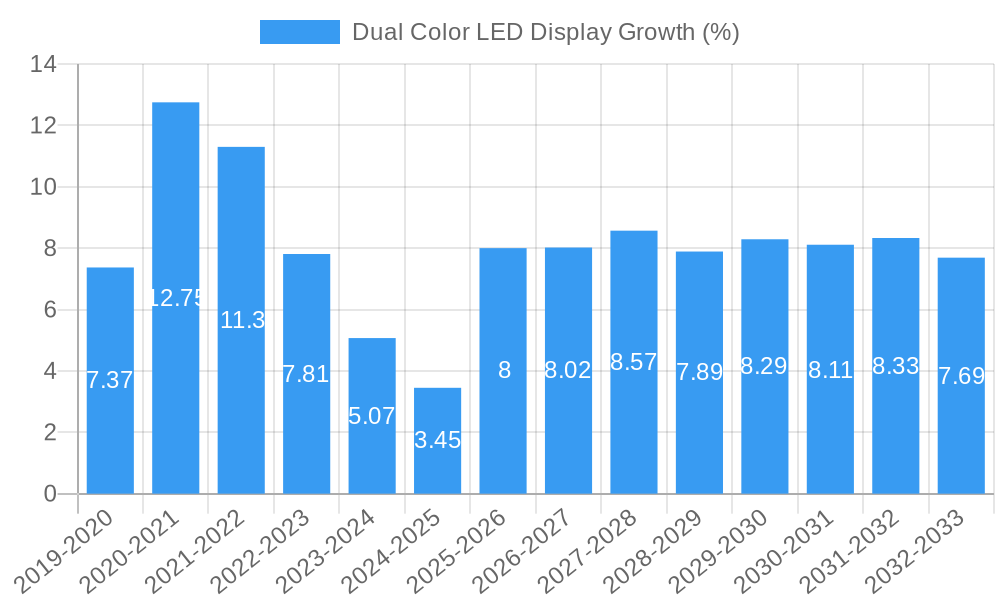
The global Dual Color LED Display market is poised for substantial growth, with an estimated market size of approximately USD 1,500 million in 2025 and projected to reach around USD 2,800 million by 2033, exhibiting a Compound Annual Growth Rate (CAGR) of approximately 8.5% during the forecast period of 2025-2033. This expansion is primarily fueled by the increasing demand for dynamic and eye-catching visual solutions across various applications. The Advertising Media segment stands out as a significant driver, leveraging dual-color LEDs for enhanced messaging and promotional effectiveness. Information Display applications, particularly in public spaces and transportation hubs, also contribute substantially to market growth due to their versatility and energy efficiency. The inherent flexibility of dual-color displays in offering distinct visual cues and the ability to convey two pieces of information simultaneously make them ideal for a wide array of commercial and public information dissemination needs.
However, certain factors present challenges to this robust growth trajectory. High initial investment costs associated with advanced dual-color LED display technology can act as a restraint, particularly for smaller businesses or in price-sensitive markets. Furthermore, the rapid evolution of LED technology, leading to quicker obsolescence of older models, necessitates continuous investment in upgrades, which can be a deterrent for some. Despite these challenges, the market is characterized by several key trends. Miniaturization and increasing pixel density are enabling the creation of more sophisticated and higher-resolution displays, while advancements in software and content management are simplifying operation and enhancing user experience. The growing adoption of LED displays in sports arenas for enhanced fan engagement and in stage performances for immersive visual backdrops are also significant growth catalysts, underscoring the market's dynamic nature and its capacity to adapt to evolving consumer and industry demands.
This in-depth market intelligence report offers a definitive analysis of the global Dual Color LED Display market. Covering the historical period from 2019 to 2024, with a robust forecast extending to 2033 based on a 2025 estimated year, this report provides actionable insights for stakeholders seeking to capitalize on this dynamic industry. We delve into market size evolution, growth trends, key drivers, emerging opportunities, and the competitive landscape, with a particular focus on the parent and child market segments, to deliver a comprehensive understanding of the LED display industry.
Dual Color LED Display Market Dynamics & Structure
The global Dual Color LED Display market exhibits a moderately concentrated structure, with key players like Unilumin, Mitsubishi Electric, and Lopu holding significant market share. Technological innovation remains a primary driver, fueled by advancements in LED chip efficiency, pixel pitch reduction, and enhanced durability. Regulatory frameworks, particularly concerning energy efficiency standards and outdoor advertising permits, are shaping market entry and product development. Competitive product substitutes, such as large-format LCDs and projection systems, present a challenge, though Dual Color LED Displays differentiate through superior brightness, contrast, and seamless large-scale deployment. End-user demographics are increasingly favoring dynamic and engaging visual experiences across various sectors. Mergers and acquisitions (M&A) trends indicate consolidation, with companies aiming to expand their product portfolios and geographical reach. For instance, the past few years have seen a steady volume of M&A deals, estimated at around 5-10 major transactions annually, totaling an estimated value of over $500 million in recent years, aimed at acquiring innovative technologies and market access.
- Market Concentration: Moderate, with top players dominating a significant portion of market share.
- Technological Innovation: Driven by pixel pitch, brightness, energy efficiency, and outdoor durability.
- Regulatory Frameworks: Energy efficiency standards and advertising regulations are key influencing factors.
- Competitive Substitutes: Large-format LCDs, projection systems.
- End-User Demographics: Growing demand for engaging and dynamic visual content.
- M&A Trends: Consolidation for portfolio expansion and market access.
Dual Color LED Display Growth Trends & Insights
The Dual Color LED Display market is poised for substantial growth, driven by an increasing global demand for high-impact visual solutions. The market size is projected to expand from an estimated $8.5 billion in 2024 to over $15.2 billion by 2033, exhibiting a compound annual growth rate (CAGR) of approximately 6.5%. Adoption rates are accelerating across nascent and established markets, spurred by the falling costs of LED components and improvements in manufacturing processes. Technological disruptions, including the integration of IoT capabilities and advanced control systems, are enhancing the functionality and versatility of these displays. Consumer behavior shifts towards personalized advertising and immersive entertainment experiences are further fueling adoption. The market penetration for Dual Color LED Displays in key application areas like advertising media and information displays is expected to reach over 70% by the end of the forecast period. The continuous evolution of pixel technology, leading to higher resolutions and refresh rates, will ensure these displays remain at the forefront of visual communication.
- Market Size Evolution: Projected to grow from an estimated $8.5 billion in 2024 to over $15.2 billion by 2033.
- CAGR: Approximately 6.5% over the forecast period (2025-2033).
- Adoption Rates: Accelerating globally, supported by cost reductions and improved manufacturing.
- Technological Disruptions: Integration of IoT, advanced control systems.
- Consumer Behavior Shifts: Demand for personalized advertising and immersive entertainment.
- Market Penetration: Expected to exceed 70% in advertising media and information display segments by 2033.
Dominant Regions, Countries, or Segments in Dual Color LED Display
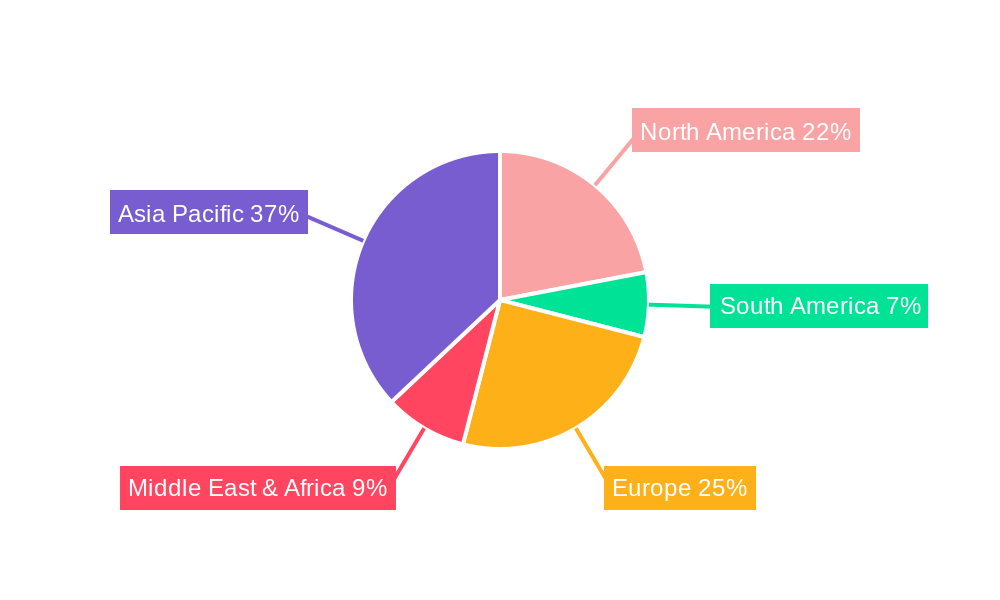
The Asia-Pacific region is set to dominate the Dual Color LED Display market, driven by robust economic growth, significant investments in smart city initiatives, and a burgeoning digital advertising sector. Countries like China, South Korea, and Japan are leading the adoption of advanced LED display technologies. Within applications, Advertising Media will remain the largest segment, projected to account for over 45% of the total market revenue by 2033. This dominance is attributed to the increasing deployment of digital billboards, retail signage, and outdoor advertising solutions that leverage the superior visual impact of Dual Color LED Displays. In terms of types, Larger than 60 Inches displays will continue to lead the market, driven by demand for large-format public displays, stadium screens, and architectural installations. The growth in this segment is further propelled by the increasing average screen sizes in commercial installations and the rising popularity of immersive visual experiences in public spaces.
- Dominant Region: Asia-Pacific, driven by economic growth and smart city initiatives.
- Leading Countries: China, South Korea, Japan.
- Dominant Application Segment: Advertising Media (projected >45% market share by 2033).
- Key Drivers for Advertising Media: Digital billboards, retail signage, outdoor advertising.
- Dominant Type Segment: Larger than 60 Inches displays.
- Drivers for Larger than 60 Inches: Public displays, stadium screens, architectural installations.
Dual Color LED Display Product Landscape
The Dual Color LED Display product landscape is characterized by continuous innovation, focusing on enhanced brightness, improved color accuracy, and reduced energy consumption. Manufacturers are offering a diverse range of products, from compact under-40-inch displays for retail Point-of-Sale to massive larger-than-60-inch installations for stadiums and public venues. Unique selling propositions include customizable configurations, modular designs for scalability, and advanced software for content management and dynamic display control. Technological advancements such as higher refresh rates, wider viewing angles, and improved weather resistance are expanding the application possibilities for these displays.
Key Drivers, Barriers & Challenges in Dual Color LED Display
Key Drivers:
- Increasing demand for digital advertising and out-of-home media: The shift towards dynamic and engaging advertisements fuels the adoption of LED displays.
- Technological advancements: Improvements in LED technology, including pixel density, brightness, and energy efficiency, make displays more attractive and cost-effective.
- Smart city initiatives: Governments worldwide are investing in smart infrastructure, including digital signage for public information and services.
- Growth in entertainment and sports sectors: Demand for high-resolution, immersive visual experiences in stadiums, arenas, and event venues.
Barriers & Challenges:
- High initial investment costs: Despite falling prices, the upfront cost can be a barrier for small and medium-sized businesses.
- Supply chain disruptions and raw material volatility: Geopolitical factors and global demand can impact the availability and cost of key components.
- Intense competition: A crowded market with numerous players can lead to price pressures and reduced profit margins.
- Technical expertise for installation and maintenance: Complex installations require specialized knowledge, potentially limiting adoption in less developed regions.
Emerging Opportunities in Dual Color LED Display
Emerging opportunities in the Dual Color LED Display market lie in the expansion into niche applications such as interactive retail displays, augmented reality (AR) integration for advertising, and customized digital art installations. The increasing focus on sustainability is driving demand for energy-efficient LED displays, presenting opportunities for manufacturers employing advanced power-saving technologies. Furthermore, the growth of the metaverse and virtual production creates new avenues for high-resolution LED video walls, offering immersive backdrops for content creation. Untapped markets in developing economies, coupled with increasing digital literacy, offer significant growth potential.
Growth Accelerators in the Dual Color LED Display Industry
Long-term growth in the Dual Color LED Display industry will be significantly accelerated by continued miniaturization of LED components, enabling the development of ultra-fine pixel pitch displays for indoor applications requiring high clarity. Strategic partnerships between LED display manufacturers and content creation platforms, as well as software providers, will streamline the adoption process and enhance the user experience. Market expansion strategies targeting emerging economies through localized manufacturing and distribution networks will unlock new customer bases. Furthermore, the integration of AI for dynamic content optimization and predictive maintenance will further solidify the value proposition of these displays.
Key Players Shaping the Dual Color LED Display Market
- Unilumin
- Mitsubishi Electric
- Lopu
- Absen
- Leyard
- LianTronics
- Sansi
- AOTO
- Daktronics
- Barco
- Yaham
- Ledman
- LightKing
- Handson
- QSTech
Notable Milestones in Dual Color LED Display Sector
- 2019: Introduction of micro-LED technology prototypes, signaling a future shift in display capabilities.
- 2020: Significant advancements in outdoor LED display durability and weather resistance, expanding application scope.
- 2021: Increased integration of 5G technology with LED displays for real-time data streaming and interactive experiences.
- 2022: Focus on energy efficiency and sustainable manufacturing processes by leading companies.
- 2023: Launch of advanced AI-powered content management systems for dynamic advertising.
- 2024: Growing adoption of transparent LED displays in architectural and retail spaces.
In-Depth Dual Color LED Display Market Outlook
The Dual Color LED Display market is set for sustained and robust growth, driven by an insatiable demand for captivating visual experiences across diverse industries. The synergy between technological innovation, supportive government initiatives, and evolving consumer preferences will act as powerful growth accelerators. Strategic opportunities abound in the development of more energy-efficient solutions, the integration of intelligent software for seamless content delivery, and the expansion into emerging geographical markets. Stakeholders who invest in cutting-edge technology and foster strategic partnerships are poised to capture significant market share and lead the future of visual communication.
Dual Color LED Display Segmentation
-
1. Application
- 1.1. Advertising Media
- 1.2. Information Display
- 1.3. Sports Arena
- 1.4. Stage Performance
- 1.5. Others
-
2. Types
- 2.1. Under 40 Inches
- 2.2. 40-50 Inches
- 2.3. 50-60 Inches
- 2.4. Larger than 60 Inches
Dual Color LED Display Segmentation By Geography
-
1. North America
- 1.1. United States
- 1.2. Canada
- 1.3. Mexico
-
2. South America
- 2.1. Brazil
- 2.2. Argentina
- 2.3. Rest of South America
-
3. Europe
- 3.1. United Kingdom
- 3.2. Germany
- 3.3. France
- 3.4. Italy
- 3.5. Spain
- 3.6. Russia
- 3.7. Benelux
- 3.8. Nordics
- 3.9. Rest of Europe
-
4. Middle East & Africa
- 4.1. Turkey
- 4.2. Israel
- 4.3. GCC
- 4.4. North Africa
- 4.5. South Africa
- 4.6. Rest of Middle East & Africa
-
5. Asia Pacific
- 5.1. China
- 5.2. India
- 5.3. Japan
- 5.4. South Korea
- 5.5. ASEAN
- 5.6. Oceania
- 5.7. Rest of Asia Pacific
Dual Color LED Display REPORT HIGHLIGHTS
| Aspects | Details |
|---|---|
| Study Period | 2019-2033 |
| Base Year | 2024 |
| Estimated Year | 2025 |
| Forecast Period | 2025-2033 |
| Historical Period | 2019-2024 |
| Growth Rate | CAGR of XX% from 2019-2033 |
| Segmentation |
|
Table of Contents
- 1. Introduction
- 1.1. Research Scope
- 1.2. Market Segmentation
- 1.3. Research Methodology
- 1.4. Definitions and Assumptions
- 2. Executive Summary
- 2.1. Introduction
- 3. Market Dynamics
- 3.1. Introduction
- 3.2. Market Drivers
- 3.3. Market Restrains
- 3.4. Market Trends
- 4. Market Factor Analysis
- 4.1. Porters Five Forces
- 4.2. Supply/Value Chain
- 4.3. PESTEL analysis
- 4.4. Market Entropy
- 4.5. Patent/Trademark Analysis
- 5. Global Dual Color LED Display Analysis, Insights and Forecast, 2019-2031
- 5.1. Market Analysis, Insights and Forecast - by Application
- 5.1.1. Advertising Media
- 5.1.2. Information Display
- 5.1.3. Sports Arena
- 5.1.4. Stage Performance
- 5.1.5. Others
- 5.2. Market Analysis, Insights and Forecast - by Types
- 5.2.1. Under 40 Inches
- 5.2.2. 40-50 Inches
- 5.2.3. 50-60 Inches
- 5.2.4. Larger than 60 Inches
- 5.3. Market Analysis, Insights and Forecast - by Region
- 5.3.1. North America
- 5.3.2. South America
- 5.3.3. Europe
- 5.3.4. Middle East & Africa
- 5.3.5. Asia Pacific
- 5.1. Market Analysis, Insights and Forecast - by Application
- 6. North America Dual Color LED Display Analysis, Insights and Forecast, 2019-2031
- 6.1. Market Analysis, Insights and Forecast - by Application
- 6.1.1. Advertising Media
- 6.1.2. Information Display
- 6.1.3. Sports Arena
- 6.1.4. Stage Performance
- 6.1.5. Others
- 6.2. Market Analysis, Insights and Forecast - by Types
- 6.2.1. Under 40 Inches
- 6.2.2. 40-50 Inches
- 6.2.3. 50-60 Inches
- 6.2.4. Larger than 60 Inches
- 6.1. Market Analysis, Insights and Forecast - by Application
- 7. South America Dual Color LED Display Analysis, Insights and Forecast, 2019-2031
- 7.1. Market Analysis, Insights and Forecast - by Application
- 7.1.1. Advertising Media
- 7.1.2. Information Display
- 7.1.3. Sports Arena
- 7.1.4. Stage Performance
- 7.1.5. Others
- 7.2. Market Analysis, Insights and Forecast - by Types
- 7.2.1. Under 40 Inches
- 7.2.2. 40-50 Inches
- 7.2.3. 50-60 Inches
- 7.2.4. Larger than 60 Inches
- 7.1. Market Analysis, Insights and Forecast - by Application
- 8. Europe Dual Color LED Display Analysis, Insights and Forecast, 2019-2031
- 8.1. Market Analysis, Insights and Forecast - by Application
- 8.1.1. Advertising Media
- 8.1.2. Information Display
- 8.1.3. Sports Arena
- 8.1.4. Stage Performance
- 8.1.5. Others
- 8.2. Market Analysis, Insights and Forecast - by Types
- 8.2.1. Under 40 Inches
- 8.2.2. 40-50 Inches
- 8.2.3. 50-60 Inches
- 8.2.4. Larger than 60 Inches
- 8.1. Market Analysis, Insights and Forecast - by Application
- 9. Middle East & Africa Dual Color LED Display Analysis, Insights and Forecast, 2019-2031
- 9.1. Market Analysis, Insights and Forecast - by Application
- 9.1.1. Advertising Media
- 9.1.2. Information Display
- 9.1.3. Sports Arena
- 9.1.4. Stage Performance
- 9.1.5. Others
- 9.2. Market Analysis, Insights and Forecast - by Types
- 9.2.1. Under 40 Inches
- 9.2.2. 40-50 Inches
- 9.2.3. 50-60 Inches
- 9.2.4. Larger than 60 Inches
- 9.1. Market Analysis, Insights and Forecast - by Application
- 10. Asia Pacific Dual Color LED Display Analysis, Insights and Forecast, 2019-2031
- 10.1. Market Analysis, Insights and Forecast - by Application
- 10.1.1. Advertising Media
- 10.1.2. Information Display
- 10.1.3. Sports Arena
- 10.1.4. Stage Performance
- 10.1.5. Others
- 10.2. Market Analysis, Insights and Forecast - by Types
- 10.2.1. Under 40 Inches
- 10.2.2. 40-50 Inches
- 10.2.3. 50-60 Inches
- 10.2.4. Larger than 60 Inches
- 10.1. Market Analysis, Insights and Forecast - by Application
- 11. Competitive Analysis
- 11.1. Global Market Share Analysis 2024
- 11.2. Company Profiles
- 11.2.1 Unilumin
- 11.2.1.1. Overview
- 11.2.1.2. Products
- 11.2.1.3. SWOT Analysis
- 11.2.1.4. Recent Developments
- 11.2.1.5. Financials (Based on Availability)
- 11.2.2 Mitsubishi Electric
- 11.2.2.1. Overview
- 11.2.2.2. Products
- 11.2.2.3. SWOT Analysis
- 11.2.2.4. Recent Developments
- 11.2.2.5. Financials (Based on Availability)
- 11.2.3 Lopu
- 11.2.3.1. Overview
- 11.2.3.2. Products
- 11.2.3.3. SWOT Analysis
- 11.2.3.4. Recent Developments
- 11.2.3.5. Financials (Based on Availability)
- 11.2.4 Absen
- 11.2.4.1. Overview
- 11.2.4.2. Products
- 11.2.4.3. SWOT Analysis
- 11.2.4.4. Recent Developments
- 11.2.4.5. Financials (Based on Availability)
- 11.2.5 Leyard
- 11.2.5.1. Overview
- 11.2.5.2. Products
- 11.2.5.3. SWOT Analysis
- 11.2.5.4. Recent Developments
- 11.2.5.5. Financials (Based on Availability)
- 11.2.6 LianTronics
- 11.2.6.1. Overview
- 11.2.6.2. Products
- 11.2.6.3. SWOT Analysis
- 11.2.6.4. Recent Developments
- 11.2.6.5. Financials (Based on Availability)
- 11.2.7 Sansi
- 11.2.7.1. Overview
- 11.2.7.2. Products
- 11.2.7.3. SWOT Analysis
- 11.2.7.4. Recent Developments
- 11.2.7.5. Financials (Based on Availability)
- 11.2.8 AOTO
- 11.2.8.1. Overview
- 11.2.8.2. Products
- 11.2.8.3. SWOT Analysis
- 11.2.8.4. Recent Developments
- 11.2.8.5. Financials (Based on Availability)
- 11.2.9 Daktronics
- 11.2.9.1. Overview
- 11.2.9.2. Products
- 11.2.9.3. SWOT Analysis
- 11.2.9.4. Recent Developments
- 11.2.9.5. Financials (Based on Availability)
- 11.2.10 Barco
- 11.2.10.1. Overview
- 11.2.10.2. Products
- 11.2.10.3. SWOT Analysis
- 11.2.10.4. Recent Developments
- 11.2.10.5. Financials (Based on Availability)
- 11.2.11 Yaham
- 11.2.11.1. Overview
- 11.2.11.2. Products
- 11.2.11.3. SWOT Analysis
- 11.2.11.4. Recent Developments
- 11.2.11.5. Financials (Based on Availability)
- 11.2.12 Ledman
- 11.2.12.1. Overview
- 11.2.12.2. Products
- 11.2.12.3. SWOT Analysis
- 11.2.12.4. Recent Developments
- 11.2.12.5. Financials (Based on Availability)
- 11.2.13 LightKing
- 11.2.13.1. Overview
- 11.2.13.2. Products
- 11.2.13.3. SWOT Analysis
- 11.2.13.4. Recent Developments
- 11.2.13.5. Financials (Based on Availability)
- 11.2.14 Handson
- 11.2.14.1. Overview
- 11.2.14.2. Products
- 11.2.14.3. SWOT Analysis
- 11.2.14.4. Recent Developments
- 11.2.14.5. Financials (Based on Availability)
- 11.2.15 QSTech
- 11.2.15.1. Overview
- 11.2.15.2. Products
- 11.2.15.3. SWOT Analysis
- 11.2.15.4. Recent Developments
- 11.2.15.5. Financials (Based on Availability)
- 11.2.1 Unilumin
List of Figures
- Figure 1: Global Dual Color LED Display Revenue Breakdown (million, %) by Region 2024 & 2032
- Figure 2: Global Dual Color LED Display Volume Breakdown (K, %) by Region 2024 & 2032
- Figure 3: North America Dual Color LED Display Revenue (million), by Application 2024 & 2032
- Figure 4: North America Dual Color LED Display Volume (K), by Application 2024 & 2032
- Figure 5: North America Dual Color LED Display Revenue Share (%), by Application 2024 & 2032
- Figure 6: North America Dual Color LED Display Volume Share (%), by Application 2024 & 2032
- Figure 7: North America Dual Color LED Display Revenue (million), by Types 2024 & 2032
- Figure 8: North America Dual Color LED Display Volume (K), by Types 2024 & 2032
- Figure 9: North America Dual Color LED Display Revenue Share (%), by Types 2024 & 2032
- Figure 10: North America Dual Color LED Display Volume Share (%), by Types 2024 & 2032
- Figure 11: North America Dual Color LED Display Revenue (million), by Country 2024 & 2032
- Figure 12: North America Dual Color LED Display Volume (K), by Country 2024 & 2032
- Figure 13: North America Dual Color LED Display Revenue Share (%), by Country 2024 & 2032
- Figure 14: North America Dual Color LED Display Volume Share (%), by Country 2024 & 2032
- Figure 15: South America Dual Color LED Display Revenue (million), by Application 2024 & 2032
- Figure 16: South America Dual Color LED Display Volume (K), by Application 2024 & 2032
- Figure 17: South America Dual Color LED Display Revenue Share (%), by Application 2024 & 2032
- Figure 18: South America Dual Color LED Display Volume Share (%), by Application 2024 & 2032
- Figure 19: South America Dual Color LED Display Revenue (million), by Types 2024 & 2032
- Figure 20: South America Dual Color LED Display Volume (K), by Types 2024 & 2032
- Figure 21: South America Dual Color LED Display Revenue Share (%), by Types 2024 & 2032
- Figure 22: South America Dual Color LED Display Volume Share (%), by Types 2024 & 2032
- Figure 23: South America Dual Color LED Display Revenue (million), by Country 2024 & 2032
- Figure 24: South America Dual Color LED Display Volume (K), by Country 2024 & 2032
- Figure 25: South America Dual Color LED Display Revenue Share (%), by Country 2024 & 2032
- Figure 26: South America Dual Color LED Display Volume Share (%), by Country 2024 & 2032
- Figure 27: Europe Dual Color LED Display Revenue (million), by Application 2024 & 2032
- Figure 28: Europe Dual Color LED Display Volume (K), by Application 2024 & 2032
- Figure 29: Europe Dual Color LED Display Revenue Share (%), by Application 2024 & 2032
- Figure 30: Europe Dual Color LED Display Volume Share (%), by Application 2024 & 2032
- Figure 31: Europe Dual Color LED Display Revenue (million), by Types 2024 & 2032
- Figure 32: Europe Dual Color LED Display Volume (K), by Types 2024 & 2032
- Figure 33: Europe Dual Color LED Display Revenue Share (%), by Types 2024 & 2032
- Figure 34: Europe Dual Color LED Display Volume Share (%), by Types 2024 & 2032
- Figure 35: Europe Dual Color LED Display Revenue (million), by Country 2024 & 2032
- Figure 36: Europe Dual Color LED Display Volume (K), by Country 2024 & 2032
- Figure 37: Europe Dual Color LED Display Revenue Share (%), by Country 2024 & 2032
- Figure 38: Europe Dual Color LED Display Volume Share (%), by Country 2024 & 2032
- Figure 39: Middle East & Africa Dual Color LED Display Revenue (million), by Application 2024 & 2032
- Figure 40: Middle East & Africa Dual Color LED Display Volume (K), by Application 2024 & 2032
- Figure 41: Middle East & Africa Dual Color LED Display Revenue Share (%), by Application 2024 & 2032
- Figure 42: Middle East & Africa Dual Color LED Display Volume Share (%), by Application 2024 & 2032
- Figure 43: Middle East & Africa Dual Color LED Display Revenue (million), by Types 2024 & 2032
- Figure 44: Middle East & Africa Dual Color LED Display Volume (K), by Types 2024 & 2032
- Figure 45: Middle East & Africa Dual Color LED Display Revenue Share (%), by Types 2024 & 2032
- Figure 46: Middle East & Africa Dual Color LED Display Volume Share (%), by Types 2024 & 2032
- Figure 47: Middle East & Africa Dual Color LED Display Revenue (million), by Country 2024 & 2032
- Figure 48: Middle East & Africa Dual Color LED Display Volume (K), by Country 2024 & 2032
- Figure 49: Middle East & Africa Dual Color LED Display Revenue Share (%), by Country 2024 & 2032
- Figure 50: Middle East & Africa Dual Color LED Display Volume Share (%), by Country 2024 & 2032
- Figure 51: Asia Pacific Dual Color LED Display Revenue (million), by Application 2024 & 2032
- Figure 52: Asia Pacific Dual Color LED Display Volume (K), by Application 2024 & 2032
- Figure 53: Asia Pacific Dual Color LED Display Revenue Share (%), by Application 2024 & 2032
- Figure 54: Asia Pacific Dual Color LED Display Volume Share (%), by Application 2024 & 2032
- Figure 55: Asia Pacific Dual Color LED Display Revenue (million), by Types 2024 & 2032
- Figure 56: Asia Pacific Dual Color LED Display Volume (K), by Types 2024 & 2032
- Figure 57: Asia Pacific Dual Color LED Display Revenue Share (%), by Types 2024 & 2032
- Figure 58: Asia Pacific Dual Color LED Display Volume Share (%), by Types 2024 & 2032
- Figure 59: Asia Pacific Dual Color LED Display Revenue (million), by Country 2024 & 2032
- Figure 60: Asia Pacific Dual Color LED Display Volume (K), by Country 2024 & 2032
- Figure 61: Asia Pacific Dual Color LED Display Revenue Share (%), by Country 2024 & 2032
- Figure 62: Asia Pacific Dual Color LED Display Volume Share (%), by Country 2024 & 2032
List of Tables
- Table 1: Global Dual Color LED Display Revenue million Forecast, by Region 2019 & 2032
- Table 2: Global Dual Color LED Display Volume K Forecast, by Region 2019 & 2032
- Table 3: Global Dual Color LED Display Revenue million Forecast, by Application 2019 & 2032
- Table 4: Global Dual Color LED Display Volume K Forecast, by Application 2019 & 2032
- Table 5: Global Dual Color LED Display Revenue million Forecast, by Types 2019 & 2032
- Table 6: Global Dual Color LED Display Volume K Forecast, by Types 2019 & 2032
- Table 7: Global Dual Color LED Display Revenue million Forecast, by Region 2019 & 2032
- Table 8: Global Dual Color LED Display Volume K Forecast, by Region 2019 & 2032
- Table 9: Global Dual Color LED Display Revenue million Forecast, by Application 2019 & 2032
- Table 10: Global Dual Color LED Display Volume K Forecast, by Application 2019 & 2032
- Table 11: Global Dual Color LED Display Revenue million Forecast, by Types 2019 & 2032
- Table 12: Global Dual Color LED Display Volume K Forecast, by Types 2019 & 2032
- Table 13: Global Dual Color LED Display Revenue million Forecast, by Country 2019 & 2032
- Table 14: Global Dual Color LED Display Volume K Forecast, by Country 2019 & 2032
- Table 15: United States Dual Color LED Display Revenue (million) Forecast, by Application 2019 & 2032
- Table 16: United States Dual Color LED Display Volume (K) Forecast, by Application 2019 & 2032
- Table 17: Canada Dual Color LED Display Revenue (million) Forecast, by Application 2019 & 2032
- Table 18: Canada Dual Color LED Display Volume (K) Forecast, by Application 2019 & 2032
- Table 19: Mexico Dual Color LED Display Revenue (million) Forecast, by Application 2019 & 2032
- Table 20: Mexico Dual Color LED Display Volume (K) Forecast, by Application 2019 & 2032
- Table 21: Global Dual Color LED Display Revenue million Forecast, by Application 2019 & 2032
- Table 22: Global Dual Color LED Display Volume K Forecast, by Application 2019 & 2032
- Table 23: Global Dual Color LED Display Revenue million Forecast, by Types 2019 & 2032
- Table 24: Global Dual Color LED Display Volume K Forecast, by Types 2019 & 2032
- Table 25: Global Dual Color LED Display Revenue million Forecast, by Country 2019 & 2032
- Table 26: Global Dual Color LED Display Volume K Forecast, by Country 2019 & 2032
- Table 27: Brazil Dual Color LED Display Revenue (million) Forecast, by Application 2019 & 2032
- Table 28: Brazil Dual Color LED Display Volume (K) Forecast, by Application 2019 & 2032
- Table 29: Argentina Dual Color LED Display Revenue (million) Forecast, by Application 2019 & 2032
- Table 30: Argentina Dual Color LED Display Volume (K) Forecast, by Application 2019 & 2032
- Table 31: Rest of South America Dual Color LED Display Revenue (million) Forecast, by Application 2019 & 2032
- Table 32: Rest of South America Dual Color LED Display Volume (K) Forecast, by Application 2019 & 2032
- Table 33: Global Dual Color LED Display Revenue million Forecast, by Application 2019 & 2032
- Table 34: Global Dual Color LED Display Volume K Forecast, by Application 2019 & 2032
- Table 35: Global Dual Color LED Display Revenue million Forecast, by Types 2019 & 2032
- Table 36: Global Dual Color LED Display Volume K Forecast, by Types 2019 & 2032
- Table 37: Global Dual Color LED Display Revenue million Forecast, by Country 2019 & 2032
- Table 38: Global Dual Color LED Display Volume K Forecast, by Country 2019 & 2032
- Table 39: United Kingdom Dual Color LED Display Revenue (million) Forecast, by Application 2019 & 2032
- Table 40: United Kingdom Dual Color LED Display Volume (K) Forecast, by Application 2019 & 2032
- Table 41: Germany Dual Color LED Display Revenue (million) Forecast, by Application 2019 & 2032
- Table 42: Germany Dual Color LED Display Volume (K) Forecast, by Application 2019 & 2032
- Table 43: France Dual Color LED Display Revenue (million) Forecast, by Application 2019 & 2032
- Table 44: France Dual Color LED Display Volume (K) Forecast, by Application 2019 & 2032
- Table 45: Italy Dual Color LED Display Revenue (million) Forecast, by Application 2019 & 2032
- Table 46: Italy Dual Color LED Display Volume (K) Forecast, by Application 2019 & 2032
- Table 47: Spain Dual Color LED Display Revenue (million) Forecast, by Application 2019 & 2032
- Table 48: Spain Dual Color LED Display Volume (K) Forecast, by Application 2019 & 2032
- Table 49: Russia Dual Color LED Display Revenue (million) Forecast, by Application 2019 & 2032
- Table 50: Russia Dual Color LED Display Volume (K) Forecast, by Application 2019 & 2032
- Table 51: Benelux Dual Color LED Display Revenue (million) Forecast, by Application 2019 & 2032
- Table 52: Benelux Dual Color LED Display Volume (K) Forecast, by Application 2019 & 2032
- Table 53: Nordics Dual Color LED Display Revenue (million) Forecast, by Application 2019 & 2032
- Table 54: Nordics Dual Color LED Display Volume (K) Forecast, by Application 2019 & 2032
- Table 55: Rest of Europe Dual Color LED Display Revenue (million) Forecast, by Application 2019 & 2032
- Table 56: Rest of Europe Dual Color LED Display Volume (K) Forecast, by Application 2019 & 2032
- Table 57: Global Dual Color LED Display Revenue million Forecast, by Application 2019 & 2032
- Table 58: Global Dual Color LED Display Volume K Forecast, by Application 2019 & 2032
- Table 59: Global Dual Color LED Display Revenue million Forecast, by Types 2019 & 2032
- Table 60: Global Dual Color LED Display Volume K Forecast, by Types 2019 & 2032
- Table 61: Global Dual Color LED Display Revenue million Forecast, by Country 2019 & 2032
- Table 62: Global Dual Color LED Display Volume K Forecast, by Country 2019 & 2032
- Table 63: Turkey Dual Color LED Display Revenue (million) Forecast, by Application 2019 & 2032
- Table 64: Turkey Dual Color LED Display Volume (K) Forecast, by Application 2019 & 2032
- Table 65: Israel Dual Color LED Display Revenue (million) Forecast, by Application 2019 & 2032
- Table 66: Israel Dual Color LED Display Volume (K) Forecast, by Application 2019 & 2032
- Table 67: GCC Dual Color LED Display Revenue (million) Forecast, by Application 2019 & 2032
- Table 68: GCC Dual Color LED Display Volume (K) Forecast, by Application 2019 & 2032
- Table 69: North Africa Dual Color LED Display Revenue (million) Forecast, by Application 2019 & 2032
- Table 70: North Africa Dual Color LED Display Volume (K) Forecast, by Application 2019 & 2032
- Table 71: South Africa Dual Color LED Display Revenue (million) Forecast, by Application 2019 & 2032
- Table 72: South Africa Dual Color LED Display Volume (K) Forecast, by Application 2019 & 2032
- Table 73: Rest of Middle East & Africa Dual Color LED Display Revenue (million) Forecast, by Application 2019 & 2032
- Table 74: Rest of Middle East & Africa Dual Color LED Display Volume (K) Forecast, by Application 2019 & 2032
- Table 75: Global Dual Color LED Display Revenue million Forecast, by Application 2019 & 2032
- Table 76: Global Dual Color LED Display Volume K Forecast, by Application 2019 & 2032
- Table 77: Global Dual Color LED Display Revenue million Forecast, by Types 2019 & 2032
- Table 78: Global Dual Color LED Display Volume K Forecast, by Types 2019 & 2032
- Table 79: Global Dual Color LED Display Revenue million Forecast, by Country 2019 & 2032
- Table 80: Global Dual Color LED Display Volume K Forecast, by Country 2019 & 2032
- Table 81: China Dual Color LED Display Revenue (million) Forecast, by Application 2019 & 2032
- Table 82: China Dual Color LED Display Volume (K) Forecast, by Application 2019 & 2032
- Table 83: India Dual Color LED Display Revenue (million) Forecast, by Application 2019 & 2032
- Table 84: India Dual Color LED Display Volume (K) Forecast, by Application 2019 & 2032
- Table 85: Japan Dual Color LED Display Revenue (million) Forecast, by Application 2019 & 2032
- Table 86: Japan Dual Color LED Display Volume (K) Forecast, by Application 2019 & 2032
- Table 87: South Korea Dual Color LED Display Revenue (million) Forecast, by Application 2019 & 2032
- Table 88: South Korea Dual Color LED Display Volume (K) Forecast, by Application 2019 & 2032
- Table 89: ASEAN Dual Color LED Display Revenue (million) Forecast, by Application 2019 & 2032
- Table 90: ASEAN Dual Color LED Display Volume (K) Forecast, by Application 2019 & 2032
- Table 91: Oceania Dual Color LED Display Revenue (million) Forecast, by Application 2019 & 2032
- Table 92: Oceania Dual Color LED Display Volume (K) Forecast, by Application 2019 & 2032
- Table 93: Rest of Asia Pacific Dual Color LED Display Revenue (million) Forecast, by Application 2019 & 2032
- Table 94: Rest of Asia Pacific Dual Color LED Display Volume (K) Forecast, by Application 2019 & 2032
Frequently Asked Questions
1. What is the projected Compound Annual Growth Rate (CAGR) of the Dual Color LED Display?
The projected CAGR is approximately XX%.
2. Which companies are prominent players in the Dual Color LED Display?
Key companies in the market include Unilumin, Mitsubishi Electric, Lopu, Absen, Leyard, LianTronics, Sansi, AOTO, Daktronics, Barco, Yaham, Ledman, LightKing, Handson, QSTech.
3. What are the main segments of the Dual Color LED Display?
The market segments include Application, Types.
4. Can you provide details about the market size?
The market size is estimated to be USD XXX million as of 2022.
5. What are some drivers contributing to market growth?
N/A
6. What are the notable trends driving market growth?
N/A
7. Are there any restraints impacting market growth?
N/A
8. Can you provide examples of recent developments in the market?
N/A
9. What pricing options are available for accessing the report?
Pricing options include single-user, multi-user, and enterprise licenses priced at USD 3350.00, USD 5025.00, and USD 6700.00 respectively.
10. Is the market size provided in terms of value or volume?
The market size is provided in terms of value, measured in million and volume, measured in K.
11. Are there any specific market keywords associated with the report?
Yes, the market keyword associated with the report is "Dual Color LED Display," which aids in identifying and referencing the specific market segment covered.
12. How do I determine which pricing option suits my needs best?
The pricing options vary based on user requirements and access needs. Individual users may opt for single-user licenses, while businesses requiring broader access may choose multi-user or enterprise licenses for cost-effective access to the report.
13. Are there any additional resources or data provided in the Dual Color LED Display report?
While the report offers comprehensive insights, it's advisable to review the specific contents or supplementary materials provided to ascertain if additional resources or data are available.
14. How can I stay updated on further developments or reports in the Dual Color LED Display?
To stay informed about further developments, trends, and reports in the Dual Color LED Display, consider subscribing to industry newsletters, following relevant companies and organizations, or regularly checking reputable industry news sources and publications.
Methodology
Step 1 - Identification of Relevant Samples Size from Population Database


Step 2 - Approaches for Defining Global Market Size (Value, Volume* & Price*)

Note*: In applicable scenarios
Step 3 - Data Sources
Primary Research
- Web Analytics
- Survey Reports
- Research Institute
- Latest Research Reports
- Opinion Leaders
Secondary Research
- Annual Reports
- White Paper
- Latest Press Release
- Industry Association
- Paid Database
- Investor Presentations

Step 4 - Data Triangulation
Involves using different sources of information in order to increase the validity of a study
These sources are likely to be stakeholders in a program - participants, other researchers, program staff, other community members, and so on.
Then we put all data in single framework & apply various statistical tools to find out the dynamic on the market.
During the analysis stage, feedback from the stakeholder groups would be compared to determine areas of agreement as well as areas of divergence


