
Key Insights
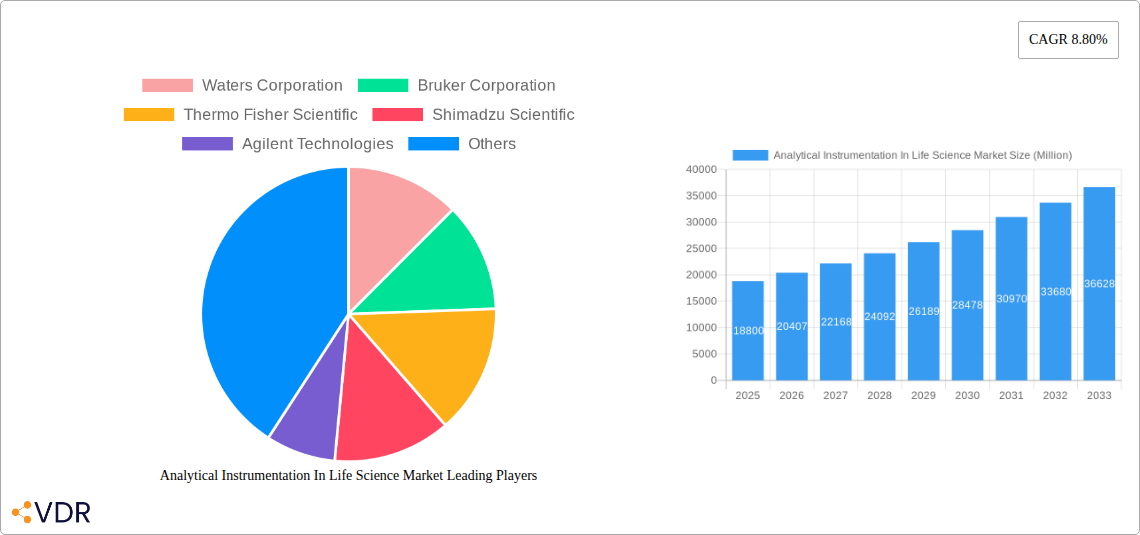
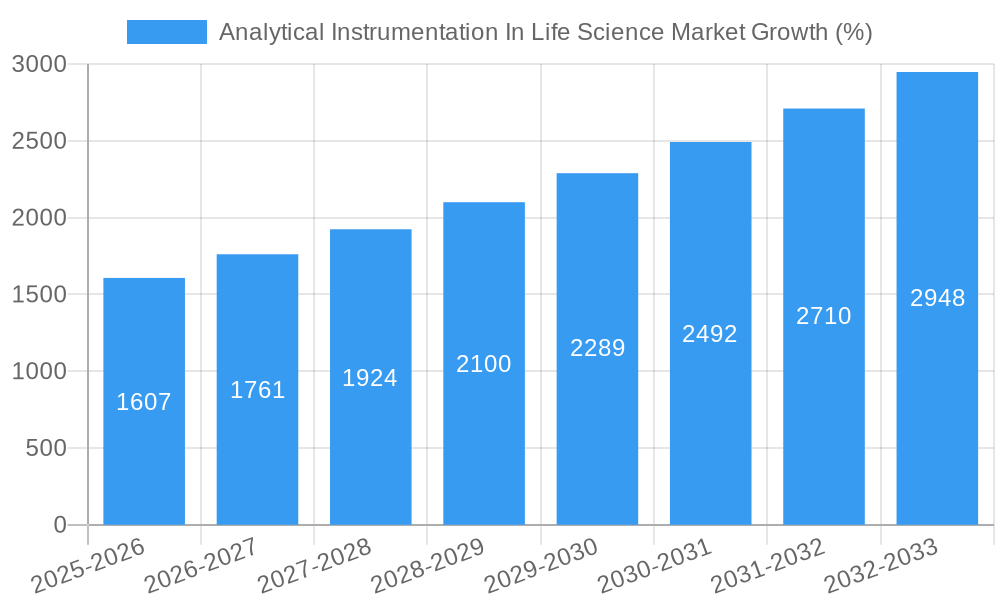
The global Analytical Instrumentation in Life Science market is poised for significant growth, projected to reach \$18.80 billion in 2025 and expand at a compound annual growth rate (CAGR) of 8.80% from 2025 to 2033. This robust expansion is driven by several key factors. Firstly, the burgeoning biopharmaceutical and pharmaceutical industries are heavily reliant on advanced analytical instrumentation for drug discovery, development, and quality control. Increased research and development spending, coupled with the growing demand for personalized medicine and novel therapeutics, fuels this market segment's growth. Secondly, technological advancements in analytical instrumentation, such as the development of miniaturized, high-throughput devices and improved software for data analysis, are enhancing efficiency and expanding applications. This includes advancements in mass spectrometry, liquid chromatography, and other analytical techniques that improve accuracy and speed in analysis, leading to faster drug development timelines. Finally, stringent regulatory requirements for pharmaceutical and biopharmaceutical products necessitate sophisticated analytical tools to ensure product safety and efficacy, further stimulating market demand.
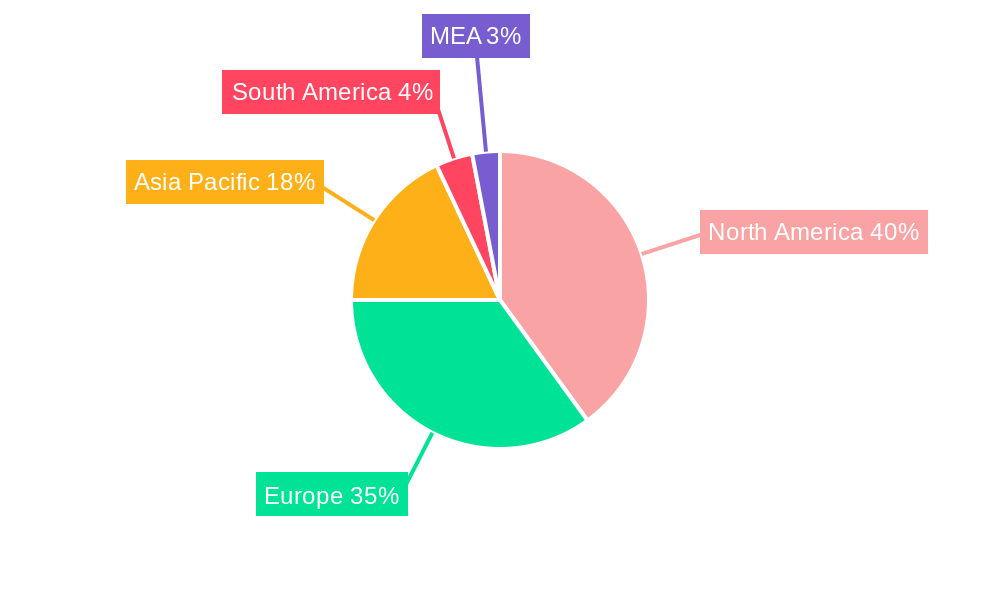
The market segmentation reveals strong growth across various product types, with chromatographs, spectrometers (mass, elemental, and molecular analysis), and analytical microscopes being particularly prominent. The biopharmaceutical and nutraceutical end-user verticals are leading the charge, exhibiting higher growth rates compared to the pharmaceutical sector due to the rapid expansion of biosimilars and personalized medicine development. Geographically, North America and Europe currently hold significant market shares, driven by established research infrastructure and regulatory frameworks. However, the Asia-Pacific region is projected to witness the fastest growth, fueled by rising healthcare spending and increasing investments in research and development within the life sciences sector in countries like China and India. Competitive dynamics are shaped by key players such as Waters Corporation, Bruker Corporation, Thermo Fisher Scientific, Shimadzu Scientific, and Agilent Technologies, who are continuously innovating and expanding their product portfolios to maintain their market positions.
Analytical Instrumentation in Life Science Market: A Comprehensive Report (2019-2033)
This comprehensive report provides an in-depth analysis of the Analytical Instrumentation in Life Science market, encompassing market dynamics, growth trends, regional analysis, product landscape, key drivers and barriers, emerging opportunities, and key players. The report covers the period 2019-2033, with a focus on the forecast period 2025-2033 and a base year of 2025. The parent market is the broader analytical instrumentation market, while the child market is specifically focused on life science applications. The market is segmented by type of product (Chromatographs, Spectrometer, Gas Analyzer, Liquid Analyzer, Analytical X-ray Instrumentation, Analytical Microscopes) and end-user vertical (Biopharmaceutical and Nutraceutical, Pharmaceutical). The total market size is projected to reach xx Million by 2033.
Analytical Instrumentation In Life Science Market Dynamics & Structure
The Analytical Instrumentation in Life Science market is characterized by a moderately concentrated structure, with key players such as Waters Corporation, Bruker Corporation, Thermo Fisher Scientific, Shimadzu Scientific, and Agilent Technologies holding significant market share. Technological innovation, particularly in areas like mass spectrometry and chromatography, is a primary driver. Stringent regulatory frameworks, especially concerning data integrity and quality control, significantly impact market operations. Competitive pressures from substitute technologies and emerging players are also influential. The market exhibits dynamic M&A activity, with an estimated xx number of deals annually in the historical period.
- Market Concentration: High, with top 5 players holding approximately xx% of the market share.
- Technological Innovation: Continuous advancements in sensitivity, speed, and automation drive market growth.
- Regulatory Framework: Stringent regulations related to GMP and data integrity influence market dynamics.
- Competitive Substitutes: Alternative analytical techniques pose competitive pressures, impacting market share.
- End-User Demographics: Growth is driven by the expanding biopharmaceutical and pharmaceutical sectors.
- M&A Trends: Strategic acquisitions and partnerships are common, aiming for technological expansion and market consolidation.
Analytical Instrumentation In Life Science Market Growth Trends & Insights
The Analytical Instrumentation in Life Science market has exhibited robust growth in recent years, driven by factors such as increasing R&D investments in the life sciences sector, rising demand for high-throughput screening and automation, and the increasing prevalence of chronic diseases. The market experienced a CAGR of xx% during the historical period (2019-2024) and is projected to maintain a CAGR of xx% during the forecast period (2025-2033). Technological disruptions, such as the adoption of miniaturized systems and AI-driven data analysis, are significantly impacting market growth and adoption rates. Consumer behavior shifts toward personalized medicine and precision diagnostics are creating new opportunities. Market penetration of advanced analytical techniques is increasing, with a notable surge in the adoption of mass spectrometry and liquid chromatography-mass spectrometry (LC-MS).
Dominant Regions, Countries, or Segments in Analytical Instrumentation In Life Science Market
North America currently holds the largest market share, followed by Europe and Asia-Pacific. Within North America, the United States dominates due to high R&D spending and the presence of major players. In Europe, Germany and the UK are key markets. The Asia-Pacific region is experiencing rapid growth, driven by increased healthcare spending in countries like China and India.
By Product Type: Mass spectrometers hold the largest market share due to their versatility and sensitivity.
By End-User Vertical: The biopharmaceutical and pharmaceutical sectors are the major contributors to market growth, fueled by rising drug development activities and stringent regulatory compliance needs.
Key Drivers: High R&D investments in life sciences, stringent regulatory requirements, growing demand for personalized medicine, technological advancements.
North America Dominance: Strong presence of major players, high R&D spending, and well-established healthcare infrastructure.
Europe's Significant Contribution: Presence of established pharmaceutical companies and a robust regulatory environment.
Asia-Pacific's Rapid Growth: Increasing healthcare spending, a growing middle class, and government initiatives supporting the life sciences sector.
Analytical Instrumentation In Life Science Market Product Landscape
The market offers a diverse range of analytical instruments, each with unique capabilities and applications. Innovations focus on enhancing sensitivity, resolution, speed, and automation. Advanced features like AI-driven data analysis, miniaturization, and improved user interfaces are driving market demand. Unique selling propositions include improved workflow efficiency, reduced operational costs, and enhanced data quality. Technological advancements in mass spectrometry, chromatography, and spectroscopy are continuously shaping the product landscape.
Key Drivers, Barriers & Challenges in Analytical Instrumentation In Life Science Market
Key Drivers: Increasing R&D investments in pharmaceuticals and biotechnology, stringent regulatory requirements driving quality control, the growing need for high-throughput screening and automation, advancements in mass spectrometry and chromatography, and a rising demand for personalized medicine and diagnostics.
Challenges & Restraints: High initial investment costs for advanced instruments, complex instrument maintenance, stringent regulatory requirements impacting market access, skilled labor shortages, and competitive pressures from emerging technologies and players. The market experienced a xx% decrease in sales in 2020 due to the initial impact of the COVID-19 pandemic, highlighting the vulnerability of supply chains.
Emerging Opportunities in Analytical Instrumentation In Life Science Market
Emerging opportunities lie in the growing adoption of point-of-care diagnostics, the development of portable and miniaturized analytical instruments, the integration of AI and machine learning for data analysis, and the expansion into emerging markets with increasing healthcare spending. The development of novel analytical techniques for biomarker discovery and personalized medicine offers significant growth potential. Untapped markets exist in the developing economies of Asia, Africa, and Latin America.
Growth Accelerators in the Analytical Instrumentation In Life Science Market Industry
Technological advancements, strategic partnerships, and government initiatives to support the life sciences sector are key growth accelerators. Continuous innovation in analytical techniques, such as the development of highly sensitive mass spectrometry methods, is driving market expansion. Strategic collaborations between instrument manufacturers and life science companies are fostering the development of novel applications. Government investments in healthcare infrastructure and research programs create favorable market conditions.
Key Players Shaping the Analytical Instrumentation In Life Science Market Market
- Waters Corporation
- Bruker Corporation
- Thermo Fisher Scientific
- Shimadzu Scientific
- Agilent Technologies
Notable Milestones in Analytical Instrumentation In Life Science Market Sector
- March 2023: The UK government's GBP 277 million (USD 350.19 million) investment in life sciences manufacturing projects signals a commitment to strengthening the UK's life science sector.
- March 2023: India's increased investment in healthcare infrastructure and R&D, coupled with the government's new pharmaceutical program, creates opportunities for analytical instrumentation providers.
- 2022: India's focus on building a national digital health ecosystem paves the way for the integration of digital technologies with analytical instrumentation.
In-Depth Analytical Instrumentation In Life Science Market Market Outlook
The Analytical Instrumentation in Life Science market is poised for sustained growth, driven by ongoing technological advancements, increasing R&D investments, and the rising demand for advanced analytical solutions in the pharmaceutical, biopharmaceutical, and clinical diagnostic sectors. Strategic partnerships, geographic expansion, and the development of innovative applications will be key to capturing market share and driving long-term growth. The market offers attractive opportunities for both established players and new entrants who can successfully navigate the regulatory landscape and leverage emerging technologies.
Analytical Instrumentation In Life Science Market Segmentation
-
1. Type of Product
- 1.1. Chromatographs
- 1.2. Spectrom
- 1.3. Gas Analyzer
- 1.4. Liquid Analyzer
- 1.5. Analytic
-
2. End User Vertical
- 2.1. Biopharmaceutical and Nutraceutical
- 2.2. Pharmaceutical
Analytical Instrumentation In Life Science Market Segmentation By Geography
- 1. North America
- 2. Europe
- 3. Asia Pacific
- 4. Rest of the World
Analytical Instrumentation In Life Science Market REPORT HIGHLIGHTS
| Aspects | Details |
|---|---|
| Study Period | 2019-2033 |
| Base Year | 2024 |
| Estimated Year | 2025 |
| Forecast Period | 2025-2033 |
| Historical Period | 2019-2024 |
| Growth Rate | CAGR of 8.80% from 2019-2033 |
| Segmentation |
|
Table of Contents
- 1. Introduction
- 1.1. Research Scope
- 1.2. Market Segmentation
- 1.3. Research Methodology
- 1.4. Definitions and Assumptions
- 2. Executive Summary
- 2.1. Introduction
- 3. Market Dynamics
- 3.1. Introduction
- 3.2. Market Drivers
- 3.2.1. Surge in demand of Analytical Instrumentation in Pharmaceutical Industry; Government support and incentives
- 3.3. Market Restrains
- 3.3.1. High Initial Cost
- 3.4. Market Trends
- 3.4.1. Pharmaceutical Industry to Grow with Significant Growth Rate
- 4. Market Factor Analysis
- 4.1. Porters Five Forces
- 4.2. Supply/Value Chain
- 4.3. PESTEL analysis
- 4.4. Market Entropy
- 4.5. Patent/Trademark Analysis
- 5. Global Analytical Instrumentation In Life Science Market Analysis, Insights and Forecast, 2019-2031
- 5.1. Market Analysis, Insights and Forecast - by Type of Product
- 5.1.1. Chromatographs
- 5.1.2. Spectrom
- 5.1.3. Gas Analyzer
- 5.1.4. Liquid Analyzer
- 5.1.5. Analytic
- 5.2. Market Analysis, Insights and Forecast - by End User Vertical
- 5.2.1. Biopharmaceutical and Nutraceutical
- 5.2.2. Pharmaceutical
- 5.3. Market Analysis, Insights and Forecast - by Region
- 5.3.1. North America
- 5.3.2. Europe
- 5.3.3. Asia Pacific
- 5.3.4. Rest of the World
- 5.1. Market Analysis, Insights and Forecast - by Type of Product
- 6. North America Analytical Instrumentation In Life Science Market Analysis, Insights and Forecast, 2019-2031
- 6.1. Market Analysis, Insights and Forecast - by Type of Product
- 6.1.1. Chromatographs
- 6.1.2. Spectrom
- 6.1.3. Gas Analyzer
- 6.1.4. Liquid Analyzer
- 6.1.5. Analytic
- 6.2. Market Analysis, Insights and Forecast - by End User Vertical
- 6.2.1. Biopharmaceutical and Nutraceutical
- 6.2.2. Pharmaceutical
- 6.1. Market Analysis, Insights and Forecast - by Type of Product
- 7. Europe Analytical Instrumentation In Life Science Market Analysis, Insights and Forecast, 2019-2031
- 7.1. Market Analysis, Insights and Forecast - by Type of Product
- 7.1.1. Chromatographs
- 7.1.2. Spectrom
- 7.1.3. Gas Analyzer
- 7.1.4. Liquid Analyzer
- 7.1.5. Analytic
- 7.2. Market Analysis, Insights and Forecast - by End User Vertical
- 7.2.1. Biopharmaceutical and Nutraceutical
- 7.2.2. Pharmaceutical
- 7.1. Market Analysis, Insights and Forecast - by Type of Product
- 8. Asia Pacific Analytical Instrumentation In Life Science Market Analysis, Insights and Forecast, 2019-2031
- 8.1. Market Analysis, Insights and Forecast - by Type of Product
- 8.1.1. Chromatographs
- 8.1.2. Spectrom
- 8.1.3. Gas Analyzer
- 8.1.4. Liquid Analyzer
- 8.1.5. Analytic
- 8.2. Market Analysis, Insights and Forecast - by End User Vertical
- 8.2.1. Biopharmaceutical and Nutraceutical
- 8.2.2. Pharmaceutical
- 8.1. Market Analysis, Insights and Forecast - by Type of Product
- 9. Rest of the World Analytical Instrumentation In Life Science Market Analysis, Insights and Forecast, 2019-2031
- 9.1. Market Analysis, Insights and Forecast - by Type of Product
- 9.1.1. Chromatographs
- 9.1.2. Spectrom
- 9.1.3. Gas Analyzer
- 9.1.4. Liquid Analyzer
- 9.1.5. Analytic
- 9.2. Market Analysis, Insights and Forecast - by End User Vertical
- 9.2.1. Biopharmaceutical and Nutraceutical
- 9.2.2. Pharmaceutical
- 9.1. Market Analysis, Insights and Forecast - by Type of Product
- 10. North America Analytical Instrumentation In Life Science Market Analysis, Insights and Forecast, 2019-2031
- 10.1. Market Analysis, Insights and Forecast - By Country/Sub-region
- 10.1.1 United States
- 10.1.2 Canada
- 10.1.3 Mexico
- 11. Europe Analytical Instrumentation In Life Science Market Analysis, Insights and Forecast, 2019-2031
- 11.1. Market Analysis, Insights and Forecast - By Country/Sub-region
- 11.1.1 Germany
- 11.1.2 United Kingdom
- 11.1.3 France
- 11.1.4 Spain
- 11.1.5 Italy
- 11.1.6 Spain
- 11.1.7 Belgium
- 11.1.8 Netherland
- 11.1.9 Nordics
- 11.1.10 Rest of Europe
- 12. Asia Pacific Analytical Instrumentation In Life Science Market Analysis, Insights and Forecast, 2019-2031
- 12.1. Market Analysis, Insights and Forecast - By Country/Sub-region
- 12.1.1 China
- 12.1.2 Japan
- 12.1.3 India
- 12.1.4 South Korea
- 12.1.5 Southeast Asia
- 12.1.6 Australia
- 12.1.7 Indonesia
- 12.1.8 Phillipes
- 12.1.9 Singapore
- 12.1.10 Thailandc
- 12.1.11 Rest of Asia Pacific
- 13. South America Analytical Instrumentation In Life Science Market Analysis, Insights and Forecast, 2019-2031
- 13.1. Market Analysis, Insights and Forecast - By Country/Sub-region
- 13.1.1 Brazil
- 13.1.2 Argentina
- 13.1.3 Peru
- 13.1.4 Chile
- 13.1.5 Colombia
- 13.1.6 Ecuador
- 13.1.7 Venezuela
- 13.1.8 Rest of South America
- 14. North America Analytical Instrumentation In Life Science Market Analysis, Insights and Forecast, 2019-2031
- 14.1. Market Analysis, Insights and Forecast - By Country/Sub-region
- 14.1.1 United States
- 14.1.2 Canada
- 14.1.3 Mexico
- 15. MEA Analytical Instrumentation In Life Science Market Analysis, Insights and Forecast, 2019-2031
- 15.1. Market Analysis, Insights and Forecast - By Country/Sub-region
- 15.1.1 United Arab Emirates
- 15.1.2 Saudi Arabia
- 15.1.3 South Africa
- 15.1.4 Rest of Middle East and Africa
- 16. Competitive Analysis
- 16.1. Global Market Share Analysis 2024
- 16.2. Company Profiles
- 16.2.1 Waters Corporation
- 16.2.1.1. Overview
- 16.2.1.2. Products
- 16.2.1.3. SWOT Analysis
- 16.2.1.4. Recent Developments
- 16.2.1.5. Financials (Based on Availability)
- 16.2.2 Bruker Corporation
- 16.2.2.1. Overview
- 16.2.2.2. Products
- 16.2.2.3. SWOT Analysis
- 16.2.2.4. Recent Developments
- 16.2.2.5. Financials (Based on Availability)
- 16.2.3 Thermo Fisher Scientific
- 16.2.3.1. Overview
- 16.2.3.2. Products
- 16.2.3.3. SWOT Analysis
- 16.2.3.4. Recent Developments
- 16.2.3.5. Financials (Based on Availability)
- 16.2.4 Shimadzu Scientific
- 16.2.4.1. Overview
- 16.2.4.2. Products
- 16.2.4.3. SWOT Analysis
- 16.2.4.4. Recent Developments
- 16.2.4.5. Financials (Based on Availability)
- 16.2.5 Agilent Technologies
- 16.2.5.1. Overview
- 16.2.5.2. Products
- 16.2.5.3. SWOT Analysis
- 16.2.5.4. Recent Developments
- 16.2.5.5. Financials (Based on Availability)
- 16.2.1 Waters Corporation
List of Figures
- Figure 1: Global Analytical Instrumentation In Life Science Market Revenue Breakdown (Million, %) by Region 2024 & 2032
- Figure 2: Global Analytical Instrumentation In Life Science Market Volume Breakdown (K Unit, %) by Region 2024 & 2032
- Figure 3: North America Analytical Instrumentation In Life Science Market Revenue (Million), by Country 2024 & 2032
- Figure 4: North America Analytical Instrumentation In Life Science Market Volume (K Unit), by Country 2024 & 2032
- Figure 5: North America Analytical Instrumentation In Life Science Market Revenue Share (%), by Country 2024 & 2032
- Figure 6: North America Analytical Instrumentation In Life Science Market Volume Share (%), by Country 2024 & 2032
- Figure 7: Europe Analytical Instrumentation In Life Science Market Revenue (Million), by Country 2024 & 2032
- Figure 8: Europe Analytical Instrumentation In Life Science Market Volume (K Unit), by Country 2024 & 2032
- Figure 9: Europe Analytical Instrumentation In Life Science Market Revenue Share (%), by Country 2024 & 2032
- Figure 10: Europe Analytical Instrumentation In Life Science Market Volume Share (%), by Country 2024 & 2032
- Figure 11: Asia Pacific Analytical Instrumentation In Life Science Market Revenue (Million), by Country 2024 & 2032
- Figure 12: Asia Pacific Analytical Instrumentation In Life Science Market Volume (K Unit), by Country 2024 & 2032
- Figure 13: Asia Pacific Analytical Instrumentation In Life Science Market Revenue Share (%), by Country 2024 & 2032
- Figure 14: Asia Pacific Analytical Instrumentation In Life Science Market Volume Share (%), by Country 2024 & 2032
- Figure 15: South America Analytical Instrumentation In Life Science Market Revenue (Million), by Country 2024 & 2032
- Figure 16: South America Analytical Instrumentation In Life Science Market Volume (K Unit), by Country 2024 & 2032
- Figure 17: South America Analytical Instrumentation In Life Science Market Revenue Share (%), by Country 2024 & 2032
- Figure 18: South America Analytical Instrumentation In Life Science Market Volume Share (%), by Country 2024 & 2032
- Figure 19: North America Analytical Instrumentation In Life Science Market Revenue (Million), by Country 2024 & 2032
- Figure 20: North America Analytical Instrumentation In Life Science Market Volume (K Unit), by Country 2024 & 2032
- Figure 21: North America Analytical Instrumentation In Life Science Market Revenue Share (%), by Country 2024 & 2032
- Figure 22: North America Analytical Instrumentation In Life Science Market Volume Share (%), by Country 2024 & 2032
- Figure 23: MEA Analytical Instrumentation In Life Science Market Revenue (Million), by Country 2024 & 2032
- Figure 24: MEA Analytical Instrumentation In Life Science Market Volume (K Unit), by Country 2024 & 2032
- Figure 25: MEA Analytical Instrumentation In Life Science Market Revenue Share (%), by Country 2024 & 2032
- Figure 26: MEA Analytical Instrumentation In Life Science Market Volume Share (%), by Country 2024 & 2032
- Figure 27: North America Analytical Instrumentation In Life Science Market Revenue (Million), by Type of Product 2024 & 2032
- Figure 28: North America Analytical Instrumentation In Life Science Market Volume (K Unit), by Type of Product 2024 & 2032
- Figure 29: North America Analytical Instrumentation In Life Science Market Revenue Share (%), by Type of Product 2024 & 2032
- Figure 30: North America Analytical Instrumentation In Life Science Market Volume Share (%), by Type of Product 2024 & 2032
- Figure 31: North America Analytical Instrumentation In Life Science Market Revenue (Million), by End User Vertical 2024 & 2032
- Figure 32: North America Analytical Instrumentation In Life Science Market Volume (K Unit), by End User Vertical 2024 & 2032
- Figure 33: North America Analytical Instrumentation In Life Science Market Revenue Share (%), by End User Vertical 2024 & 2032
- Figure 34: North America Analytical Instrumentation In Life Science Market Volume Share (%), by End User Vertical 2024 & 2032
- Figure 35: North America Analytical Instrumentation In Life Science Market Revenue (Million), by Country 2024 & 2032
- Figure 36: North America Analytical Instrumentation In Life Science Market Volume (K Unit), by Country 2024 & 2032
- Figure 37: North America Analytical Instrumentation In Life Science Market Revenue Share (%), by Country 2024 & 2032
- Figure 38: North America Analytical Instrumentation In Life Science Market Volume Share (%), by Country 2024 & 2032
- Figure 39: Europe Analytical Instrumentation In Life Science Market Revenue (Million), by Type of Product 2024 & 2032
- Figure 40: Europe Analytical Instrumentation In Life Science Market Volume (K Unit), by Type of Product 2024 & 2032
- Figure 41: Europe Analytical Instrumentation In Life Science Market Revenue Share (%), by Type of Product 2024 & 2032
- Figure 42: Europe Analytical Instrumentation In Life Science Market Volume Share (%), by Type of Product 2024 & 2032
- Figure 43: Europe Analytical Instrumentation In Life Science Market Revenue (Million), by End User Vertical 2024 & 2032
- Figure 44: Europe Analytical Instrumentation In Life Science Market Volume (K Unit), by End User Vertical 2024 & 2032
- Figure 45: Europe Analytical Instrumentation In Life Science Market Revenue Share (%), by End User Vertical 2024 & 2032
- Figure 46: Europe Analytical Instrumentation In Life Science Market Volume Share (%), by End User Vertical 2024 & 2032
- Figure 47: Europe Analytical Instrumentation In Life Science Market Revenue (Million), by Country 2024 & 2032
- Figure 48: Europe Analytical Instrumentation In Life Science Market Volume (K Unit), by Country 2024 & 2032
- Figure 49: Europe Analytical Instrumentation In Life Science Market Revenue Share (%), by Country 2024 & 2032
- Figure 50: Europe Analytical Instrumentation In Life Science Market Volume Share (%), by Country 2024 & 2032
- Figure 51: Asia Pacific Analytical Instrumentation In Life Science Market Revenue (Million), by Type of Product 2024 & 2032
- Figure 52: Asia Pacific Analytical Instrumentation In Life Science Market Volume (K Unit), by Type of Product 2024 & 2032
- Figure 53: Asia Pacific Analytical Instrumentation In Life Science Market Revenue Share (%), by Type of Product 2024 & 2032
- Figure 54: Asia Pacific Analytical Instrumentation In Life Science Market Volume Share (%), by Type of Product 2024 & 2032
- Figure 55: Asia Pacific Analytical Instrumentation In Life Science Market Revenue (Million), by End User Vertical 2024 & 2032
- Figure 56: Asia Pacific Analytical Instrumentation In Life Science Market Volume (K Unit), by End User Vertical 2024 & 2032
- Figure 57: Asia Pacific Analytical Instrumentation In Life Science Market Revenue Share (%), by End User Vertical 2024 & 2032
- Figure 58: Asia Pacific Analytical Instrumentation In Life Science Market Volume Share (%), by End User Vertical 2024 & 2032
- Figure 59: Asia Pacific Analytical Instrumentation In Life Science Market Revenue (Million), by Country 2024 & 2032
- Figure 60: Asia Pacific Analytical Instrumentation In Life Science Market Volume (K Unit), by Country 2024 & 2032
- Figure 61: Asia Pacific Analytical Instrumentation In Life Science Market Revenue Share (%), by Country 2024 & 2032
- Figure 62: Asia Pacific Analytical Instrumentation In Life Science Market Volume Share (%), by Country 2024 & 2032
- Figure 63: Rest of the World Analytical Instrumentation In Life Science Market Revenue (Million), by Type of Product 2024 & 2032
- Figure 64: Rest of the World Analytical Instrumentation In Life Science Market Volume (K Unit), by Type of Product 2024 & 2032
- Figure 65: Rest of the World Analytical Instrumentation In Life Science Market Revenue Share (%), by Type of Product 2024 & 2032
- Figure 66: Rest of the World Analytical Instrumentation In Life Science Market Volume Share (%), by Type of Product 2024 & 2032
- Figure 67: Rest of the World Analytical Instrumentation In Life Science Market Revenue (Million), by End User Vertical 2024 & 2032
- Figure 68: Rest of the World Analytical Instrumentation In Life Science Market Volume (K Unit), by End User Vertical 2024 & 2032
- Figure 69: Rest of the World Analytical Instrumentation In Life Science Market Revenue Share (%), by End User Vertical 2024 & 2032
- Figure 70: Rest of the World Analytical Instrumentation In Life Science Market Volume Share (%), by End User Vertical 2024 & 2032
- Figure 71: Rest of the World Analytical Instrumentation In Life Science Market Revenue (Million), by Country 2024 & 2032
- Figure 72: Rest of the World Analytical Instrumentation In Life Science Market Volume (K Unit), by Country 2024 & 2032
- Figure 73: Rest of the World Analytical Instrumentation In Life Science Market Revenue Share (%), by Country 2024 & 2032
- Figure 74: Rest of the World Analytical Instrumentation In Life Science Market Volume Share (%), by Country 2024 & 2032
List of Tables
- Table 1: Global Analytical Instrumentation In Life Science Market Revenue Million Forecast, by Region 2019 & 2032
- Table 2: Global Analytical Instrumentation In Life Science Market Volume K Unit Forecast, by Region 2019 & 2032
- Table 3: Global Analytical Instrumentation In Life Science Market Revenue Million Forecast, by Type of Product 2019 & 2032
- Table 4: Global Analytical Instrumentation In Life Science Market Volume K Unit Forecast, by Type of Product 2019 & 2032
- Table 5: Global Analytical Instrumentation In Life Science Market Revenue Million Forecast, by End User Vertical 2019 & 2032
- Table 6: Global Analytical Instrumentation In Life Science Market Volume K Unit Forecast, by End User Vertical 2019 & 2032
- Table 7: Global Analytical Instrumentation In Life Science Market Revenue Million Forecast, by Region 2019 & 2032
- Table 8: Global Analytical Instrumentation In Life Science Market Volume K Unit Forecast, by Region 2019 & 2032
- Table 9: Global Analytical Instrumentation In Life Science Market Revenue Million Forecast, by Country 2019 & 2032
- Table 10: Global Analytical Instrumentation In Life Science Market Volume K Unit Forecast, by Country 2019 & 2032
- Table 11: United States Analytical Instrumentation In Life Science Market Revenue (Million) Forecast, by Application 2019 & 2032
- Table 12: United States Analytical Instrumentation In Life Science Market Volume (K Unit) Forecast, by Application 2019 & 2032
- Table 13: Canada Analytical Instrumentation In Life Science Market Revenue (Million) Forecast, by Application 2019 & 2032
- Table 14: Canada Analytical Instrumentation In Life Science Market Volume (K Unit) Forecast, by Application 2019 & 2032
- Table 15: Mexico Analytical Instrumentation In Life Science Market Revenue (Million) Forecast, by Application 2019 & 2032
- Table 16: Mexico Analytical Instrumentation In Life Science Market Volume (K Unit) Forecast, by Application 2019 & 2032
- Table 17: Global Analytical Instrumentation In Life Science Market Revenue Million Forecast, by Country 2019 & 2032
- Table 18: Global Analytical Instrumentation In Life Science Market Volume K Unit Forecast, by Country 2019 & 2032
- Table 19: Germany Analytical Instrumentation In Life Science Market Revenue (Million) Forecast, by Application 2019 & 2032
- Table 20: Germany Analytical Instrumentation In Life Science Market Volume (K Unit) Forecast, by Application 2019 & 2032
- Table 21: United Kingdom Analytical Instrumentation In Life Science Market Revenue (Million) Forecast, by Application 2019 & 2032
- Table 22: United Kingdom Analytical Instrumentation In Life Science Market Volume (K Unit) Forecast, by Application 2019 & 2032
- Table 23: France Analytical Instrumentation In Life Science Market Revenue (Million) Forecast, by Application 2019 & 2032
- Table 24: France Analytical Instrumentation In Life Science Market Volume (K Unit) Forecast, by Application 2019 & 2032
- Table 25: Spain Analytical Instrumentation In Life Science Market Revenue (Million) Forecast, by Application 2019 & 2032
- Table 26: Spain Analytical Instrumentation In Life Science Market Volume (K Unit) Forecast, by Application 2019 & 2032
- Table 27: Italy Analytical Instrumentation In Life Science Market Revenue (Million) Forecast, by Application 2019 & 2032
- Table 28: Italy Analytical Instrumentation In Life Science Market Volume (K Unit) Forecast, by Application 2019 & 2032
- Table 29: Spain Analytical Instrumentation In Life Science Market Revenue (Million) Forecast, by Application 2019 & 2032
- Table 30: Spain Analytical Instrumentation In Life Science Market Volume (K Unit) Forecast, by Application 2019 & 2032
- Table 31: Belgium Analytical Instrumentation In Life Science Market Revenue (Million) Forecast, by Application 2019 & 2032
- Table 32: Belgium Analytical Instrumentation In Life Science Market Volume (K Unit) Forecast, by Application 2019 & 2032
- Table 33: Netherland Analytical Instrumentation In Life Science Market Revenue (Million) Forecast, by Application 2019 & 2032
- Table 34: Netherland Analytical Instrumentation In Life Science Market Volume (K Unit) Forecast, by Application 2019 & 2032
- Table 35: Nordics Analytical Instrumentation In Life Science Market Revenue (Million) Forecast, by Application 2019 & 2032
- Table 36: Nordics Analytical Instrumentation In Life Science Market Volume (K Unit) Forecast, by Application 2019 & 2032
- Table 37: Rest of Europe Analytical Instrumentation In Life Science Market Revenue (Million) Forecast, by Application 2019 & 2032
- Table 38: Rest of Europe Analytical Instrumentation In Life Science Market Volume (K Unit) Forecast, by Application 2019 & 2032
- Table 39: Global Analytical Instrumentation In Life Science Market Revenue Million Forecast, by Country 2019 & 2032
- Table 40: Global Analytical Instrumentation In Life Science Market Volume K Unit Forecast, by Country 2019 & 2032
- Table 41: China Analytical Instrumentation In Life Science Market Revenue (Million) Forecast, by Application 2019 & 2032
- Table 42: China Analytical Instrumentation In Life Science Market Volume (K Unit) Forecast, by Application 2019 & 2032
- Table 43: Japan Analytical Instrumentation In Life Science Market Revenue (Million) Forecast, by Application 2019 & 2032
- Table 44: Japan Analytical Instrumentation In Life Science Market Volume (K Unit) Forecast, by Application 2019 & 2032
- Table 45: India Analytical Instrumentation In Life Science Market Revenue (Million) Forecast, by Application 2019 & 2032
- Table 46: India Analytical Instrumentation In Life Science Market Volume (K Unit) Forecast, by Application 2019 & 2032
- Table 47: South Korea Analytical Instrumentation In Life Science Market Revenue (Million) Forecast, by Application 2019 & 2032
- Table 48: South Korea Analytical Instrumentation In Life Science Market Volume (K Unit) Forecast, by Application 2019 & 2032
- Table 49: Southeast Asia Analytical Instrumentation In Life Science Market Revenue (Million) Forecast, by Application 2019 & 2032
- Table 50: Southeast Asia Analytical Instrumentation In Life Science Market Volume (K Unit) Forecast, by Application 2019 & 2032
- Table 51: Australia Analytical Instrumentation In Life Science Market Revenue (Million) Forecast, by Application 2019 & 2032
- Table 52: Australia Analytical Instrumentation In Life Science Market Volume (K Unit) Forecast, by Application 2019 & 2032
- Table 53: Indonesia Analytical Instrumentation In Life Science Market Revenue (Million) Forecast, by Application 2019 & 2032
- Table 54: Indonesia Analytical Instrumentation In Life Science Market Volume (K Unit) Forecast, by Application 2019 & 2032
- Table 55: Phillipes Analytical Instrumentation In Life Science Market Revenue (Million) Forecast, by Application 2019 & 2032
- Table 56: Phillipes Analytical Instrumentation In Life Science Market Volume (K Unit) Forecast, by Application 2019 & 2032
- Table 57: Singapore Analytical Instrumentation In Life Science Market Revenue (Million) Forecast, by Application 2019 & 2032
- Table 58: Singapore Analytical Instrumentation In Life Science Market Volume (K Unit) Forecast, by Application 2019 & 2032
- Table 59: Thailandc Analytical Instrumentation In Life Science Market Revenue (Million) Forecast, by Application 2019 & 2032
- Table 60: Thailandc Analytical Instrumentation In Life Science Market Volume (K Unit) Forecast, by Application 2019 & 2032
- Table 61: Rest of Asia Pacific Analytical Instrumentation In Life Science Market Revenue (Million) Forecast, by Application 2019 & 2032
- Table 62: Rest of Asia Pacific Analytical Instrumentation In Life Science Market Volume (K Unit) Forecast, by Application 2019 & 2032
- Table 63: Global Analytical Instrumentation In Life Science Market Revenue Million Forecast, by Country 2019 & 2032
- Table 64: Global Analytical Instrumentation In Life Science Market Volume K Unit Forecast, by Country 2019 & 2032
- Table 65: Brazil Analytical Instrumentation In Life Science Market Revenue (Million) Forecast, by Application 2019 & 2032
- Table 66: Brazil Analytical Instrumentation In Life Science Market Volume (K Unit) Forecast, by Application 2019 & 2032
- Table 67: Argentina Analytical Instrumentation In Life Science Market Revenue (Million) Forecast, by Application 2019 & 2032
- Table 68: Argentina Analytical Instrumentation In Life Science Market Volume (K Unit) Forecast, by Application 2019 & 2032
- Table 69: Peru Analytical Instrumentation In Life Science Market Revenue (Million) Forecast, by Application 2019 & 2032
- Table 70: Peru Analytical Instrumentation In Life Science Market Volume (K Unit) Forecast, by Application 2019 & 2032
- Table 71: Chile Analytical Instrumentation In Life Science Market Revenue (Million) Forecast, by Application 2019 & 2032
- Table 72: Chile Analytical Instrumentation In Life Science Market Volume (K Unit) Forecast, by Application 2019 & 2032
- Table 73: Colombia Analytical Instrumentation In Life Science Market Revenue (Million) Forecast, by Application 2019 & 2032
- Table 74: Colombia Analytical Instrumentation In Life Science Market Volume (K Unit) Forecast, by Application 2019 & 2032
- Table 75: Ecuador Analytical Instrumentation In Life Science Market Revenue (Million) Forecast, by Application 2019 & 2032
- Table 76: Ecuador Analytical Instrumentation In Life Science Market Volume (K Unit) Forecast, by Application 2019 & 2032
- Table 77: Venezuela Analytical Instrumentation In Life Science Market Revenue (Million) Forecast, by Application 2019 & 2032
- Table 78: Venezuela Analytical Instrumentation In Life Science Market Volume (K Unit) Forecast, by Application 2019 & 2032
- Table 79: Rest of South America Analytical Instrumentation In Life Science Market Revenue (Million) Forecast, by Application 2019 & 2032
- Table 80: Rest of South America Analytical Instrumentation In Life Science Market Volume (K Unit) Forecast, by Application 2019 & 2032
- Table 81: Global Analytical Instrumentation In Life Science Market Revenue Million Forecast, by Country 2019 & 2032
- Table 82: Global Analytical Instrumentation In Life Science Market Volume K Unit Forecast, by Country 2019 & 2032
- Table 83: United States Analytical Instrumentation In Life Science Market Revenue (Million) Forecast, by Application 2019 & 2032
- Table 84: United States Analytical Instrumentation In Life Science Market Volume (K Unit) Forecast, by Application 2019 & 2032
- Table 85: Canada Analytical Instrumentation In Life Science Market Revenue (Million) Forecast, by Application 2019 & 2032
- Table 86: Canada Analytical Instrumentation In Life Science Market Volume (K Unit) Forecast, by Application 2019 & 2032
- Table 87: Mexico Analytical Instrumentation In Life Science Market Revenue (Million) Forecast, by Application 2019 & 2032
- Table 88: Mexico Analytical Instrumentation In Life Science Market Volume (K Unit) Forecast, by Application 2019 & 2032
- Table 89: Global Analytical Instrumentation In Life Science Market Revenue Million Forecast, by Country 2019 & 2032
- Table 90: Global Analytical Instrumentation In Life Science Market Volume K Unit Forecast, by Country 2019 & 2032
- Table 91: United Arab Emirates Analytical Instrumentation In Life Science Market Revenue (Million) Forecast, by Application 2019 & 2032
- Table 92: United Arab Emirates Analytical Instrumentation In Life Science Market Volume (K Unit) Forecast, by Application 2019 & 2032
- Table 93: Saudi Arabia Analytical Instrumentation In Life Science Market Revenue (Million) Forecast, by Application 2019 & 2032
- Table 94: Saudi Arabia Analytical Instrumentation In Life Science Market Volume (K Unit) Forecast, by Application 2019 & 2032
- Table 95: South Africa Analytical Instrumentation In Life Science Market Revenue (Million) Forecast, by Application 2019 & 2032
- Table 96: South Africa Analytical Instrumentation In Life Science Market Volume (K Unit) Forecast, by Application 2019 & 2032
- Table 97: Rest of Middle East and Africa Analytical Instrumentation In Life Science Market Revenue (Million) Forecast, by Application 2019 & 2032
- Table 98: Rest of Middle East and Africa Analytical Instrumentation In Life Science Market Volume (K Unit) Forecast, by Application 2019 & 2032
- Table 99: Global Analytical Instrumentation In Life Science Market Revenue Million Forecast, by Type of Product 2019 & 2032
- Table 100: Global Analytical Instrumentation In Life Science Market Volume K Unit Forecast, by Type of Product 2019 & 2032
- Table 101: Global Analytical Instrumentation In Life Science Market Revenue Million Forecast, by End User Vertical 2019 & 2032
- Table 102: Global Analytical Instrumentation In Life Science Market Volume K Unit Forecast, by End User Vertical 2019 & 2032
- Table 103: Global Analytical Instrumentation In Life Science Market Revenue Million Forecast, by Country 2019 & 2032
- Table 104: Global Analytical Instrumentation In Life Science Market Volume K Unit Forecast, by Country 2019 & 2032
- Table 105: Global Analytical Instrumentation In Life Science Market Revenue Million Forecast, by Type of Product 2019 & 2032
- Table 106: Global Analytical Instrumentation In Life Science Market Volume K Unit Forecast, by Type of Product 2019 & 2032
- Table 107: Global Analytical Instrumentation In Life Science Market Revenue Million Forecast, by End User Vertical 2019 & 2032
- Table 108: Global Analytical Instrumentation In Life Science Market Volume K Unit Forecast, by End User Vertical 2019 & 2032
- Table 109: Global Analytical Instrumentation In Life Science Market Revenue Million Forecast, by Country 2019 & 2032
- Table 110: Global Analytical Instrumentation In Life Science Market Volume K Unit Forecast, by Country 2019 & 2032
- Table 111: Global Analytical Instrumentation In Life Science Market Revenue Million Forecast, by Type of Product 2019 & 2032
- Table 112: Global Analytical Instrumentation In Life Science Market Volume K Unit Forecast, by Type of Product 2019 & 2032
- Table 113: Global Analytical Instrumentation In Life Science Market Revenue Million Forecast, by End User Vertical 2019 & 2032
- Table 114: Global Analytical Instrumentation In Life Science Market Volume K Unit Forecast, by End User Vertical 2019 & 2032
- Table 115: Global Analytical Instrumentation In Life Science Market Revenue Million Forecast, by Country 2019 & 2032
- Table 116: Global Analytical Instrumentation In Life Science Market Volume K Unit Forecast, by Country 2019 & 2032
- Table 117: Global Analytical Instrumentation In Life Science Market Revenue Million Forecast, by Type of Product 2019 & 2032
- Table 118: Global Analytical Instrumentation In Life Science Market Volume K Unit Forecast, by Type of Product 2019 & 2032
- Table 119: Global Analytical Instrumentation In Life Science Market Revenue Million Forecast, by End User Vertical 2019 & 2032
- Table 120: Global Analytical Instrumentation In Life Science Market Volume K Unit Forecast, by End User Vertical 2019 & 2032
- Table 121: Global Analytical Instrumentation In Life Science Market Revenue Million Forecast, by Country 2019 & 2032
- Table 122: Global Analytical Instrumentation In Life Science Market Volume K Unit Forecast, by Country 2019 & 2032
Frequently Asked Questions
1. What is the projected Compound Annual Growth Rate (CAGR) of the Analytical Instrumentation In Life Science Market?
The projected CAGR is approximately 8.80%.
2. Which companies are prominent players in the Analytical Instrumentation In Life Science Market?
Key companies in the market include Waters Corporation, Bruker Corporation, Thermo Fisher Scientific, Shimadzu Scientific, Agilent Technologies.
3. What are the main segments of the Analytical Instrumentation In Life Science Market?
The market segments include Type of Product, End User Vertical.
4. Can you provide details about the market size?
The market size is estimated to be USD 18.80 Million as of 2022.
5. What are some drivers contributing to market growth?
Surge in demand of Analytical Instrumentation in Pharmaceutical Industry; Government support and incentives.
6. What are the notable trends driving market growth?
Pharmaceutical Industry to Grow with Significant Growth Rate.
7. Are there any restraints impacting market growth?
High Initial Cost.
8. Can you provide examples of recent developments in the market?
March 2023 - The COVID-19 pandemic increased investment in India's healthcare infrastructure and research and development. The government of India announced in Budget 2022 that the country focused on building a national digital health ecosystem. In Union Budget 2023, the Government of India announced a new pharmaceutical program and further collaborations for private and public medical faculties and private research and development teams.
9. What pricing options are available for accessing the report?
Pricing options include single-user, multi-user, and enterprise licenses priced at USD 4750, USD 5250, and USD 8750 respectively.
10. Is the market size provided in terms of value or volume?
The market size is provided in terms of value, measured in Million and volume, measured in K Unit.
11. Are there any specific market keywords associated with the report?
Yes, the market keyword associated with the report is "Analytical Instrumentation In Life Science Market," which aids in identifying and referencing the specific market segment covered.
12. How do I determine which pricing option suits my needs best?
The pricing options vary based on user requirements and access needs. Individual users may opt for single-user licenses, while businesses requiring broader access may choose multi-user or enterprise licenses for cost-effective access to the report.
13. Are there any additional resources or data provided in the Analytical Instrumentation In Life Science Market report?
While the report offers comprehensive insights, it's advisable to review the specific contents or supplementary materials provided to ascertain if additional resources or data are available.
14. How can I stay updated on further developments or reports in the Analytical Instrumentation In Life Science Market?
To stay informed about further developments, trends, and reports in the Analytical Instrumentation In Life Science Market, consider subscribing to industry newsletters, following relevant companies and organizations, or regularly checking reputable industry news sources and publications.
Methodology
Step 1 - Identification of Relevant Samples Size from Population Database


Step 2 - Approaches for Defining Global Market Size (Value, Volume* & Price*)

Note*: In applicable scenarios
Step 3 - Data Sources
Primary Research
- Web Analytics
- Survey Reports
- Research Institute
- Latest Research Reports
- Opinion Leaders
Secondary Research
- Annual Reports
- White Paper
- Latest Press Release
- Industry Association
- Paid Database
- Investor Presentations

Step 4 - Data Triangulation
Involves using different sources of information in order to increase the validity of a study
These sources are likely to be stakeholders in a program - participants, other researchers, program staff, other community members, and so on.
Then we put all data in single framework & apply various statistical tools to find out the dynamic on the market.
During the analysis stage, feedback from the stakeholder groups would be compared to determine areas of agreement as well as areas of divergence


