
Key Insights
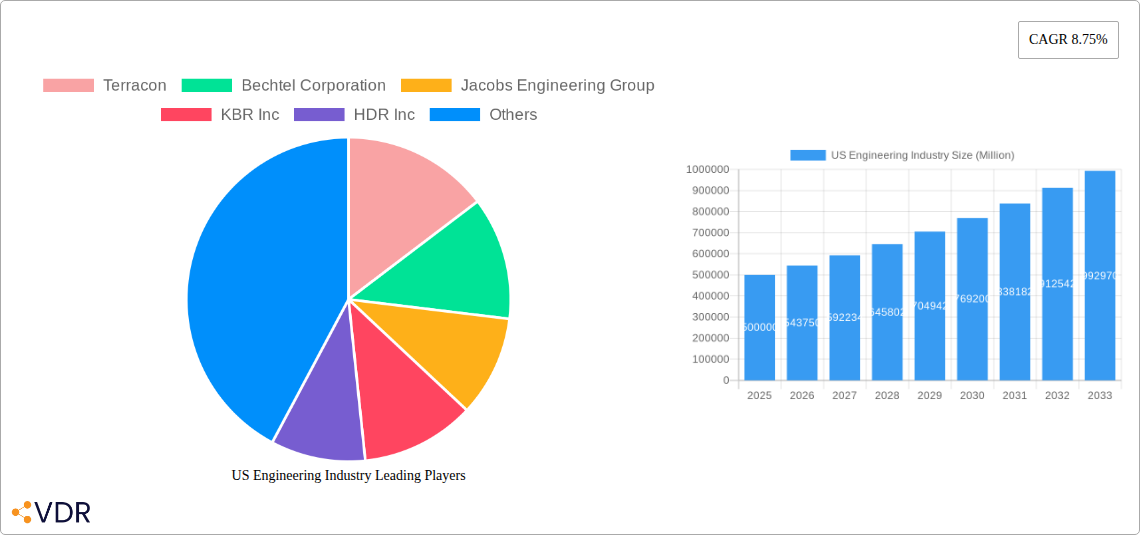
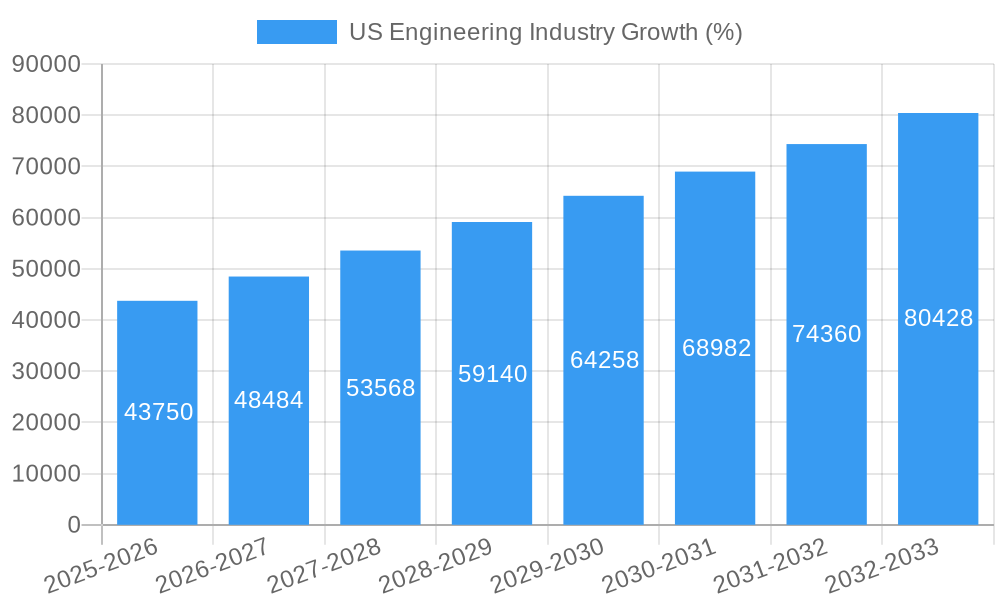
The US engineering industry, a cornerstone of national infrastructure and technological advancement, is experiencing robust growth, projected to maintain a Compound Annual Growth Rate (CAGR) of 8.75% from 2025 to 2033. This expansion is fueled by several key drivers. Significant investments in infrastructure development, spurred by government initiatives and private sector projects, are creating substantial demand for engineering services across various sectors. Furthermore, the increasing adoption of advanced technologies like Building Information Modeling (BIM) and Artificial Intelligence (AI) in engineering design and construction is enhancing efficiency and driving innovation, thus contributing to market growth. The burgeoning renewable energy sector, particularly in wind and solar power, is further stimulating demand for specialized engineering expertise. Finally, a growing emphasis on sustainable and resilient infrastructure design, prompted by climate change concerns, is shaping the industry’s trajectory.
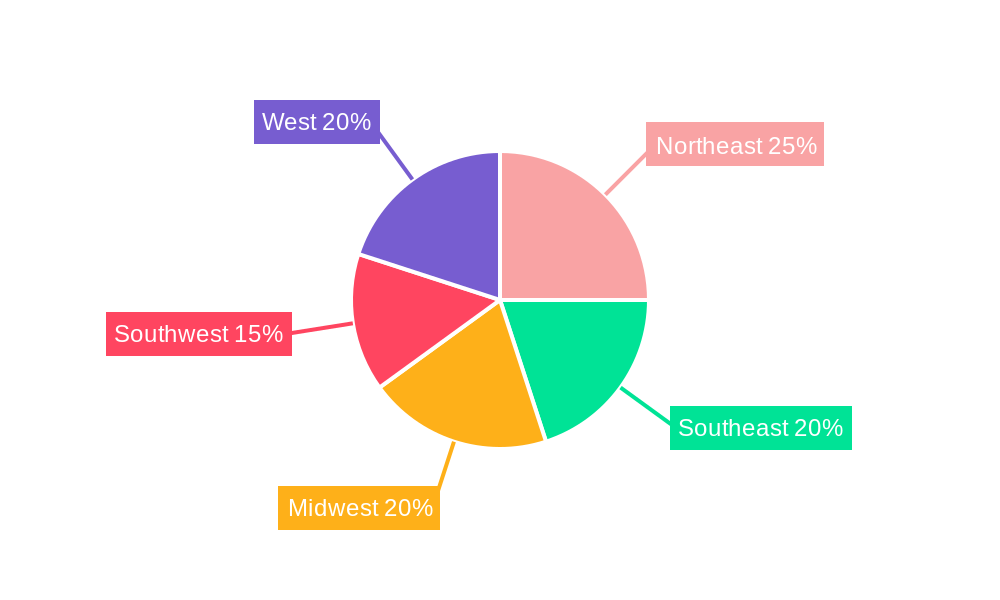
Segment-wise, the construction and oil & gas sectors currently dominate the market, but growth is anticipated across all end-user industries. The diversification of the engineering disciplines, particularly a rising demand for environmental and sustainable engineering, is another notable trend. Regionally, the West and Northeast regions are expected to lead growth due to robust infrastructure investments and a concentration of major engineering firms. While the overall growth is promising, the industry faces certain challenges, including skilled labor shortages and fluctuating commodity prices, which could potentially restrain growth in certain segments. However, the long-term outlook remains positive, driven by sustained government investment, technological advancements, and the increasing need for sustainable infrastructure solutions. The market size in 2025 is estimated at $500 billion, a figure derived from an analysis of industry reports and growth trends.
US Engineering Industry Market Report: 2019-2033
This comprehensive report provides an in-depth analysis of the US Engineering Industry, encompassing market dynamics, growth trends, key players, and future outlook. Covering the period 2019-2033, with a base year of 2025, this report is an essential resource for industry professionals, investors, and strategic planners seeking to understand and capitalize on opportunities within this dynamic sector. The report segments the market by region (West, Midwest, Northeast, South), engineering discipline (Civil, Mechanical, Electrical, Environmental), and end-user industry (Construction, Oil & Gas, Manufacturing, Utilities, Transportation, Other).
US Engineering Industry Market Dynamics & Structure
The US Engineering industry is a complex ecosystem characterized by moderate market concentration, with a few large players holding significant market share, and numerous smaller, specialized firms. The market size in 2025 is estimated at $xx million, projected to reach $xx million by 2033. Technological innovation, driven by advancements in BIM (Building Information Modeling), AI, and automation, is transforming industry practices. Stringent regulatory frameworks, including environmental regulations and building codes, significantly influence project design and execution. Competitive pressures from substitute technologies and global engineering firms are also notable factors. Mergers and acquisitions (M&A) activity is prevalent, with an estimated xx number of deals in the last 5 years, primarily driven by firms seeking to expand their service portfolios and geographic reach.
- Market Concentration: Top 10 players account for approximately xx% of the market in 2025.
- Technological Innovation: Adoption of BIM, AI, and digital twins is increasing, driving efficiency and reducing costs.
- Regulatory Framework: Compliance with environmental, safety, and building codes shapes project development.
- M&A Activity: Consolidation is occurring through strategic acquisitions and mergers, leading to increased scale and diversification.
- End-User Demographics: Growth is fueled by increasing infrastructure investments and demand from diverse sectors.
US Engineering Industry Growth Trends & Insights
The US Engineering industry experienced robust growth during the historical period (2019-2024), driven by strong demand from the construction, energy, and transportation sectors. The market exhibited a CAGR of xx% during this period. Technological disruptions, such as the adoption of advanced simulation and modeling tools, significantly improved project efficiency and accuracy. Consumer behavior shifts towards sustainability and resilience are influencing design choices and project scopes. Adoption rates of advanced technologies show steady growth with xx% of firms adopting BIM in 2025. The forecast period (2025-2033) anticipates continued growth, albeit at a slightly moderated pace, with a projected CAGR of xx%, reaching an estimated market size of $xx million by 2033. This is primarily influenced by the overall macroeconomic environment and increasing investments in public and private infrastructure projects.
Dominant Regions, Countries, or Segments in US Engineering Industry
The West region is projected to be the dominant market segment during the forecast period, driven by robust growth in the construction and technology sectors of California and other states in the West Coast. The South region will also see significant growth, primarily supported by increased energy infrastructure development and population growth. Within engineering disciplines, Civil Engineering remains the largest segment, driven by significant infrastructure projects and renewable energy investments. The Construction and Oil & Gas end-user industries are key contributors to overall market growth.
- Key Drivers: Government investments in infrastructure development (e.g., transportation, water, energy), increasing private sector investments, technological advancements, and urbanization.
- West Region Dominance: High concentration of tech companies and ongoing infrastructure projects contribute to substantial growth.
- Civil Engineering Leadership: Significant demand for infrastructure development leads to consistent growth.
- Construction and Oil & Gas Dominance: These end-user sectors contribute a significant share to market revenue.
US Engineering Industry Product Landscape
The US Engineering industry offers a wide range of services, from conceptual design to project management and construction oversight. Product innovations focus on incorporating sustainable design principles, improving project efficiency through digital tools (BIM, AI), and enhancing client collaboration. Key performance metrics include project cost, schedule adherence, safety record, and client satisfaction. Unique selling propositions for firms often include specialized expertise in specific engineering disciplines or industry sectors, and ability to leverage advanced technologies effectively.
Key Drivers, Barriers & Challenges in US Engineering Industry
Key Drivers: Government infrastructure spending, rising demand for energy infrastructure, technological advancements (BIM, AI), and increasing focus on sustainable infrastructure are key drivers of market growth.
Challenges: Supply chain disruptions caused by global events (e.g., material shortages), regulatory complexities and permitting processes, intense competition from domestic and international players, and skilled labor shortages impacting project timelines and budgets. These challenges lead to cost overruns and delays on projects. For example, material shortages in 2022 increased project costs by an estimated xx%.
Emerging Opportunities in US Engineering Industry
Emerging opportunities include the growing demand for sustainable and resilient infrastructure, particularly within smart cities and renewable energy projects. The increasing adoption of digital technologies presents opportunities for firms to optimize their services and operations and capitalize on evolving data analytics.
Growth Accelerators in the US Engineering Industry Industry
Technological breakthroughs, particularly in AI and machine learning for optimizing designs and construction processes, and strategic partnerships to leverage specialized expertise or gain access to new markets are accelerating industry growth. Expansion into high-growth markets, such as renewable energy and smart city development, further contributes to this momentum.
Key Players Shaping the US Engineering Industry Market
- Terracon
- Bechtel Corporation
- Jacobs Engineering Group
- KBR Inc
- HDR Inc
- Fluor Corporation
- Jensen Hughes
- AECOM
- Black & Veatch Holding Company
- ECS Group of Companies
Notable Milestones in US Engineering Industry Sector
- November 2021: Bechtel selected for US Navy dry dock construction project (USD xx million estimated value).
- May 2022: AECOM awarded USD 400 million contract for US Navy environmental remediation program.
In-Depth US Engineering Industry Market Outlook
The US Engineering industry is poised for continued growth, driven by sustained infrastructure investments, technological advancements, and increasing focus on sustainability. Strategic partnerships, expansion into new markets, and the adoption of innovative technologies will be key to success in this competitive landscape. The long-term market potential is significant, with ample opportunities for firms that can adapt to changing market dynamics and deliver innovative solutions.
US Engineering Industry Segmentation
-
1. Engineering Disciplines
- 1.1. Civil
- 1.2. Mechanical
- 1.3. Electrical
- 1.4. Environmental
-
2. End-user Industry
- 2.1. Construction
- 2.2. Oil & Gas
- 2.3. Manufacturing
- 2.4. Utilities
- 2.5. Transportation
- 2.6. Other End-user Industries
US Engineering Industry Segmentation By Geography
-
1. North America
- 1.1. United States
- 1.2. Canada
- 1.3. Mexico
-
2. South America
- 2.1. Brazil
- 2.2. Argentina
- 2.3. Rest of South America
-
3. Europe
- 3.1. United Kingdom
- 3.2. Germany
- 3.3. France
- 3.4. Italy
- 3.5. Spain
- 3.6. Russia
- 3.7. Benelux
- 3.8. Nordics
- 3.9. Rest of Europe
-
4. Middle East & Africa
- 4.1. Turkey
- 4.2. Israel
- 4.3. GCC
- 4.4. North Africa
- 4.5. South Africa
- 4.6. Rest of Middle East & Africa
-
5. Asia Pacific
- 5.1. China
- 5.2. India
- 5.3. Japan
- 5.4. South Korea
- 5.5. ASEAN
- 5.6. Oceania
- 5.7. Rest of Asia Pacific
US Engineering Industry REPORT HIGHLIGHTS
| Aspects | Details |
|---|---|
| Study Period | 2019-2033 |
| Base Year | 2024 |
| Estimated Year | 2025 |
| Forecast Period | 2025-2033 |
| Historical Period | 2019-2024 |
| Growth Rate | CAGR of 8.75% from 2019-2033 |
| Segmentation |
|
Table of Contents
- 1. Introduction
- 1.1. Research Scope
- 1.2. Market Segmentation
- 1.3. Research Methodology
- 1.4. Definitions and Assumptions
- 2. Executive Summary
- 2.1. Introduction
- 3. Market Dynamics
- 3.1. Introduction
- 3.2. Market Drivers
- 3.2.1. Increasing demand due to a growing private investment in large-scale projects and recovery in natural gas and oil prices likely to propel demand from industrial customers; Technological advancements have aided in reducing lead time and resource overheads
- 3.3. Market Restrains
- 3.3.1. Market susceptibility to changes in macro-environment as well as regulatory landscape
- 3.4. Market Trends
- 3.4.1. Civil Engineering Services is Expected to Register a Significant Growth
- 4. Market Factor Analysis
- 4.1. Porters Five Forces
- 4.2. Supply/Value Chain
- 4.3. PESTEL analysis
- 4.4. Market Entropy
- 4.5. Patent/Trademark Analysis
- 5. Global US Engineering Industry Analysis, Insights and Forecast, 2019-2031
- 5.1. Market Analysis, Insights and Forecast - by Engineering Disciplines
- 5.1.1. Civil
- 5.1.2. Mechanical
- 5.1.3. Electrical
- 5.1.4. Environmental
- 5.2. Market Analysis, Insights and Forecast - by End-user Industry
- 5.2.1. Construction
- 5.2.2. Oil & Gas
- 5.2.3. Manufacturing
- 5.2.4. Utilities
- 5.2.5. Transportation
- 5.2.6. Other End-user Industries
- 5.3. Market Analysis, Insights and Forecast - by Region
- 5.3.1. North America
- 5.3.2. South America
- 5.3.3. Europe
- 5.3.4. Middle East & Africa
- 5.3.5. Asia Pacific
- 5.1. Market Analysis, Insights and Forecast - by Engineering Disciplines
- 6. North America US Engineering Industry Analysis, Insights and Forecast, 2019-2031
- 6.1. Market Analysis, Insights and Forecast - by Engineering Disciplines
- 6.1.1. Civil
- 6.1.2. Mechanical
- 6.1.3. Electrical
- 6.1.4. Environmental
- 6.2. Market Analysis, Insights and Forecast - by End-user Industry
- 6.2.1. Construction
- 6.2.2. Oil & Gas
- 6.2.3. Manufacturing
- 6.2.4. Utilities
- 6.2.5. Transportation
- 6.2.6. Other End-user Industries
- 6.1. Market Analysis, Insights and Forecast - by Engineering Disciplines
- 7. South America US Engineering Industry Analysis, Insights and Forecast, 2019-2031
- 7.1. Market Analysis, Insights and Forecast - by Engineering Disciplines
- 7.1.1. Civil
- 7.1.2. Mechanical
- 7.1.3. Electrical
- 7.1.4. Environmental
- 7.2. Market Analysis, Insights and Forecast - by End-user Industry
- 7.2.1. Construction
- 7.2.2. Oil & Gas
- 7.2.3. Manufacturing
- 7.2.4. Utilities
- 7.2.5. Transportation
- 7.2.6. Other End-user Industries
- 7.1. Market Analysis, Insights and Forecast - by Engineering Disciplines
- 8. Europe US Engineering Industry Analysis, Insights and Forecast, 2019-2031
- 8.1. Market Analysis, Insights and Forecast - by Engineering Disciplines
- 8.1.1. Civil
- 8.1.2. Mechanical
- 8.1.3. Electrical
- 8.1.4. Environmental
- 8.2. Market Analysis, Insights and Forecast - by End-user Industry
- 8.2.1. Construction
- 8.2.2. Oil & Gas
- 8.2.3. Manufacturing
- 8.2.4. Utilities
- 8.2.5. Transportation
- 8.2.6. Other End-user Industries
- 8.1. Market Analysis, Insights and Forecast - by Engineering Disciplines
- 9. Middle East & Africa US Engineering Industry Analysis, Insights and Forecast, 2019-2031
- 9.1. Market Analysis, Insights and Forecast - by Engineering Disciplines
- 9.1.1. Civil
- 9.1.2. Mechanical
- 9.1.3. Electrical
- 9.1.4. Environmental
- 9.2. Market Analysis, Insights and Forecast - by End-user Industry
- 9.2.1. Construction
- 9.2.2. Oil & Gas
- 9.2.3. Manufacturing
- 9.2.4. Utilities
- 9.2.5. Transportation
- 9.2.6. Other End-user Industries
- 9.1. Market Analysis, Insights and Forecast - by Engineering Disciplines
- 10. Asia Pacific US Engineering Industry Analysis, Insights and Forecast, 2019-2031
- 10.1. Market Analysis, Insights and Forecast - by Engineering Disciplines
- 10.1.1. Civil
- 10.1.2. Mechanical
- 10.1.3. Electrical
- 10.1.4. Environmental
- 10.2. Market Analysis, Insights and Forecast - by End-user Industry
- 10.2.1. Construction
- 10.2.2. Oil & Gas
- 10.2.3. Manufacturing
- 10.2.4. Utilities
- 10.2.5. Transportation
- 10.2.6. Other End-user Industries
- 10.1. Market Analysis, Insights and Forecast - by Engineering Disciplines
- 11. Northeast US Engineering Industry Analysis, Insights and Forecast, 2019-2031
- 12. Southeast US Engineering Industry Analysis, Insights and Forecast, 2019-2031
- 13. Midwest US Engineering Industry Analysis, Insights and Forecast, 2019-2031
- 14. Southwest US Engineering Industry Analysis, Insights and Forecast, 2019-2031
- 15. West US Engineering Industry Analysis, Insights and Forecast, 2019-2031
- 16. Competitive Analysis
- 16.1. Global Market Share Analysis 2024
- 16.2. Company Profiles
- 16.2.1 Terracon
- 16.2.1.1. Overview
- 16.2.1.2. Products
- 16.2.1.3. SWOT Analysis
- 16.2.1.4. Recent Developments
- 16.2.1.5. Financials (Based on Availability)
- 16.2.2 Bechtel Corporation
- 16.2.2.1. Overview
- 16.2.2.2. Products
- 16.2.2.3. SWOT Analysis
- 16.2.2.4. Recent Developments
- 16.2.2.5. Financials (Based on Availability)
- 16.2.3 Jacobs Engineering Group
- 16.2.3.1. Overview
- 16.2.3.2. Products
- 16.2.3.3. SWOT Analysis
- 16.2.3.4. Recent Developments
- 16.2.3.5. Financials (Based on Availability)
- 16.2.4 KBR Inc
- 16.2.4.1. Overview
- 16.2.4.2. Products
- 16.2.4.3. SWOT Analysis
- 16.2.4.4. Recent Developments
- 16.2.4.5. Financials (Based on Availability)
- 16.2.5 HDR Inc
- 16.2.5.1. Overview
- 16.2.5.2. Products
- 16.2.5.3. SWOT Analysis
- 16.2.5.4. Recent Developments
- 16.2.5.5. Financials (Based on Availability)
- 16.2.6 Fluor Corporation
- 16.2.6.1. Overview
- 16.2.6.2. Products
- 16.2.6.3. SWOT Analysis
- 16.2.6.4. Recent Developments
- 16.2.6.5. Financials (Based on Availability)
- 16.2.7 Jensen Hughes
- 16.2.7.1. Overview
- 16.2.7.2. Products
- 16.2.7.3. SWOT Analysis
- 16.2.7.4. Recent Developments
- 16.2.7.5. Financials (Based on Availability)
- 16.2.8 AECOM
- 16.2.8.1. Overview
- 16.2.8.2. Products
- 16.2.8.3. SWOT Analysis
- 16.2.8.4. Recent Developments
- 16.2.8.5. Financials (Based on Availability)
- 16.2.9 Black & Veatch Holding Company
- 16.2.9.1. Overview
- 16.2.9.2. Products
- 16.2.9.3. SWOT Analysis
- 16.2.9.4. Recent Developments
- 16.2.9.5. Financials (Based on Availability)
- 16.2.10 ECS Group of Companies
- 16.2.10.1. Overview
- 16.2.10.2. Products
- 16.2.10.3. SWOT Analysis
- 16.2.10.4. Recent Developments
- 16.2.10.5. Financials (Based on Availability)
- 16.2.1 Terracon
List of Figures
- Figure 1: Global US Engineering Industry Revenue Breakdown (Million, %) by Region 2024 & 2032
- Figure 2: Global US Engineering Industry Volume Breakdown (K Unit, %) by Region 2024 & 2032
- Figure 3: United states US Engineering Industry Revenue (Million), by Country 2024 & 2032
- Figure 4: United states US Engineering Industry Volume (K Unit), by Country 2024 & 2032
- Figure 5: United states US Engineering Industry Revenue Share (%), by Country 2024 & 2032
- Figure 6: United states US Engineering Industry Volume Share (%), by Country 2024 & 2032
- Figure 7: North America US Engineering Industry Revenue (Million), by Engineering Disciplines 2024 & 2032
- Figure 8: North America US Engineering Industry Volume (K Unit), by Engineering Disciplines 2024 & 2032
- Figure 9: North America US Engineering Industry Revenue Share (%), by Engineering Disciplines 2024 & 2032
- Figure 10: North America US Engineering Industry Volume Share (%), by Engineering Disciplines 2024 & 2032
- Figure 11: North America US Engineering Industry Revenue (Million), by End-user Industry 2024 & 2032
- Figure 12: North America US Engineering Industry Volume (K Unit), by End-user Industry 2024 & 2032
- Figure 13: North America US Engineering Industry Revenue Share (%), by End-user Industry 2024 & 2032
- Figure 14: North America US Engineering Industry Volume Share (%), by End-user Industry 2024 & 2032
- Figure 15: North America US Engineering Industry Revenue (Million), by Country 2024 & 2032
- Figure 16: North America US Engineering Industry Volume (K Unit), by Country 2024 & 2032
- Figure 17: North America US Engineering Industry Revenue Share (%), by Country 2024 & 2032
- Figure 18: North America US Engineering Industry Volume Share (%), by Country 2024 & 2032
- Figure 19: South America US Engineering Industry Revenue (Million), by Engineering Disciplines 2024 & 2032
- Figure 20: South America US Engineering Industry Volume (K Unit), by Engineering Disciplines 2024 & 2032
- Figure 21: South America US Engineering Industry Revenue Share (%), by Engineering Disciplines 2024 & 2032
- Figure 22: South America US Engineering Industry Volume Share (%), by Engineering Disciplines 2024 & 2032
- Figure 23: South America US Engineering Industry Revenue (Million), by End-user Industry 2024 & 2032
- Figure 24: South America US Engineering Industry Volume (K Unit), by End-user Industry 2024 & 2032
- Figure 25: South America US Engineering Industry Revenue Share (%), by End-user Industry 2024 & 2032
- Figure 26: South America US Engineering Industry Volume Share (%), by End-user Industry 2024 & 2032
- Figure 27: South America US Engineering Industry Revenue (Million), by Country 2024 & 2032
- Figure 28: South America US Engineering Industry Volume (K Unit), by Country 2024 & 2032
- Figure 29: South America US Engineering Industry Revenue Share (%), by Country 2024 & 2032
- Figure 30: South America US Engineering Industry Volume Share (%), by Country 2024 & 2032
- Figure 31: Europe US Engineering Industry Revenue (Million), by Engineering Disciplines 2024 & 2032
- Figure 32: Europe US Engineering Industry Volume (K Unit), by Engineering Disciplines 2024 & 2032
- Figure 33: Europe US Engineering Industry Revenue Share (%), by Engineering Disciplines 2024 & 2032
- Figure 34: Europe US Engineering Industry Volume Share (%), by Engineering Disciplines 2024 & 2032
- Figure 35: Europe US Engineering Industry Revenue (Million), by End-user Industry 2024 & 2032
- Figure 36: Europe US Engineering Industry Volume (K Unit), by End-user Industry 2024 & 2032
- Figure 37: Europe US Engineering Industry Revenue Share (%), by End-user Industry 2024 & 2032
- Figure 38: Europe US Engineering Industry Volume Share (%), by End-user Industry 2024 & 2032
- Figure 39: Europe US Engineering Industry Revenue (Million), by Country 2024 & 2032
- Figure 40: Europe US Engineering Industry Volume (K Unit), by Country 2024 & 2032
- Figure 41: Europe US Engineering Industry Revenue Share (%), by Country 2024 & 2032
- Figure 42: Europe US Engineering Industry Volume Share (%), by Country 2024 & 2032
- Figure 43: Middle East & Africa US Engineering Industry Revenue (Million), by Engineering Disciplines 2024 & 2032
- Figure 44: Middle East & Africa US Engineering Industry Volume (K Unit), by Engineering Disciplines 2024 & 2032
- Figure 45: Middle East & Africa US Engineering Industry Revenue Share (%), by Engineering Disciplines 2024 & 2032
- Figure 46: Middle East & Africa US Engineering Industry Volume Share (%), by Engineering Disciplines 2024 & 2032
- Figure 47: Middle East & Africa US Engineering Industry Revenue (Million), by End-user Industry 2024 & 2032
- Figure 48: Middle East & Africa US Engineering Industry Volume (K Unit), by End-user Industry 2024 & 2032
- Figure 49: Middle East & Africa US Engineering Industry Revenue Share (%), by End-user Industry 2024 & 2032
- Figure 50: Middle East & Africa US Engineering Industry Volume Share (%), by End-user Industry 2024 & 2032
- Figure 51: Middle East & Africa US Engineering Industry Revenue (Million), by Country 2024 & 2032
- Figure 52: Middle East & Africa US Engineering Industry Volume (K Unit), by Country 2024 & 2032
- Figure 53: Middle East & Africa US Engineering Industry Revenue Share (%), by Country 2024 & 2032
- Figure 54: Middle East & Africa US Engineering Industry Volume Share (%), by Country 2024 & 2032
- Figure 55: Asia Pacific US Engineering Industry Revenue (Million), by Engineering Disciplines 2024 & 2032
- Figure 56: Asia Pacific US Engineering Industry Volume (K Unit), by Engineering Disciplines 2024 & 2032
- Figure 57: Asia Pacific US Engineering Industry Revenue Share (%), by Engineering Disciplines 2024 & 2032
- Figure 58: Asia Pacific US Engineering Industry Volume Share (%), by Engineering Disciplines 2024 & 2032
- Figure 59: Asia Pacific US Engineering Industry Revenue (Million), by End-user Industry 2024 & 2032
- Figure 60: Asia Pacific US Engineering Industry Volume (K Unit), by End-user Industry 2024 & 2032
- Figure 61: Asia Pacific US Engineering Industry Revenue Share (%), by End-user Industry 2024 & 2032
- Figure 62: Asia Pacific US Engineering Industry Volume Share (%), by End-user Industry 2024 & 2032
- Figure 63: Asia Pacific US Engineering Industry Revenue (Million), by Country 2024 & 2032
- Figure 64: Asia Pacific US Engineering Industry Volume (K Unit), by Country 2024 & 2032
- Figure 65: Asia Pacific US Engineering Industry Revenue Share (%), by Country 2024 & 2032
- Figure 66: Asia Pacific US Engineering Industry Volume Share (%), by Country 2024 & 2032
List of Tables
- Table 1: Global US Engineering Industry Revenue Million Forecast, by Region 2019 & 2032
- Table 2: Global US Engineering Industry Volume K Unit Forecast, by Region 2019 & 2032
- Table 3: Global US Engineering Industry Revenue Million Forecast, by Engineering Disciplines 2019 & 2032
- Table 4: Global US Engineering Industry Volume K Unit Forecast, by Engineering Disciplines 2019 & 2032
- Table 5: Global US Engineering Industry Revenue Million Forecast, by End-user Industry 2019 & 2032
- Table 6: Global US Engineering Industry Volume K Unit Forecast, by End-user Industry 2019 & 2032
- Table 7: Global US Engineering Industry Revenue Million Forecast, by Region 2019 & 2032
- Table 8: Global US Engineering Industry Volume K Unit Forecast, by Region 2019 & 2032
- Table 9: Global US Engineering Industry Revenue Million Forecast, by Country 2019 & 2032
- Table 10: Global US Engineering Industry Volume K Unit Forecast, by Country 2019 & 2032
- Table 11: Northeast US Engineering Industry Revenue (Million) Forecast, by Application 2019 & 2032
- Table 12: Northeast US Engineering Industry Volume (K Unit) Forecast, by Application 2019 & 2032
- Table 13: Southeast US Engineering Industry Revenue (Million) Forecast, by Application 2019 & 2032
- Table 14: Southeast US Engineering Industry Volume (K Unit) Forecast, by Application 2019 & 2032
- Table 15: Midwest US Engineering Industry Revenue (Million) Forecast, by Application 2019 & 2032
- Table 16: Midwest US Engineering Industry Volume (K Unit) Forecast, by Application 2019 & 2032
- Table 17: Southwest US Engineering Industry Revenue (Million) Forecast, by Application 2019 & 2032
- Table 18: Southwest US Engineering Industry Volume (K Unit) Forecast, by Application 2019 & 2032
- Table 19: West US Engineering Industry Revenue (Million) Forecast, by Application 2019 & 2032
- Table 20: West US Engineering Industry Volume (K Unit) Forecast, by Application 2019 & 2032
- Table 21: Global US Engineering Industry Revenue Million Forecast, by Engineering Disciplines 2019 & 2032
- Table 22: Global US Engineering Industry Volume K Unit Forecast, by Engineering Disciplines 2019 & 2032
- Table 23: Global US Engineering Industry Revenue Million Forecast, by End-user Industry 2019 & 2032
- Table 24: Global US Engineering Industry Volume K Unit Forecast, by End-user Industry 2019 & 2032
- Table 25: Global US Engineering Industry Revenue Million Forecast, by Country 2019 & 2032
- Table 26: Global US Engineering Industry Volume K Unit Forecast, by Country 2019 & 2032
- Table 27: United States US Engineering Industry Revenue (Million) Forecast, by Application 2019 & 2032
- Table 28: United States US Engineering Industry Volume (K Unit) Forecast, by Application 2019 & 2032
- Table 29: Canada US Engineering Industry Revenue (Million) Forecast, by Application 2019 & 2032
- Table 30: Canada US Engineering Industry Volume (K Unit) Forecast, by Application 2019 & 2032
- Table 31: Mexico US Engineering Industry Revenue (Million) Forecast, by Application 2019 & 2032
- Table 32: Mexico US Engineering Industry Volume (K Unit) Forecast, by Application 2019 & 2032
- Table 33: Global US Engineering Industry Revenue Million Forecast, by Engineering Disciplines 2019 & 2032
- Table 34: Global US Engineering Industry Volume K Unit Forecast, by Engineering Disciplines 2019 & 2032
- Table 35: Global US Engineering Industry Revenue Million Forecast, by End-user Industry 2019 & 2032
- Table 36: Global US Engineering Industry Volume K Unit Forecast, by End-user Industry 2019 & 2032
- Table 37: Global US Engineering Industry Revenue Million Forecast, by Country 2019 & 2032
- Table 38: Global US Engineering Industry Volume K Unit Forecast, by Country 2019 & 2032
- Table 39: Brazil US Engineering Industry Revenue (Million) Forecast, by Application 2019 & 2032
- Table 40: Brazil US Engineering Industry Volume (K Unit) Forecast, by Application 2019 & 2032
- Table 41: Argentina US Engineering Industry Revenue (Million) Forecast, by Application 2019 & 2032
- Table 42: Argentina US Engineering Industry Volume (K Unit) Forecast, by Application 2019 & 2032
- Table 43: Rest of South America US Engineering Industry Revenue (Million) Forecast, by Application 2019 & 2032
- Table 44: Rest of South America US Engineering Industry Volume (K Unit) Forecast, by Application 2019 & 2032
- Table 45: Global US Engineering Industry Revenue Million Forecast, by Engineering Disciplines 2019 & 2032
- Table 46: Global US Engineering Industry Volume K Unit Forecast, by Engineering Disciplines 2019 & 2032
- Table 47: Global US Engineering Industry Revenue Million Forecast, by End-user Industry 2019 & 2032
- Table 48: Global US Engineering Industry Volume K Unit Forecast, by End-user Industry 2019 & 2032
- Table 49: Global US Engineering Industry Revenue Million Forecast, by Country 2019 & 2032
- Table 50: Global US Engineering Industry Volume K Unit Forecast, by Country 2019 & 2032
- Table 51: United Kingdom US Engineering Industry Revenue (Million) Forecast, by Application 2019 & 2032
- Table 52: United Kingdom US Engineering Industry Volume (K Unit) Forecast, by Application 2019 & 2032
- Table 53: Germany US Engineering Industry Revenue (Million) Forecast, by Application 2019 & 2032
- Table 54: Germany US Engineering Industry Volume (K Unit) Forecast, by Application 2019 & 2032
- Table 55: France US Engineering Industry Revenue (Million) Forecast, by Application 2019 & 2032
- Table 56: France US Engineering Industry Volume (K Unit) Forecast, by Application 2019 & 2032
- Table 57: Italy US Engineering Industry Revenue (Million) Forecast, by Application 2019 & 2032
- Table 58: Italy US Engineering Industry Volume (K Unit) Forecast, by Application 2019 & 2032
- Table 59: Spain US Engineering Industry Revenue (Million) Forecast, by Application 2019 & 2032
- Table 60: Spain US Engineering Industry Volume (K Unit) Forecast, by Application 2019 & 2032
- Table 61: Russia US Engineering Industry Revenue (Million) Forecast, by Application 2019 & 2032
- Table 62: Russia US Engineering Industry Volume (K Unit) Forecast, by Application 2019 & 2032
- Table 63: Benelux US Engineering Industry Revenue (Million) Forecast, by Application 2019 & 2032
- Table 64: Benelux US Engineering Industry Volume (K Unit) Forecast, by Application 2019 & 2032
- Table 65: Nordics US Engineering Industry Revenue (Million) Forecast, by Application 2019 & 2032
- Table 66: Nordics US Engineering Industry Volume (K Unit) Forecast, by Application 2019 & 2032
- Table 67: Rest of Europe US Engineering Industry Revenue (Million) Forecast, by Application 2019 & 2032
- Table 68: Rest of Europe US Engineering Industry Volume (K Unit) Forecast, by Application 2019 & 2032
- Table 69: Global US Engineering Industry Revenue Million Forecast, by Engineering Disciplines 2019 & 2032
- Table 70: Global US Engineering Industry Volume K Unit Forecast, by Engineering Disciplines 2019 & 2032
- Table 71: Global US Engineering Industry Revenue Million Forecast, by End-user Industry 2019 & 2032
- Table 72: Global US Engineering Industry Volume K Unit Forecast, by End-user Industry 2019 & 2032
- Table 73: Global US Engineering Industry Revenue Million Forecast, by Country 2019 & 2032
- Table 74: Global US Engineering Industry Volume K Unit Forecast, by Country 2019 & 2032
- Table 75: Turkey US Engineering Industry Revenue (Million) Forecast, by Application 2019 & 2032
- Table 76: Turkey US Engineering Industry Volume (K Unit) Forecast, by Application 2019 & 2032
- Table 77: Israel US Engineering Industry Revenue (Million) Forecast, by Application 2019 & 2032
- Table 78: Israel US Engineering Industry Volume (K Unit) Forecast, by Application 2019 & 2032
- Table 79: GCC US Engineering Industry Revenue (Million) Forecast, by Application 2019 & 2032
- Table 80: GCC US Engineering Industry Volume (K Unit) Forecast, by Application 2019 & 2032
- Table 81: North Africa US Engineering Industry Revenue (Million) Forecast, by Application 2019 & 2032
- Table 82: North Africa US Engineering Industry Volume (K Unit) Forecast, by Application 2019 & 2032
- Table 83: South Africa US Engineering Industry Revenue (Million) Forecast, by Application 2019 & 2032
- Table 84: South Africa US Engineering Industry Volume (K Unit) Forecast, by Application 2019 & 2032
- Table 85: Rest of Middle East & Africa US Engineering Industry Revenue (Million) Forecast, by Application 2019 & 2032
- Table 86: Rest of Middle East & Africa US Engineering Industry Volume (K Unit) Forecast, by Application 2019 & 2032
- Table 87: Global US Engineering Industry Revenue Million Forecast, by Engineering Disciplines 2019 & 2032
- Table 88: Global US Engineering Industry Volume K Unit Forecast, by Engineering Disciplines 2019 & 2032
- Table 89: Global US Engineering Industry Revenue Million Forecast, by End-user Industry 2019 & 2032
- Table 90: Global US Engineering Industry Volume K Unit Forecast, by End-user Industry 2019 & 2032
- Table 91: Global US Engineering Industry Revenue Million Forecast, by Country 2019 & 2032
- Table 92: Global US Engineering Industry Volume K Unit Forecast, by Country 2019 & 2032
- Table 93: China US Engineering Industry Revenue (Million) Forecast, by Application 2019 & 2032
- Table 94: China US Engineering Industry Volume (K Unit) Forecast, by Application 2019 & 2032
- Table 95: India US Engineering Industry Revenue (Million) Forecast, by Application 2019 & 2032
- Table 96: India US Engineering Industry Volume (K Unit) Forecast, by Application 2019 & 2032
- Table 97: Japan US Engineering Industry Revenue (Million) Forecast, by Application 2019 & 2032
- Table 98: Japan US Engineering Industry Volume (K Unit) Forecast, by Application 2019 & 2032
- Table 99: South Korea US Engineering Industry Revenue (Million) Forecast, by Application 2019 & 2032
- Table 100: South Korea US Engineering Industry Volume (K Unit) Forecast, by Application 2019 & 2032
- Table 101: ASEAN US Engineering Industry Revenue (Million) Forecast, by Application 2019 & 2032
- Table 102: ASEAN US Engineering Industry Volume (K Unit) Forecast, by Application 2019 & 2032
- Table 103: Oceania US Engineering Industry Revenue (Million) Forecast, by Application 2019 & 2032
- Table 104: Oceania US Engineering Industry Volume (K Unit) Forecast, by Application 2019 & 2032
- Table 105: Rest of Asia Pacific US Engineering Industry Revenue (Million) Forecast, by Application 2019 & 2032
- Table 106: Rest of Asia Pacific US Engineering Industry Volume (K Unit) Forecast, by Application 2019 & 2032
Frequently Asked Questions
1. What is the projected Compound Annual Growth Rate (CAGR) of the US Engineering Industry?
The projected CAGR is approximately 8.75%.
2. Which companies are prominent players in the US Engineering Industry?
Key companies in the market include Terracon, Bechtel Corporation, Jacobs Engineering Group, KBR Inc, HDR Inc, Fluor Corporation, Jensen Hughes, AECOM, Black & Veatch Holding Company, ECS Group of Companies.
3. What are the main segments of the US Engineering Industry?
The market segments include Engineering Disciplines, End-user Industry.
4. Can you provide details about the market size?
The market size is estimated to be USD XX Million as of 2022.
5. What are some drivers contributing to market growth?
Increasing demand due to a growing private investment in large-scale projects and recovery in natural gas and oil prices likely to propel demand from industrial customers; Technological advancements have aided in reducing lead time and resource overheads.
6. What are the notable trends driving market growth?
Civil Engineering Services is Expected to Register a Significant Growth.
7. Are there any restraints impacting market growth?
Market susceptibility to changes in macro-environment as well as regulatory landscape.
8. Can you provide examples of recent developments in the market?
May 2022 - The Naval Facilities Engineering Systems Command (NAVFAC) Atlantic has awarded AECOM's Resolution Consultants joint venture with EnSafe a solitary, indefinite-delivery, indefinite-quantity (IDIQ) contract to deliver architecture and engineering services for the Comprehensive Long-Term Environmental Action Navy (CLEAN) program. The joint venture will conduct environmental research, investigations, and designs that solve major environmental concerns under the contract, which has a USD 400 million budget.
9. What pricing options are available for accessing the report?
Pricing options include single-user, multi-user, and enterprise licenses priced at USD 3800, USD 4500, and USD 5800 respectively.
10. Is the market size provided in terms of value or volume?
The market size is provided in terms of value, measured in Million and volume, measured in K Unit.
11. Are there any specific market keywords associated with the report?
Yes, the market keyword associated with the report is "US Engineering Industry," which aids in identifying and referencing the specific market segment covered.
12. How do I determine which pricing option suits my needs best?
The pricing options vary based on user requirements and access needs. Individual users may opt for single-user licenses, while businesses requiring broader access may choose multi-user or enterprise licenses for cost-effective access to the report.
13. Are there any additional resources or data provided in the US Engineering Industry report?
While the report offers comprehensive insights, it's advisable to review the specific contents or supplementary materials provided to ascertain if additional resources or data are available.
14. How can I stay updated on further developments or reports in the US Engineering Industry?
To stay informed about further developments, trends, and reports in the US Engineering Industry, consider subscribing to industry newsletters, following relevant companies and organizations, or regularly checking reputable industry news sources and publications.
Methodology
Step 1 - Identification of Relevant Samples Size from Population Database


Step 2 - Approaches for Defining Global Market Size (Value, Volume* & Price*)

Note*: In applicable scenarios
Step 3 - Data Sources
Primary Research
- Web Analytics
- Survey Reports
- Research Institute
- Latest Research Reports
- Opinion Leaders
Secondary Research
- Annual Reports
- White Paper
- Latest Press Release
- Industry Association
- Paid Database
- Investor Presentations

Step 4 - Data Triangulation
Involves using different sources of information in order to increase the validity of a study
These sources are likely to be stakeholders in a program - participants, other researchers, program staff, other community members, and so on.
Then we put all data in single framework & apply various statistical tools to find out the dynamic on the market.
During the analysis stage, feedback from the stakeholder groups would be compared to determine areas of agreement as well as areas of divergence


