
Key Insights
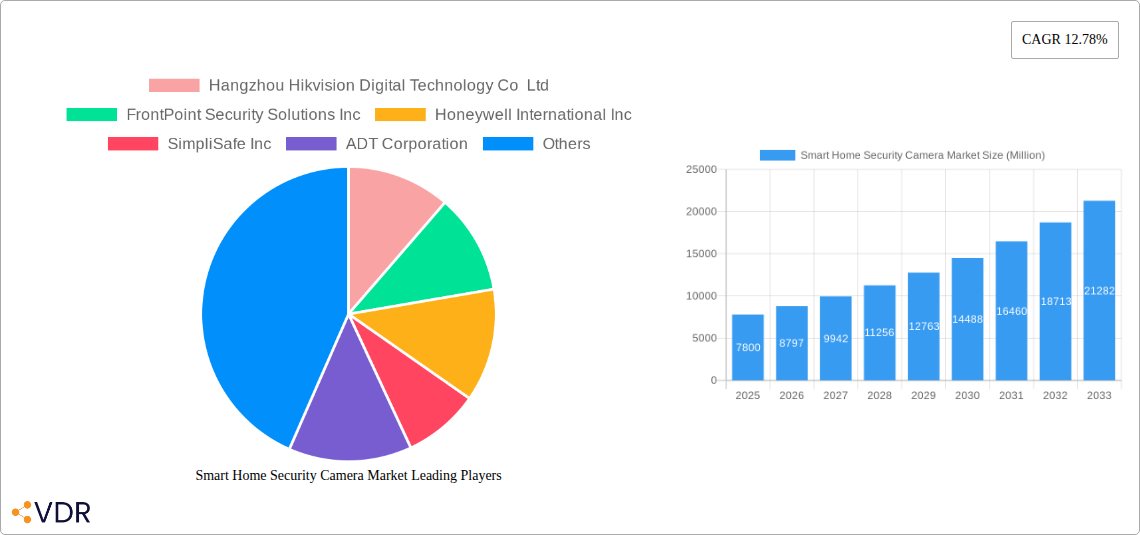
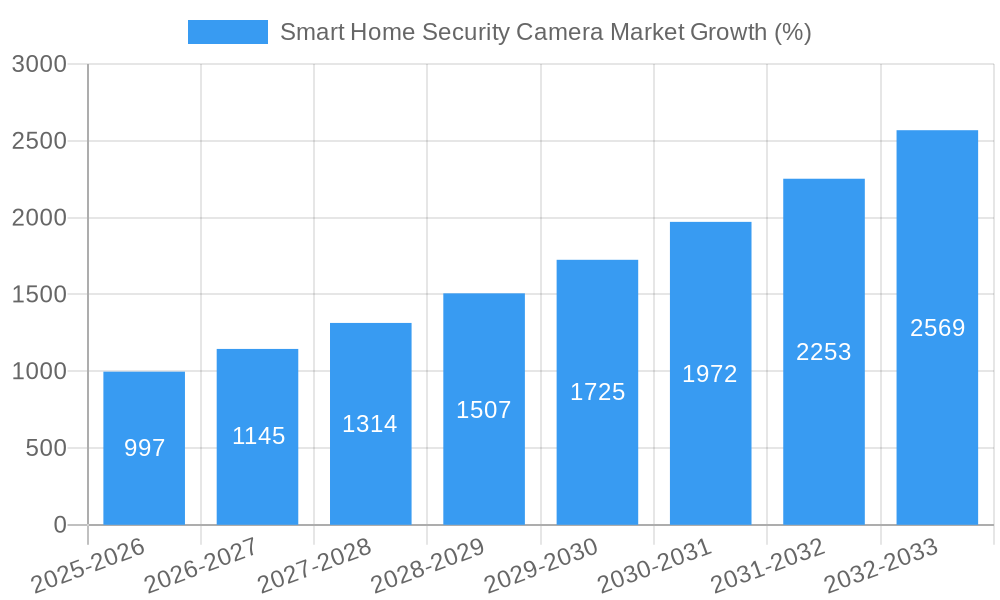
The global smart home security camera market is experiencing robust growth, projected to reach $7.80 billion in 2025 and maintain a Compound Annual Growth Rate (CAGR) of 12.78% from 2025 to 2033. This expansion is driven by several key factors. Increasing consumer awareness of home security threats, coupled with the rising affordability and accessibility of smart home devices, are significant contributors. The integration of advanced features like AI-powered object recognition, cloud storage capabilities, and seamless integration with other smart home ecosystems further fuels market demand. Consumers are increasingly seeking convenient and sophisticated security solutions that offer remote monitoring, real-time alerts, and enhanced video quality, all contributing to the market's rapid growth. The market is also witnessing a shift towards subscription-based services, offering features like professional monitoring and cloud storage, which generates recurring revenue streams for vendors. Competition is fierce, with established players like Hangzhou Hikvision, Honeywell, and ADT competing with innovative startups like SimpliSafe and Arlo. This competitive landscape drives innovation and pushes prices down, making smart home security cameras accessible to a broader consumer base.
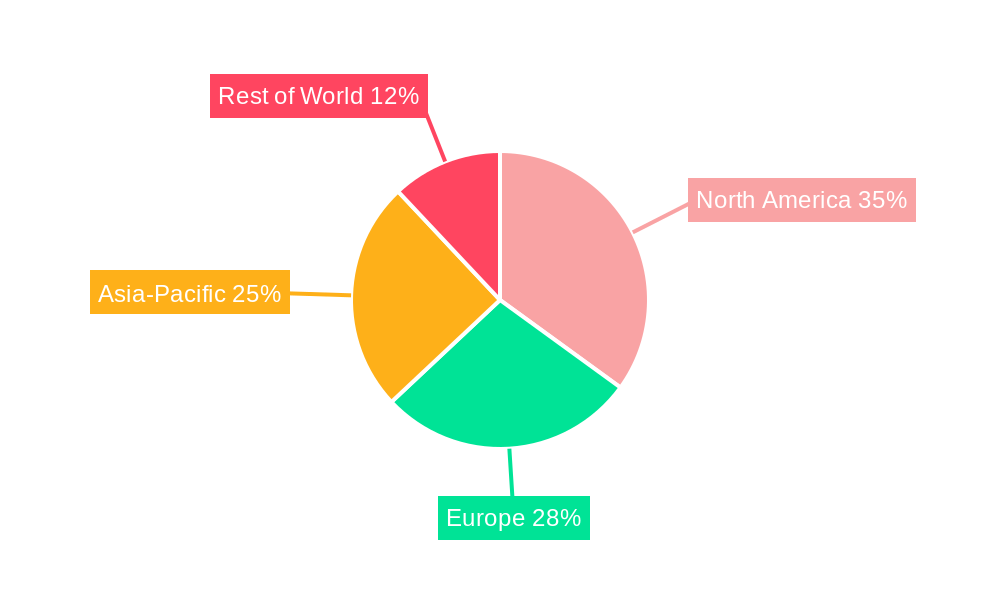
The market segmentation is diverse, encompassing various camera types (wired, wireless, indoor, outdoor), resolutions (HD, 4K), and functionalities (night vision, motion detection, two-way audio). Regional variations exist, with North America and Europe currently dominating the market share due to higher adoption rates and disposable income. However, the Asia-Pacific region is anticipated to witness significant growth in the coming years due to increasing urbanization and rising middle-class incomes. Despite these positive trends, challenges remain, including concerns about data privacy and security breaches, as well as the need for improved interoperability between different smart home systems. Nevertheless, the long-term outlook for the smart home security camera market remains overwhelmingly positive, driven by technological advancements, escalating security concerns, and an expanding consumer base.
Smart Home Security Camera Market: A Comprehensive Report (2019-2033)
This comprehensive report provides an in-depth analysis of the Smart Home Security Camera Market, encompassing market dynamics, growth trends, regional performance, product landscape, and key players. The report covers the period from 2019 to 2033, with a focus on the 2025-2033 forecast period. The study includes detailed analysis of the parent market (Smart Home Security Systems) and its child market (Smart Home Security Cameras), offering valuable insights for industry professionals, investors, and strategic decision-makers. The market size is presented in Million units.
Smart Home Security Camera Market Dynamics & Structure
The Smart Home Security Camera market, a significant segment within the broader Smart Home Security Systems market, is characterized by intense competition and rapid technological advancements. Market concentration is moderate, with a few major players holding significant shares, but a large number of smaller companies competing on features, price, and brand recognition. Technological innovation is a primary driver, with advancements in AI-powered features (facial recognition, object detection), enhanced video resolution (4K, HDR), improved night vision, and seamless integration with other smart home devices.
- Market Concentration: Moderate, with the top 5 players holding approximately xx% of the market share in 2024.
- Technological Innovation: Key drivers include AI, advanced image processing, cloud storage integration, and improved cybersecurity features.
- Regulatory Frameworks: Vary across regions, impacting data privacy and security standards. Compliance costs influence pricing and market entry.
- Competitive Product Substitutes: Traditional security systems and professional monitoring services offer alternative solutions.
- End-User Demographics: Growing adoption among homeowners, renters, and businesses, particularly in urban areas with high crime rates and enhanced internet connectivity.
- M&A Trends: Consolidation is evident, with xx major M&A deals recorded in the last five years, driving market concentration and expansion of product portfolios.
Smart Home Security Camera Market Growth Trends & Insights
The global Smart Home Security Camera market is experiencing robust growth, driven by increasing consumer demand for home security solutions, rising affordability of smart home devices, and expanding internet penetration. The market witnessed a CAGR of xx% during the historical period (2019-2024) and is projected to maintain a CAGR of xx% during the forecast period (2025-2033), reaching xx Million units by 2033. This growth is fueled by technological advancements, such as AI-powered features and improved video quality, increasing consumer awareness of smart home security benefits, and the rising adoption of IoT devices. Market penetration is relatively high in developed economies but remains significant growth potential in emerging markets. Consumer behavior is shifting towards integrated security systems, offering centralized control and enhanced user experience.
Dominant Regions, Countries, or Segments in Smart Home Security Camera Market
North America currently holds the largest market share in the Smart Home Security Camera market, followed by Europe and Asia Pacific. This dominance is attributed to factors like high disposable incomes, advanced technological infrastructure, and early adoption of smart home technology. However, the Asia Pacific region is poised for rapid growth due to increasing urbanization, rising middle-class incomes, and expanding internet connectivity.
- North America: High adoption rates due to strong consumer preference for smart home technology.
- Europe: Significant market size, driven by concerns about home security and government initiatives promoting smart home adoption.
- Asia Pacific: Fastest-growing region, fueled by rising disposable incomes and increased internet penetration.
- Key Drivers: Government initiatives, favorable economic conditions, robust technological infrastructure, growing urbanization, and rising disposable incomes.
Smart Home Security Camera Market Product Landscape
The market offers a wide array of smart home security cameras, ranging from basic models with motion detection to advanced systems with AI-powered features like facial recognition, object detection, and two-way audio. High-resolution video (up to 4K), improved night vision capabilities, and cloud storage integration are key features driving product differentiation. Unique selling propositions include features such as advanced analytics, pet detection, and integration with other smart home ecosystems.
Key Drivers, Barriers & Challenges in Smart Home Security Camera Market
Key Drivers: The market is driven by growing concerns about home security, increasing awareness of smart home technology, affordability improvements, and the integration of AI features like enhanced facial recognition and object detection. Government initiatives promoting smart home adoption in several countries also act as a key driver.
Challenges & Restraints: Cybersecurity risks, data privacy concerns, and the complexity of integrating various smart home devices remain key barriers. High initial costs, especially for advanced models with AI capabilities, can also deter some consumers. Supply chain disruptions and the increasing cost of raw materials are potential challenges. Competitor pressures and the rapid pace of technological innovation necessitate continuous investment in R&D.
Emerging Opportunities in Smart Home Security Camera Market
Emerging opportunities include the integration of smart home security cameras with other IoT devices to create comprehensive home security systems. Expanding into untapped markets in developing economies with increasing internet penetration holds significant potential. Innovative applications like AI-powered threat detection and proactive security measures offer substantial growth avenues.
Growth Accelerators in the Smart Home Security Camera Market Industry
Technological advancements, strategic partnerships between hardware manufacturers and software developers, and expansion into new geographic markets are key growth accelerators. The development of more affordable and user-friendly devices, as well as stronger cybersecurity measures, will further fuel market expansion.
Key Players Shaping the Smart Home Security Camera Market Market
- Hangzhou Hikvision Digital Technology Co Ltd
- FrontPoint Security Solutions Inc
- Honeywell International Inc
- SimpliSafe Inc
- ADT Corporation
- Vivint Inc
- Netgear Inc
- Abode Systems Inc
- Panasonic Corporation
- Brinks Home Security
- Samsung Electronics Co Ltd
- Arlo Inc
- Wyze Labs Inc
- Philips Inc
- Logitech Inc
- Amcrest Industries LLC
- Lorex Corporation
- Somfy Inc
Notable Milestones in Smart Home Security Camera Market Sector
- May 2024: Yale (ASSA ABLOY) launched the Yale Smart Indoor Camera and Yale Smart Outdoor Camera, featuring 1080p Full HD resolution, a 154° field of view, and superior color night vision. This launch significantly expanded product offerings within the smart home security camera segment.
- January 2024: Xiaomi introduced the 360 Home Security Camera 2K, featuring 2K HD video, a 3-megapixel camera, a 360-degree panorama view, and AI human detection. This contributed to increased competition in the budget-friendly smart camera segment.
In-Depth Smart Home Security Camera Market Market Outlook
The Smart Home Security Camera market is poised for continued robust growth, driven by technological innovation, increased consumer demand, and expansion into emerging markets. Strategic partnerships, focusing on product integration and enhanced user experiences, will play a crucial role in shaping the future of the market. The development of advanced AI features and improved cybersecurity measures will further enhance the appeal and adoption of smart home security cameras, creating significant growth opportunities for industry players in the years to come.
Smart Home Security Camera Market Segmentation
-
1. Type
- 1.1. Analog Camera
-
1.2. IP Camera
- 1.2.1. PTZ Camera
-
2. Resolution
- 2.1. HD
- 2.2. Full HD
-
3. Location
- 3.1. Indoor
- 3.2. Outdoor
-
4. Shape
- 4.1. Bullet
- 4.2. Dome
- 4.3. Pan
- 4.4. Other Shapes
Smart Home Security Camera Market Segmentation By Geography
- 1. North America
- 2. Europe
- 3. Asia Pacific
- 4. Latin America
- 5. Middle East and Africa
Smart Home Security Camera Market REPORT HIGHLIGHTS
| Aspects | Details |
|---|---|
| Study Period | 2019-2033 |
| Base Year | 2024 |
| Estimated Year | 2025 |
| Forecast Period | 2025-2033 |
| Historical Period | 2019-2024 |
| Growth Rate | CAGR of 12.78% from 2019-2033 |
| Segmentation |
|
Table of Contents
- 1. Introduction
- 1.1. Research Scope
- 1.2. Market Segmentation
- 1.3. Research Methodology
- 1.4. Definitions and Assumptions
- 2. Executive Summary
- 2.1. Introduction
- 3. Market Dynamics
- 3.1. Introduction
- 3.2. Market Drivers
- 3.2.1 Increase in Concern Regarding Home Safety and Security; Growing Concerns About Safety
- 3.2.2 Evidenced by a Rise in Thefts and Crimes Related to Property.
- 3.3. Market Restrains
- 3.3.1 Increase in Concern Regarding Home Safety and Security; Growing Concerns About Safety
- 3.3.2 Evidenced by a Rise in Thefts and Crimes Related to Property.
- 3.4. Market Trends
- 3.4.1. Indoor Cameras is Expected to Witness a Significant Growth
- 4. Market Factor Analysis
- 4.1. Porters Five Forces
- 4.2. Supply/Value Chain
- 4.3. PESTEL analysis
- 4.4. Market Entropy
- 4.5. Patent/Trademark Analysis
- 5. Global Smart Home Security Camera Market Analysis, Insights and Forecast, 2019-2031
- 5.1. Market Analysis, Insights and Forecast - by Type
- 5.1.1. Analog Camera
- 5.1.2. IP Camera
- 5.1.2.1. PTZ Camera
- 5.2. Market Analysis, Insights and Forecast - by Resolution
- 5.2.1. HD
- 5.2.2. Full HD
- 5.3. Market Analysis, Insights and Forecast - by Location
- 5.3.1. Indoor
- 5.3.2. Outdoor
- 5.4. Market Analysis, Insights and Forecast - by Shape
- 5.4.1. Bullet
- 5.4.2. Dome
- 5.4.3. Pan
- 5.4.4. Other Shapes
- 5.5. Market Analysis, Insights and Forecast - by Region
- 5.5.1. North America
- 5.5.2. Europe
- 5.5.3. Asia Pacific
- 5.5.4. Latin America
- 5.5.5. Middle East and Africa
- 5.1. Market Analysis, Insights and Forecast - by Type
- 6. North America Smart Home Security Camera Market Analysis, Insights and Forecast, 2019-2031
- 6.1. Market Analysis, Insights and Forecast - by Type
- 6.1.1. Analog Camera
- 6.1.2. IP Camera
- 6.1.2.1. PTZ Camera
- 6.2. Market Analysis, Insights and Forecast - by Resolution
- 6.2.1. HD
- 6.2.2. Full HD
- 6.3. Market Analysis, Insights and Forecast - by Location
- 6.3.1. Indoor
- 6.3.2. Outdoor
- 6.4. Market Analysis, Insights and Forecast - by Shape
- 6.4.1. Bullet
- 6.4.2. Dome
- 6.4.3. Pan
- 6.4.4. Other Shapes
- 6.1. Market Analysis, Insights and Forecast - by Type
- 7. Europe Smart Home Security Camera Market Analysis, Insights and Forecast, 2019-2031
- 7.1. Market Analysis, Insights and Forecast - by Type
- 7.1.1. Analog Camera
- 7.1.2. IP Camera
- 7.1.2.1. PTZ Camera
- 7.2. Market Analysis, Insights and Forecast - by Resolution
- 7.2.1. HD
- 7.2.2. Full HD
- 7.3. Market Analysis, Insights and Forecast - by Location
- 7.3.1. Indoor
- 7.3.2. Outdoor
- 7.4. Market Analysis, Insights and Forecast - by Shape
- 7.4.1. Bullet
- 7.4.2. Dome
- 7.4.3. Pan
- 7.4.4. Other Shapes
- 7.1. Market Analysis, Insights and Forecast - by Type
- 8. Asia Pacific Smart Home Security Camera Market Analysis, Insights and Forecast, 2019-2031
- 8.1. Market Analysis, Insights and Forecast - by Type
- 8.1.1. Analog Camera
- 8.1.2. IP Camera
- 8.1.2.1. PTZ Camera
- 8.2. Market Analysis, Insights and Forecast - by Resolution
- 8.2.1. HD
- 8.2.2. Full HD
- 8.3. Market Analysis, Insights and Forecast - by Location
- 8.3.1. Indoor
- 8.3.2. Outdoor
- 8.4. Market Analysis, Insights and Forecast - by Shape
- 8.4.1. Bullet
- 8.4.2. Dome
- 8.4.3. Pan
- 8.4.4. Other Shapes
- 8.1. Market Analysis, Insights and Forecast - by Type
- 9. Latin America Smart Home Security Camera Market Analysis, Insights and Forecast, 2019-2031
- 9.1. Market Analysis, Insights and Forecast - by Type
- 9.1.1. Analog Camera
- 9.1.2. IP Camera
- 9.1.2.1. PTZ Camera
- 9.2. Market Analysis, Insights and Forecast - by Resolution
- 9.2.1. HD
- 9.2.2. Full HD
- 9.3. Market Analysis, Insights and Forecast - by Location
- 9.3.1. Indoor
- 9.3.2. Outdoor
- 9.4. Market Analysis, Insights and Forecast - by Shape
- 9.4.1. Bullet
- 9.4.2. Dome
- 9.4.3. Pan
- 9.4.4. Other Shapes
- 9.1. Market Analysis, Insights and Forecast - by Type
- 10. Middle East and Africa Smart Home Security Camera Market Analysis, Insights and Forecast, 2019-2031
- 10.1. Market Analysis, Insights and Forecast - by Type
- 10.1.1. Analog Camera
- 10.1.2. IP Camera
- 10.1.2.1. PTZ Camera
- 10.2. Market Analysis, Insights and Forecast - by Resolution
- 10.2.1. HD
- 10.2.2. Full HD
- 10.3. Market Analysis, Insights and Forecast - by Location
- 10.3.1. Indoor
- 10.3.2. Outdoor
- 10.4. Market Analysis, Insights and Forecast - by Shape
- 10.4.1. Bullet
- 10.4.2. Dome
- 10.4.3. Pan
- 10.4.4. Other Shapes
- 10.1. Market Analysis, Insights and Forecast - by Type
- 11. Competitive Analysis
- 11.1. Global Market Share Analysis 2024
- 11.2. Company Profiles
- 11.2.1 Hangzhou Hikvision Digital Technology Co Ltd
- 11.2.1.1. Overview
- 11.2.1.2. Products
- 11.2.1.3. SWOT Analysis
- 11.2.1.4. Recent Developments
- 11.2.1.5. Financials (Based on Availability)
- 11.2.2 FrontPoint Security Solutions Inc
- 11.2.2.1. Overview
- 11.2.2.2. Products
- 11.2.2.3. SWOT Analysis
- 11.2.2.4. Recent Developments
- 11.2.2.5. Financials (Based on Availability)
- 11.2.3 Honeywell International Inc
- 11.2.3.1. Overview
- 11.2.3.2. Products
- 11.2.3.3. SWOT Analysis
- 11.2.3.4. Recent Developments
- 11.2.3.5. Financials (Based on Availability)
- 11.2.4 SimpliSafe Inc
- 11.2.4.1. Overview
- 11.2.4.2. Products
- 11.2.4.3. SWOT Analysis
- 11.2.4.4. Recent Developments
- 11.2.4.5. Financials (Based on Availability)
- 11.2.5 ADT Corporation
- 11.2.5.1. Overview
- 11.2.5.2. Products
- 11.2.5.3. SWOT Analysis
- 11.2.5.4. Recent Developments
- 11.2.5.5. Financials (Based on Availability)
- 11.2.6 Vivint Inc
- 11.2.6.1. Overview
- 11.2.6.2. Products
- 11.2.6.3. SWOT Analysis
- 11.2.6.4. Recent Developments
- 11.2.6.5. Financials (Based on Availability)
- 11.2.7 Netgear Inc
- 11.2.7.1. Overview
- 11.2.7.2. Products
- 11.2.7.3. SWOT Analysis
- 11.2.7.4. Recent Developments
- 11.2.7.5. Financials (Based on Availability)
- 11.2.8 Abode Systems Inc
- 11.2.8.1. Overview
- 11.2.8.2. Products
- 11.2.8.3. SWOT Analysis
- 11.2.8.4. Recent Developments
- 11.2.8.5. Financials (Based on Availability)
- 11.2.9 Panasonic Corporation
- 11.2.9.1. Overview
- 11.2.9.2. Products
- 11.2.9.3. SWOT Analysis
- 11.2.9.4. Recent Developments
- 11.2.9.5. Financials (Based on Availability)
- 11.2.10 Brinks Home Security
- 11.2.10.1. Overview
- 11.2.10.2. Products
- 11.2.10.3. SWOT Analysis
- 11.2.10.4. Recent Developments
- 11.2.10.5. Financials (Based on Availability)
- 11.2.11 Samsung Electronics Co Ltd
- 11.2.11.1. Overview
- 11.2.11.2. Products
- 11.2.11.3. SWOT Analysis
- 11.2.11.4. Recent Developments
- 11.2.11.5. Financials (Based on Availability)
- 11.2.12 Arlo Inc
- 11.2.12.1. Overview
- 11.2.12.2. Products
- 11.2.12.3. SWOT Analysis
- 11.2.12.4. Recent Developments
- 11.2.12.5. Financials (Based on Availability)
- 11.2.13 Wyze Labs Inc
- 11.2.13.1. Overview
- 11.2.13.2. Products
- 11.2.13.3. SWOT Analysis
- 11.2.13.4. Recent Developments
- 11.2.13.5. Financials (Based on Availability)
- 11.2.14 Philips Inc
- 11.2.14.1. Overview
- 11.2.14.2. Products
- 11.2.14.3. SWOT Analysis
- 11.2.14.4. Recent Developments
- 11.2.14.5. Financials (Based on Availability)
- 11.2.15 Logitech Inc
- 11.2.15.1. Overview
- 11.2.15.2. Products
- 11.2.15.3. SWOT Analysis
- 11.2.15.4. Recent Developments
- 11.2.15.5. Financials (Based on Availability)
- 11.2.16 Amcrest Industries LLC
- 11.2.16.1. Overview
- 11.2.16.2. Products
- 11.2.16.3. SWOT Analysis
- 11.2.16.4. Recent Developments
- 11.2.16.5. Financials (Based on Availability)
- 11.2.17 Lorex Corporation
- 11.2.17.1. Overview
- 11.2.17.2. Products
- 11.2.17.3. SWOT Analysis
- 11.2.17.4. Recent Developments
- 11.2.17.5. Financials (Based on Availability)
- 11.2.18 Somfy Inc
- 11.2.18.1. Overview
- 11.2.18.2. Products
- 11.2.18.3. SWOT Analysis
- 11.2.18.4. Recent Developments
- 11.2.18.5. Financials (Based on Availability)
- 11.2.1 Hangzhou Hikvision Digital Technology Co Ltd
List of Figures
- Figure 1: Global Smart Home Security Camera Market Revenue Breakdown (Million, %) by Region 2024 & 2032
- Figure 2: Global Smart Home Security Camera Market Volume Breakdown (Billion, %) by Region 2024 & 2032
- Figure 3: North America Smart Home Security Camera Market Revenue (Million), by Type 2024 & 2032
- Figure 4: North America Smart Home Security Camera Market Volume (Billion), by Type 2024 & 2032
- Figure 5: North America Smart Home Security Camera Market Revenue Share (%), by Type 2024 & 2032
- Figure 6: North America Smart Home Security Camera Market Volume Share (%), by Type 2024 & 2032
- Figure 7: North America Smart Home Security Camera Market Revenue (Million), by Resolution 2024 & 2032
- Figure 8: North America Smart Home Security Camera Market Volume (Billion), by Resolution 2024 & 2032
- Figure 9: North America Smart Home Security Camera Market Revenue Share (%), by Resolution 2024 & 2032
- Figure 10: North America Smart Home Security Camera Market Volume Share (%), by Resolution 2024 & 2032
- Figure 11: North America Smart Home Security Camera Market Revenue (Million), by Location 2024 & 2032
- Figure 12: North America Smart Home Security Camera Market Volume (Billion), by Location 2024 & 2032
- Figure 13: North America Smart Home Security Camera Market Revenue Share (%), by Location 2024 & 2032
- Figure 14: North America Smart Home Security Camera Market Volume Share (%), by Location 2024 & 2032
- Figure 15: North America Smart Home Security Camera Market Revenue (Million), by Shape 2024 & 2032
- Figure 16: North America Smart Home Security Camera Market Volume (Billion), by Shape 2024 & 2032
- Figure 17: North America Smart Home Security Camera Market Revenue Share (%), by Shape 2024 & 2032
- Figure 18: North America Smart Home Security Camera Market Volume Share (%), by Shape 2024 & 2032
- Figure 19: North America Smart Home Security Camera Market Revenue (Million), by Country 2024 & 2032
- Figure 20: North America Smart Home Security Camera Market Volume (Billion), by Country 2024 & 2032
- Figure 21: North America Smart Home Security Camera Market Revenue Share (%), by Country 2024 & 2032
- Figure 22: North America Smart Home Security Camera Market Volume Share (%), by Country 2024 & 2032
- Figure 23: Europe Smart Home Security Camera Market Revenue (Million), by Type 2024 & 2032
- Figure 24: Europe Smart Home Security Camera Market Volume (Billion), by Type 2024 & 2032
- Figure 25: Europe Smart Home Security Camera Market Revenue Share (%), by Type 2024 & 2032
- Figure 26: Europe Smart Home Security Camera Market Volume Share (%), by Type 2024 & 2032
- Figure 27: Europe Smart Home Security Camera Market Revenue (Million), by Resolution 2024 & 2032
- Figure 28: Europe Smart Home Security Camera Market Volume (Billion), by Resolution 2024 & 2032
- Figure 29: Europe Smart Home Security Camera Market Revenue Share (%), by Resolution 2024 & 2032
- Figure 30: Europe Smart Home Security Camera Market Volume Share (%), by Resolution 2024 & 2032
- Figure 31: Europe Smart Home Security Camera Market Revenue (Million), by Location 2024 & 2032
- Figure 32: Europe Smart Home Security Camera Market Volume (Billion), by Location 2024 & 2032
- Figure 33: Europe Smart Home Security Camera Market Revenue Share (%), by Location 2024 & 2032
- Figure 34: Europe Smart Home Security Camera Market Volume Share (%), by Location 2024 & 2032
- Figure 35: Europe Smart Home Security Camera Market Revenue (Million), by Shape 2024 & 2032
- Figure 36: Europe Smart Home Security Camera Market Volume (Billion), by Shape 2024 & 2032
- Figure 37: Europe Smart Home Security Camera Market Revenue Share (%), by Shape 2024 & 2032
- Figure 38: Europe Smart Home Security Camera Market Volume Share (%), by Shape 2024 & 2032
- Figure 39: Europe Smart Home Security Camera Market Revenue (Million), by Country 2024 & 2032
- Figure 40: Europe Smart Home Security Camera Market Volume (Billion), by Country 2024 & 2032
- Figure 41: Europe Smart Home Security Camera Market Revenue Share (%), by Country 2024 & 2032
- Figure 42: Europe Smart Home Security Camera Market Volume Share (%), by Country 2024 & 2032
- Figure 43: Asia Pacific Smart Home Security Camera Market Revenue (Million), by Type 2024 & 2032
- Figure 44: Asia Pacific Smart Home Security Camera Market Volume (Billion), by Type 2024 & 2032
- Figure 45: Asia Pacific Smart Home Security Camera Market Revenue Share (%), by Type 2024 & 2032
- Figure 46: Asia Pacific Smart Home Security Camera Market Volume Share (%), by Type 2024 & 2032
- Figure 47: Asia Pacific Smart Home Security Camera Market Revenue (Million), by Resolution 2024 & 2032
- Figure 48: Asia Pacific Smart Home Security Camera Market Volume (Billion), by Resolution 2024 & 2032
- Figure 49: Asia Pacific Smart Home Security Camera Market Revenue Share (%), by Resolution 2024 & 2032
- Figure 50: Asia Pacific Smart Home Security Camera Market Volume Share (%), by Resolution 2024 & 2032
- Figure 51: Asia Pacific Smart Home Security Camera Market Revenue (Million), by Location 2024 & 2032
- Figure 52: Asia Pacific Smart Home Security Camera Market Volume (Billion), by Location 2024 & 2032
- Figure 53: Asia Pacific Smart Home Security Camera Market Revenue Share (%), by Location 2024 & 2032
- Figure 54: Asia Pacific Smart Home Security Camera Market Volume Share (%), by Location 2024 & 2032
- Figure 55: Asia Pacific Smart Home Security Camera Market Revenue (Million), by Shape 2024 & 2032
- Figure 56: Asia Pacific Smart Home Security Camera Market Volume (Billion), by Shape 2024 & 2032
- Figure 57: Asia Pacific Smart Home Security Camera Market Revenue Share (%), by Shape 2024 & 2032
- Figure 58: Asia Pacific Smart Home Security Camera Market Volume Share (%), by Shape 2024 & 2032
- Figure 59: Asia Pacific Smart Home Security Camera Market Revenue (Million), by Country 2024 & 2032
- Figure 60: Asia Pacific Smart Home Security Camera Market Volume (Billion), by Country 2024 & 2032
- Figure 61: Asia Pacific Smart Home Security Camera Market Revenue Share (%), by Country 2024 & 2032
- Figure 62: Asia Pacific Smart Home Security Camera Market Volume Share (%), by Country 2024 & 2032
- Figure 63: Latin America Smart Home Security Camera Market Revenue (Million), by Type 2024 & 2032
- Figure 64: Latin America Smart Home Security Camera Market Volume (Billion), by Type 2024 & 2032
- Figure 65: Latin America Smart Home Security Camera Market Revenue Share (%), by Type 2024 & 2032
- Figure 66: Latin America Smart Home Security Camera Market Volume Share (%), by Type 2024 & 2032
- Figure 67: Latin America Smart Home Security Camera Market Revenue (Million), by Resolution 2024 & 2032
- Figure 68: Latin America Smart Home Security Camera Market Volume (Billion), by Resolution 2024 & 2032
- Figure 69: Latin America Smart Home Security Camera Market Revenue Share (%), by Resolution 2024 & 2032
- Figure 70: Latin America Smart Home Security Camera Market Volume Share (%), by Resolution 2024 & 2032
- Figure 71: Latin America Smart Home Security Camera Market Revenue (Million), by Location 2024 & 2032
- Figure 72: Latin America Smart Home Security Camera Market Volume (Billion), by Location 2024 & 2032
- Figure 73: Latin America Smart Home Security Camera Market Revenue Share (%), by Location 2024 & 2032
- Figure 74: Latin America Smart Home Security Camera Market Volume Share (%), by Location 2024 & 2032
- Figure 75: Latin America Smart Home Security Camera Market Revenue (Million), by Shape 2024 & 2032
- Figure 76: Latin America Smart Home Security Camera Market Volume (Billion), by Shape 2024 & 2032
- Figure 77: Latin America Smart Home Security Camera Market Revenue Share (%), by Shape 2024 & 2032
- Figure 78: Latin America Smart Home Security Camera Market Volume Share (%), by Shape 2024 & 2032
- Figure 79: Latin America Smart Home Security Camera Market Revenue (Million), by Country 2024 & 2032
- Figure 80: Latin America Smart Home Security Camera Market Volume (Billion), by Country 2024 & 2032
- Figure 81: Latin America Smart Home Security Camera Market Revenue Share (%), by Country 2024 & 2032
- Figure 82: Latin America Smart Home Security Camera Market Volume Share (%), by Country 2024 & 2032
- Figure 83: Middle East and Africa Smart Home Security Camera Market Revenue (Million), by Type 2024 & 2032
- Figure 84: Middle East and Africa Smart Home Security Camera Market Volume (Billion), by Type 2024 & 2032
- Figure 85: Middle East and Africa Smart Home Security Camera Market Revenue Share (%), by Type 2024 & 2032
- Figure 86: Middle East and Africa Smart Home Security Camera Market Volume Share (%), by Type 2024 & 2032
- Figure 87: Middle East and Africa Smart Home Security Camera Market Revenue (Million), by Resolution 2024 & 2032
- Figure 88: Middle East and Africa Smart Home Security Camera Market Volume (Billion), by Resolution 2024 & 2032
- Figure 89: Middle East and Africa Smart Home Security Camera Market Revenue Share (%), by Resolution 2024 & 2032
- Figure 90: Middle East and Africa Smart Home Security Camera Market Volume Share (%), by Resolution 2024 & 2032
- Figure 91: Middle East and Africa Smart Home Security Camera Market Revenue (Million), by Location 2024 & 2032
- Figure 92: Middle East and Africa Smart Home Security Camera Market Volume (Billion), by Location 2024 & 2032
- Figure 93: Middle East and Africa Smart Home Security Camera Market Revenue Share (%), by Location 2024 & 2032
- Figure 94: Middle East and Africa Smart Home Security Camera Market Volume Share (%), by Location 2024 & 2032
- Figure 95: Middle East and Africa Smart Home Security Camera Market Revenue (Million), by Shape 2024 & 2032
- Figure 96: Middle East and Africa Smart Home Security Camera Market Volume (Billion), by Shape 2024 & 2032
- Figure 97: Middle East and Africa Smart Home Security Camera Market Revenue Share (%), by Shape 2024 & 2032
- Figure 98: Middle East and Africa Smart Home Security Camera Market Volume Share (%), by Shape 2024 & 2032
- Figure 99: Middle East and Africa Smart Home Security Camera Market Revenue (Million), by Country 2024 & 2032
- Figure 100: Middle East and Africa Smart Home Security Camera Market Volume (Billion), by Country 2024 & 2032
- Figure 101: Middle East and Africa Smart Home Security Camera Market Revenue Share (%), by Country 2024 & 2032
- Figure 102: Middle East and Africa Smart Home Security Camera Market Volume Share (%), by Country 2024 & 2032
List of Tables
- Table 1: Global Smart Home Security Camera Market Revenue Million Forecast, by Region 2019 & 2032
- Table 2: Global Smart Home Security Camera Market Volume Billion Forecast, by Region 2019 & 2032
- Table 3: Global Smart Home Security Camera Market Revenue Million Forecast, by Type 2019 & 2032
- Table 4: Global Smart Home Security Camera Market Volume Billion Forecast, by Type 2019 & 2032
- Table 5: Global Smart Home Security Camera Market Revenue Million Forecast, by Resolution 2019 & 2032
- Table 6: Global Smart Home Security Camera Market Volume Billion Forecast, by Resolution 2019 & 2032
- Table 7: Global Smart Home Security Camera Market Revenue Million Forecast, by Location 2019 & 2032
- Table 8: Global Smart Home Security Camera Market Volume Billion Forecast, by Location 2019 & 2032
- Table 9: Global Smart Home Security Camera Market Revenue Million Forecast, by Shape 2019 & 2032
- Table 10: Global Smart Home Security Camera Market Volume Billion Forecast, by Shape 2019 & 2032
- Table 11: Global Smart Home Security Camera Market Revenue Million Forecast, by Region 2019 & 2032
- Table 12: Global Smart Home Security Camera Market Volume Billion Forecast, by Region 2019 & 2032
- Table 13: Global Smart Home Security Camera Market Revenue Million Forecast, by Type 2019 & 2032
- Table 14: Global Smart Home Security Camera Market Volume Billion Forecast, by Type 2019 & 2032
- Table 15: Global Smart Home Security Camera Market Revenue Million Forecast, by Resolution 2019 & 2032
- Table 16: Global Smart Home Security Camera Market Volume Billion Forecast, by Resolution 2019 & 2032
- Table 17: Global Smart Home Security Camera Market Revenue Million Forecast, by Location 2019 & 2032
- Table 18: Global Smart Home Security Camera Market Volume Billion Forecast, by Location 2019 & 2032
- Table 19: Global Smart Home Security Camera Market Revenue Million Forecast, by Shape 2019 & 2032
- Table 20: Global Smart Home Security Camera Market Volume Billion Forecast, by Shape 2019 & 2032
- Table 21: Global Smart Home Security Camera Market Revenue Million Forecast, by Country 2019 & 2032
- Table 22: Global Smart Home Security Camera Market Volume Billion Forecast, by Country 2019 & 2032
- Table 23: Global Smart Home Security Camera Market Revenue Million Forecast, by Type 2019 & 2032
- Table 24: Global Smart Home Security Camera Market Volume Billion Forecast, by Type 2019 & 2032
- Table 25: Global Smart Home Security Camera Market Revenue Million Forecast, by Resolution 2019 & 2032
- Table 26: Global Smart Home Security Camera Market Volume Billion Forecast, by Resolution 2019 & 2032
- Table 27: Global Smart Home Security Camera Market Revenue Million Forecast, by Location 2019 & 2032
- Table 28: Global Smart Home Security Camera Market Volume Billion Forecast, by Location 2019 & 2032
- Table 29: Global Smart Home Security Camera Market Revenue Million Forecast, by Shape 2019 & 2032
- Table 30: Global Smart Home Security Camera Market Volume Billion Forecast, by Shape 2019 & 2032
- Table 31: Global Smart Home Security Camera Market Revenue Million Forecast, by Country 2019 & 2032
- Table 32: Global Smart Home Security Camera Market Volume Billion Forecast, by Country 2019 & 2032
- Table 33: Global Smart Home Security Camera Market Revenue Million Forecast, by Type 2019 & 2032
- Table 34: Global Smart Home Security Camera Market Volume Billion Forecast, by Type 2019 & 2032
- Table 35: Global Smart Home Security Camera Market Revenue Million Forecast, by Resolution 2019 & 2032
- Table 36: Global Smart Home Security Camera Market Volume Billion Forecast, by Resolution 2019 & 2032
- Table 37: Global Smart Home Security Camera Market Revenue Million Forecast, by Location 2019 & 2032
- Table 38: Global Smart Home Security Camera Market Volume Billion Forecast, by Location 2019 & 2032
- Table 39: Global Smart Home Security Camera Market Revenue Million Forecast, by Shape 2019 & 2032
- Table 40: Global Smart Home Security Camera Market Volume Billion Forecast, by Shape 2019 & 2032
- Table 41: Global Smart Home Security Camera Market Revenue Million Forecast, by Country 2019 & 2032
- Table 42: Global Smart Home Security Camera Market Volume Billion Forecast, by Country 2019 & 2032
- Table 43: Global Smart Home Security Camera Market Revenue Million Forecast, by Type 2019 & 2032
- Table 44: Global Smart Home Security Camera Market Volume Billion Forecast, by Type 2019 & 2032
- Table 45: Global Smart Home Security Camera Market Revenue Million Forecast, by Resolution 2019 & 2032
- Table 46: Global Smart Home Security Camera Market Volume Billion Forecast, by Resolution 2019 & 2032
- Table 47: Global Smart Home Security Camera Market Revenue Million Forecast, by Location 2019 & 2032
- Table 48: Global Smart Home Security Camera Market Volume Billion Forecast, by Location 2019 & 2032
- Table 49: Global Smart Home Security Camera Market Revenue Million Forecast, by Shape 2019 & 2032
- Table 50: Global Smart Home Security Camera Market Volume Billion Forecast, by Shape 2019 & 2032
- Table 51: Global Smart Home Security Camera Market Revenue Million Forecast, by Country 2019 & 2032
- Table 52: Global Smart Home Security Camera Market Volume Billion Forecast, by Country 2019 & 2032
- Table 53: Global Smart Home Security Camera Market Revenue Million Forecast, by Type 2019 & 2032
- Table 54: Global Smart Home Security Camera Market Volume Billion Forecast, by Type 2019 & 2032
- Table 55: Global Smart Home Security Camera Market Revenue Million Forecast, by Resolution 2019 & 2032
- Table 56: Global Smart Home Security Camera Market Volume Billion Forecast, by Resolution 2019 & 2032
- Table 57: Global Smart Home Security Camera Market Revenue Million Forecast, by Location 2019 & 2032
- Table 58: Global Smart Home Security Camera Market Volume Billion Forecast, by Location 2019 & 2032
- Table 59: Global Smart Home Security Camera Market Revenue Million Forecast, by Shape 2019 & 2032
- Table 60: Global Smart Home Security Camera Market Volume Billion Forecast, by Shape 2019 & 2032
- Table 61: Global Smart Home Security Camera Market Revenue Million Forecast, by Country 2019 & 2032
- Table 62: Global Smart Home Security Camera Market Volume Billion Forecast, by Country 2019 & 2032
Frequently Asked Questions
1. What is the projected Compound Annual Growth Rate (CAGR) of the Smart Home Security Camera Market?
The projected CAGR is approximately 12.78%.
2. Which companies are prominent players in the Smart Home Security Camera Market?
Key companies in the market include Hangzhou Hikvision Digital Technology Co Ltd, FrontPoint Security Solutions Inc, Honeywell International Inc, SimpliSafe Inc, ADT Corporation, Vivint Inc, Netgear Inc, Abode Systems Inc, Panasonic Corporation, Brinks Home Security, Samsung Electronics Co Ltd, Arlo Inc, Wyze Labs Inc, Philips Inc, Logitech Inc, Amcrest Industries LLC, Lorex Corporation, Somfy Inc.
3. What are the main segments of the Smart Home Security Camera Market?
The market segments include Type, Resolution, Location, Shape.
4. Can you provide details about the market size?
The market size is estimated to be USD 7.80 Million as of 2022.
5. What are some drivers contributing to market growth?
Increase in Concern Regarding Home Safety and Security; Growing Concerns About Safety. Evidenced by a Rise in Thefts and Crimes Related to Property..
6. What are the notable trends driving market growth?
Indoor Cameras is Expected to Witness a Significant Growth.
7. Are there any restraints impacting market growth?
Increase in Concern Regarding Home Safety and Security; Growing Concerns About Safety. Evidenced by a Rise in Thefts and Crimes Related to Property..
8. Can you provide examples of recent developments in the market?
May 2024: Yale, a subsidiary of ASSA ABLOY, has introduced its much anticipated Yale Smart Indoor Camera and Yale Smart Outdoor Camera. These new smart devices come equipped with advanced features, ensuring seamless control and compatibility with other Yale products, thereby simplifying smart home security for users. With the Yale Smart Outdoor Camera, homeowners can monitor their property virtually anywhere. The camera boasts 1080p Full HD resolution, an industry-leading 154° field of view, and superior color night vision.
9. What pricing options are available for accessing the report?
Pricing options include single-user, multi-user, and enterprise licenses priced at USD 4750, USD 5250, and USD 8750 respectively.
10. Is the market size provided in terms of value or volume?
The market size is provided in terms of value, measured in Million and volume, measured in Billion.
11. Are there any specific market keywords associated with the report?
Yes, the market keyword associated with the report is "Smart Home Security Camera Market," which aids in identifying and referencing the specific market segment covered.
12. How do I determine which pricing option suits my needs best?
The pricing options vary based on user requirements and access needs. Individual users may opt for single-user licenses, while businesses requiring broader access may choose multi-user or enterprise licenses for cost-effective access to the report.
13. Are there any additional resources or data provided in the Smart Home Security Camera Market report?
While the report offers comprehensive insights, it's advisable to review the specific contents or supplementary materials provided to ascertain if additional resources or data are available.
14. How can I stay updated on further developments or reports in the Smart Home Security Camera Market?
To stay informed about further developments, trends, and reports in the Smart Home Security Camera Market, consider subscribing to industry newsletters, following relevant companies and organizations, or regularly checking reputable industry news sources and publications.
Methodology
Step 1 - Identification of Relevant Samples Size from Population Database


Step 2 - Approaches for Defining Global Market Size (Value, Volume* & Price*)

Note*: In applicable scenarios
Step 3 - Data Sources
Primary Research
- Web Analytics
- Survey Reports
- Research Institute
- Latest Research Reports
- Opinion Leaders
Secondary Research
- Annual Reports
- White Paper
- Latest Press Release
- Industry Association
- Paid Database
- Investor Presentations

Step 4 - Data Triangulation
Involves using different sources of information in order to increase the validity of a study
These sources are likely to be stakeholders in a program - participants, other researchers, program staff, other community members, and so on.
Then we put all data in single framework & apply various statistical tools to find out the dynamic on the market.
During the analysis stage, feedback from the stakeholder groups would be compared to determine areas of agreement as well as areas of divergence


