
Key Insights
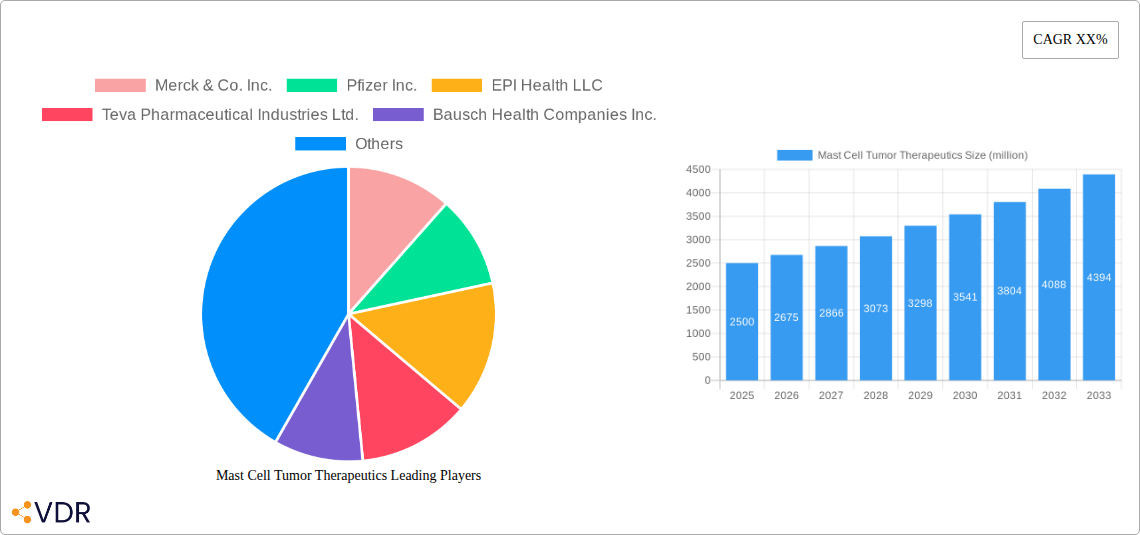
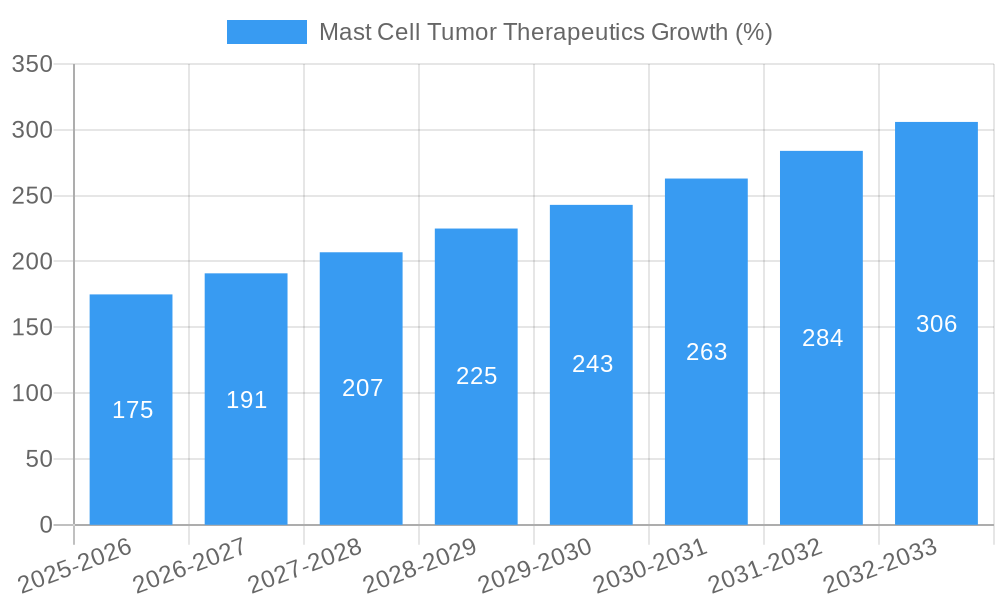
The Mast Cell Tumor Therapeutics market is experiencing robust growth, driven by increasing prevalence of mast cell tumors in both humans and animals, advancements in targeted therapies, and rising healthcare expenditure globally. The market, currently estimated at $2.5 billion in 2025, is projected to exhibit a compound annual growth rate (CAGR) of 7% from 2025 to 2033, reaching an estimated market value of approximately $4.5 billion by 2033. This growth is fueled by several key factors. Firstly, an aging global population increases susceptibility to mast cell tumors. Secondly, the development of novel therapies, including targeted agents and immunotherapies, offers improved treatment outcomes compared to traditional approaches, thereby driving market expansion. Thirdly, the rising awareness and diagnosis rates of mast cell tumors, particularly cutaneous mastocytoma in pets, contribute significantly to the market's growth trajectory. However, challenges remain, including the high cost of advanced therapies, which can limit access for some patients, and the potential for adverse effects associated with certain treatments.
Despite these restraints, the market is segmented by therapeutic modality (e.g., monoclonal antibodies, tyrosine kinase inhibitors, chemotherapy), route of administration (oral, injectable), and application (human, veterinary). Key players like Merck & Co. Inc., Pfizer Inc., and others are continuously engaged in research and development to enhance existing therapies and develop innovative treatment options. The competitive landscape is characterized by strategic alliances, acquisitions, and the introduction of novel therapies. Regional variations in market growth are expected, with North America and Europe likely to retain significant market shares due to higher healthcare spending and greater awareness of mast cell tumor treatments. The future of the mast cell tumor therapeutics market is promising, with ongoing innovation and a growing need for effective treatments driving continued expansion in the coming years.
Mast Cell Tumor Therapeutics Market Report: 2019-2033
This comprehensive report provides an in-depth analysis of the Mast Cell Tumor Therapeutics market, offering invaluable insights for industry professionals, investors, and researchers. Spanning the period 2019-2033, with a focus on 2025, this report meticulously examines market dynamics, growth trends, competitive landscapes, and future opportunities within this critical therapeutic area. The parent market is Oncology therapeutics and the child market is hematological malignancies. The total market size is projected to reach xx million by 2033.
Mast Cell Tumor Therapeutics Market Dynamics & Structure
This section analyzes the market's competitive landscape, technological advancements, regulatory influences, and market trends. We delve into the market concentration, examining the market share held by key players like Merck & Co. Inc., Pfizer Inc., and Novartis AG. The analysis incorporates quantitative data (market share percentages, M&A deal volumes – estimated at xx deals in the historical period) and qualitative assessments of innovation barriers and competitive dynamics.
- Market Concentration: Highly concentrated with top 5 players holding approximately xx% of the market share in 2024.
- Technological Innovation: Significant advancements in targeted therapies and immunotherapies are driving market growth.
- Regulatory Framework: Stringent regulatory pathways influence drug development and market entry. Variations in regulatory approvals across different regions impact market access.
- Competitive Substitutes: Existing treatment options and emerging therapies pose a competitive challenge.
- End-User Demographics: The aging population and rising prevalence of mast cell tumors are key drivers of market expansion.
- M&A Trends: Consolidation within the industry through mergers and acquisitions is expected to continue, shaping the competitive landscape.
Mast Cell Tumor Therapeutics Growth Trends & Insights
This section leverages extensive market research data to provide a comprehensive analysis of market size evolution, adoption rates, technological disruptions, and shifting consumer behavior patterns. The analysis covers the historical period (2019-2024), the base year (2025), and the forecast period (2025-2033). Key metrics such as compound annual growth rate (CAGR) and market penetration are presented to provide detailed insights. The market experienced a CAGR of xx% during 2019-2024 and is projected to grow at a CAGR of xx% from 2025-2033. This growth is primarily fueled by increasing prevalence of mast cell tumors, advancements in targeted therapies, and rising healthcare expenditure. The report analyzes the adoption of novel therapies, identifying factors influencing treatment choices and predicting future trends based on technological advancements and evolving clinical practice.
Dominant Regions, Countries, or Segments in Mast Cell Tumor Therapeutics
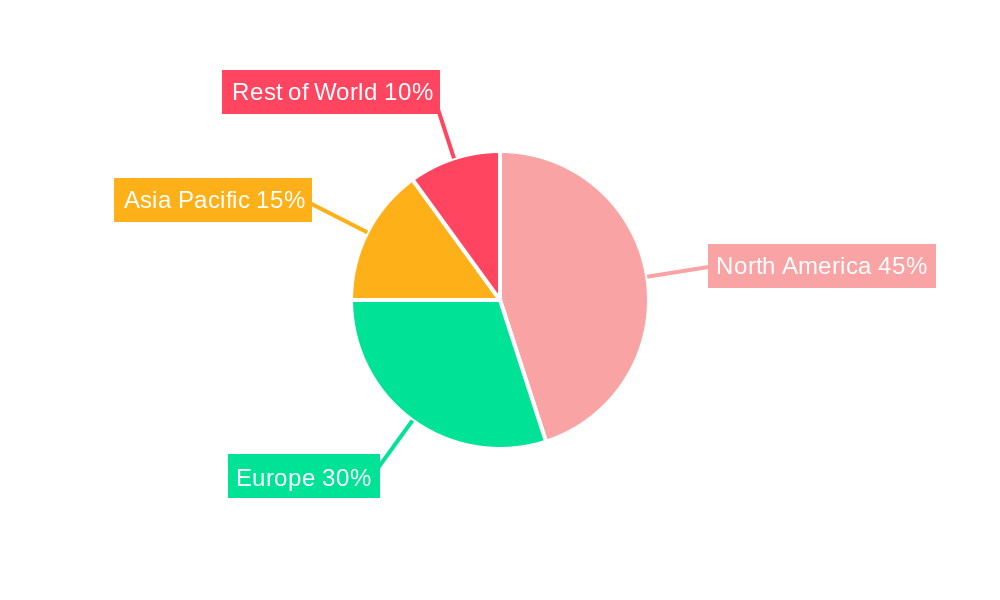
This section identifies the leading regions, countries, and segments driving market growth. The North American market is currently dominant, driven by high healthcare expenditure and advanced healthcare infrastructure. However, the Asia-Pacific region shows significant growth potential due to increasing awareness, rising incidence rates, and expanding healthcare infrastructure.
- North America: High market share driven by advanced healthcare infrastructure, high disposable incomes, and early adoption of new technologies.
- Europe: Moderate growth, influenced by healthcare policies and reimbursement schemes.
- Asia-Pacific: Significant growth potential due to increasing prevalence, rising healthcare expenditure, and growing awareness.
- Rest of the World: Emerging markets contribute to overall market expansion, though at a slower pace.
Mast Cell Tumor Therapeutics Product Landscape
The market features a range of therapeutic approaches, including targeted therapies, immunotherapies, and supportive care medications. Product innovation focuses on improving efficacy, reducing side effects, and expanding treatment options for various mast cell tumor subtypes. Key advancements include the development of novel targeted therapies and immunotherapies showing promising clinical outcomes. These advancements are driving market expansion and improving patient outcomes.
Key Drivers, Barriers & Challenges in Mast Cell Tumor Therapeutics
Key Drivers:
- Rising prevalence of mast cell tumors.
- Technological advancements in targeted therapies and immunotherapies.
- Increasing healthcare expenditure and insurance coverage.
Challenges and Restraints:
- High cost of treatment and limited insurance coverage in some regions.
- Development of drug resistance and treatment limitations.
- Stringent regulatory pathways and long clinical development timelines. The estimated impact of regulatory hurdles on market growth is approximately xx million in lost revenue annually.
Emerging Opportunities in Mast Cell Tumor Therapeutics
- Untapped markets in developing countries.
- Development of personalized medicine approaches targeting specific genetic mutations.
- Innovative combination therapies to enhance treatment efficacy.
Growth Accelerators in the Mast Cell Tumor Therapeutics Industry
Technological breakthroughs in targeted therapies, strategic collaborations between pharmaceutical companies and research institutions, and expansion into emerging markets are key catalysts driving long-term growth. Successful clinical trials of novel therapies will significantly accelerate market expansion. The successful launch of a first-in-class therapy could boost market value by an estimated xx million.
Key Players Shaping the Mast Cell Tumor Therapeutics Market
- Merck & Co. Inc.
- Pfizer Inc.
- EPI Health LLC
- Teva Pharmaceutical Industries Ltd.
- Bausch Health Companies Inc.
- Novartis AG
- Mylan NV
- Bayer AG
- Sanofi S.A.
- Johnson & Johnson
Notable Milestones in Mast Cell Tumor Therapeutics Sector
- 2021-Q3: FDA approval of a novel targeted therapy for advanced mast cell tumors.
- 2022-Q1: Launch of a large-scale clinical trial evaluating a new immunotherapy.
- 2023-Q4: Merck & Co. Inc. acquires a smaller biotech company specializing in mast cell tumor therapeutics for xx million.
In-Depth Mast Cell Tumor Therapeutics Market Outlook
The Mast Cell Tumor Therapeutics market exhibits significant growth potential driven by the factors outlined above. Strategic partnerships, technological advancements, and expansion into emerging markets will shape future market dynamics. The market is poised for substantial expansion over the forecast period, driven by innovation and unmet clinical needs. The anticipated market value in 2033 offers substantial investment opportunities.
Mast Cell Tumor Therapeutics Segmentation
-
1. Application
- 1.1. Hospital Pharmacies
- 1.2. Retail Pharmacies
- 1.3. Others
-
2. Types
- 2.1. Oral
- 2.2. Injectables
Mast Cell Tumor Therapeutics Segmentation By Geography
-
1. North America
- 1.1. United States
- 1.2. Canada
- 1.3. Mexico
-
2. South America
- 2.1. Brazil
- 2.2. Argentina
- 2.3. Rest of South America
-
3. Europe
- 3.1. United Kingdom
- 3.2. Germany
- 3.3. France
- 3.4. Italy
- 3.5. Spain
- 3.6. Russia
- 3.7. Benelux
- 3.8. Nordics
- 3.9. Rest of Europe
-
4. Middle East & Africa
- 4.1. Turkey
- 4.2. Israel
- 4.3. GCC
- 4.4. North Africa
- 4.5. South Africa
- 4.6. Rest of Middle East & Africa
-
5. Asia Pacific
- 5.1. China
- 5.2. India
- 5.3. Japan
- 5.4. South Korea
- 5.5. ASEAN
- 5.6. Oceania
- 5.7. Rest of Asia Pacific
Mast Cell Tumor Therapeutics REPORT HIGHLIGHTS
| Aspects | Details |
|---|---|
| Study Period | 2019-2033 |
| Base Year | 2024 |
| Estimated Year | 2025 |
| Forecast Period | 2025-2033 |
| Historical Period | 2019-2024 |
| Growth Rate | CAGR of XX% from 2019-2033 |
| Segmentation |
|
Table of Contents
- 1. Introduction
- 1.1. Research Scope
- 1.2. Market Segmentation
- 1.3. Research Methodology
- 1.4. Definitions and Assumptions
- 2. Executive Summary
- 2.1. Introduction
- 3. Market Dynamics
- 3.1. Introduction
- 3.2. Market Drivers
- 3.3. Market Restrains
- 3.4. Market Trends
- 4. Market Factor Analysis
- 4.1. Porters Five Forces
- 4.2. Supply/Value Chain
- 4.3. PESTEL analysis
- 4.4. Market Entropy
- 4.5. Patent/Trademark Analysis
- 5. Global Mast Cell Tumor Therapeutics Analysis, Insights and Forecast, 2019-2031
- 5.1. Market Analysis, Insights and Forecast - by Application
- 5.1.1. Hospital Pharmacies
- 5.1.2. Retail Pharmacies
- 5.1.3. Others
- 5.2. Market Analysis, Insights and Forecast - by Types
- 5.2.1. Oral
- 5.2.2. Injectables
- 5.3. Market Analysis, Insights and Forecast - by Region
- 5.3.1. North America
- 5.3.2. South America
- 5.3.3. Europe
- 5.3.4. Middle East & Africa
- 5.3.5. Asia Pacific
- 5.1. Market Analysis, Insights and Forecast - by Application
- 6. North America Mast Cell Tumor Therapeutics Analysis, Insights and Forecast, 2019-2031
- 6.1. Market Analysis, Insights and Forecast - by Application
- 6.1.1. Hospital Pharmacies
- 6.1.2. Retail Pharmacies
- 6.1.3. Others
- 6.2. Market Analysis, Insights and Forecast - by Types
- 6.2.1. Oral
- 6.2.2. Injectables
- 6.1. Market Analysis, Insights and Forecast - by Application
- 7. South America Mast Cell Tumor Therapeutics Analysis, Insights and Forecast, 2019-2031
- 7.1. Market Analysis, Insights and Forecast - by Application
- 7.1.1. Hospital Pharmacies
- 7.1.2. Retail Pharmacies
- 7.1.3. Others
- 7.2. Market Analysis, Insights and Forecast - by Types
- 7.2.1. Oral
- 7.2.2. Injectables
- 7.1. Market Analysis, Insights and Forecast - by Application
- 8. Europe Mast Cell Tumor Therapeutics Analysis, Insights and Forecast, 2019-2031
- 8.1. Market Analysis, Insights and Forecast - by Application
- 8.1.1. Hospital Pharmacies
- 8.1.2. Retail Pharmacies
- 8.1.3. Others
- 8.2. Market Analysis, Insights and Forecast - by Types
- 8.2.1. Oral
- 8.2.2. Injectables
- 8.1. Market Analysis, Insights and Forecast - by Application
- 9. Middle East & Africa Mast Cell Tumor Therapeutics Analysis, Insights and Forecast, 2019-2031
- 9.1. Market Analysis, Insights and Forecast - by Application
- 9.1.1. Hospital Pharmacies
- 9.1.2. Retail Pharmacies
- 9.1.3. Others
- 9.2. Market Analysis, Insights and Forecast - by Types
- 9.2.1. Oral
- 9.2.2. Injectables
- 9.1. Market Analysis, Insights and Forecast - by Application
- 10. Asia Pacific Mast Cell Tumor Therapeutics Analysis, Insights and Forecast, 2019-2031
- 10.1. Market Analysis, Insights and Forecast - by Application
- 10.1.1. Hospital Pharmacies
- 10.1.2. Retail Pharmacies
- 10.1.3. Others
- 10.2. Market Analysis, Insights and Forecast - by Types
- 10.2.1. Oral
- 10.2.2. Injectables
- 10.1. Market Analysis, Insights and Forecast - by Application
- 11. Competitive Analysis
- 11.1. Global Market Share Analysis 2024
- 11.2. Company Profiles
- 11.2.1 Merck & Co. Inc.
- 11.2.1.1. Overview
- 11.2.1.2. Products
- 11.2.1.3. SWOT Analysis
- 11.2.1.4. Recent Developments
- 11.2.1.5. Financials (Based on Availability)
- 11.2.2 Pfizer Inc.
- 11.2.2.1. Overview
- 11.2.2.2. Products
- 11.2.2.3. SWOT Analysis
- 11.2.2.4. Recent Developments
- 11.2.2.5. Financials (Based on Availability)
- 11.2.3 EPI Health LLC
- 11.2.3.1. Overview
- 11.2.3.2. Products
- 11.2.3.3. SWOT Analysis
- 11.2.3.4. Recent Developments
- 11.2.3.5. Financials (Based on Availability)
- 11.2.4 Teva Pharmaceutical Industries Ltd.
- 11.2.4.1. Overview
- 11.2.4.2. Products
- 11.2.4.3. SWOT Analysis
- 11.2.4.4. Recent Developments
- 11.2.4.5. Financials (Based on Availability)
- 11.2.5 Bausch Health Companies Inc.
- 11.2.5.1. Overview
- 11.2.5.2. Products
- 11.2.5.3. SWOT Analysis
- 11.2.5.4. Recent Developments
- 11.2.5.5. Financials (Based on Availability)
- 11.2.6 Novartis AG
- 11.2.6.1. Overview
- 11.2.6.2. Products
- 11.2.6.3. SWOT Analysis
- 11.2.6.4. Recent Developments
- 11.2.6.5. Financials (Based on Availability)
- 11.2.7 Mylan NV
- 11.2.7.1. Overview
- 11.2.7.2. Products
- 11.2.7.3. SWOT Analysis
- 11.2.7.4. Recent Developments
- 11.2.7.5. Financials (Based on Availability)
- 11.2.8 Bayer AG
- 11.2.8.1. Overview
- 11.2.8.2. Products
- 11.2.8.3. SWOT Analysis
- 11.2.8.4. Recent Developments
- 11.2.8.5. Financials (Based on Availability)
- 11.2.9 Sanofi S.A.
- 11.2.9.1. Overview
- 11.2.9.2. Products
- 11.2.9.3. SWOT Analysis
- 11.2.9.4. Recent Developments
- 11.2.9.5. Financials (Based on Availability)
- 11.2.10 Johnson & Johnson
- 11.2.10.1. Overview
- 11.2.10.2. Products
- 11.2.10.3. SWOT Analysis
- 11.2.10.4. Recent Developments
- 11.2.10.5. Financials (Based on Availability)
- 11.2.1 Merck & Co. Inc.
List of Figures
- Figure 1: Global Mast Cell Tumor Therapeutics Revenue Breakdown (million, %) by Region 2024 & 2032
- Figure 2: North America Mast Cell Tumor Therapeutics Revenue (million), by Application 2024 & 2032
- Figure 3: North America Mast Cell Tumor Therapeutics Revenue Share (%), by Application 2024 & 2032
- Figure 4: North America Mast Cell Tumor Therapeutics Revenue (million), by Types 2024 & 2032
- Figure 5: North America Mast Cell Tumor Therapeutics Revenue Share (%), by Types 2024 & 2032
- Figure 6: North America Mast Cell Tumor Therapeutics Revenue (million), by Country 2024 & 2032
- Figure 7: North America Mast Cell Tumor Therapeutics Revenue Share (%), by Country 2024 & 2032
- Figure 8: South America Mast Cell Tumor Therapeutics Revenue (million), by Application 2024 & 2032
- Figure 9: South America Mast Cell Tumor Therapeutics Revenue Share (%), by Application 2024 & 2032
- Figure 10: South America Mast Cell Tumor Therapeutics Revenue (million), by Types 2024 & 2032
- Figure 11: South America Mast Cell Tumor Therapeutics Revenue Share (%), by Types 2024 & 2032
- Figure 12: South America Mast Cell Tumor Therapeutics Revenue (million), by Country 2024 & 2032
- Figure 13: South America Mast Cell Tumor Therapeutics Revenue Share (%), by Country 2024 & 2032
- Figure 14: Europe Mast Cell Tumor Therapeutics Revenue (million), by Application 2024 & 2032
- Figure 15: Europe Mast Cell Tumor Therapeutics Revenue Share (%), by Application 2024 & 2032
- Figure 16: Europe Mast Cell Tumor Therapeutics Revenue (million), by Types 2024 & 2032
- Figure 17: Europe Mast Cell Tumor Therapeutics Revenue Share (%), by Types 2024 & 2032
- Figure 18: Europe Mast Cell Tumor Therapeutics Revenue (million), by Country 2024 & 2032
- Figure 19: Europe Mast Cell Tumor Therapeutics Revenue Share (%), by Country 2024 & 2032
- Figure 20: Middle East & Africa Mast Cell Tumor Therapeutics Revenue (million), by Application 2024 & 2032
- Figure 21: Middle East & Africa Mast Cell Tumor Therapeutics Revenue Share (%), by Application 2024 & 2032
- Figure 22: Middle East & Africa Mast Cell Tumor Therapeutics Revenue (million), by Types 2024 & 2032
- Figure 23: Middle East & Africa Mast Cell Tumor Therapeutics Revenue Share (%), by Types 2024 & 2032
- Figure 24: Middle East & Africa Mast Cell Tumor Therapeutics Revenue (million), by Country 2024 & 2032
- Figure 25: Middle East & Africa Mast Cell Tumor Therapeutics Revenue Share (%), by Country 2024 & 2032
- Figure 26: Asia Pacific Mast Cell Tumor Therapeutics Revenue (million), by Application 2024 & 2032
- Figure 27: Asia Pacific Mast Cell Tumor Therapeutics Revenue Share (%), by Application 2024 & 2032
- Figure 28: Asia Pacific Mast Cell Tumor Therapeutics Revenue (million), by Types 2024 & 2032
- Figure 29: Asia Pacific Mast Cell Tumor Therapeutics Revenue Share (%), by Types 2024 & 2032
- Figure 30: Asia Pacific Mast Cell Tumor Therapeutics Revenue (million), by Country 2024 & 2032
- Figure 31: Asia Pacific Mast Cell Tumor Therapeutics Revenue Share (%), by Country 2024 & 2032
List of Tables
- Table 1: Global Mast Cell Tumor Therapeutics Revenue million Forecast, by Region 2019 & 2032
- Table 2: Global Mast Cell Tumor Therapeutics Revenue million Forecast, by Application 2019 & 2032
- Table 3: Global Mast Cell Tumor Therapeutics Revenue million Forecast, by Types 2019 & 2032
- Table 4: Global Mast Cell Tumor Therapeutics Revenue million Forecast, by Region 2019 & 2032
- Table 5: Global Mast Cell Tumor Therapeutics Revenue million Forecast, by Application 2019 & 2032
- Table 6: Global Mast Cell Tumor Therapeutics Revenue million Forecast, by Types 2019 & 2032
- Table 7: Global Mast Cell Tumor Therapeutics Revenue million Forecast, by Country 2019 & 2032
- Table 8: United States Mast Cell Tumor Therapeutics Revenue (million) Forecast, by Application 2019 & 2032
- Table 9: Canada Mast Cell Tumor Therapeutics Revenue (million) Forecast, by Application 2019 & 2032
- Table 10: Mexico Mast Cell Tumor Therapeutics Revenue (million) Forecast, by Application 2019 & 2032
- Table 11: Global Mast Cell Tumor Therapeutics Revenue million Forecast, by Application 2019 & 2032
- Table 12: Global Mast Cell Tumor Therapeutics Revenue million Forecast, by Types 2019 & 2032
- Table 13: Global Mast Cell Tumor Therapeutics Revenue million Forecast, by Country 2019 & 2032
- Table 14: Brazil Mast Cell Tumor Therapeutics Revenue (million) Forecast, by Application 2019 & 2032
- Table 15: Argentina Mast Cell Tumor Therapeutics Revenue (million) Forecast, by Application 2019 & 2032
- Table 16: Rest of South America Mast Cell Tumor Therapeutics Revenue (million) Forecast, by Application 2019 & 2032
- Table 17: Global Mast Cell Tumor Therapeutics Revenue million Forecast, by Application 2019 & 2032
- Table 18: Global Mast Cell Tumor Therapeutics Revenue million Forecast, by Types 2019 & 2032
- Table 19: Global Mast Cell Tumor Therapeutics Revenue million Forecast, by Country 2019 & 2032
- Table 20: United Kingdom Mast Cell Tumor Therapeutics Revenue (million) Forecast, by Application 2019 & 2032
- Table 21: Germany Mast Cell Tumor Therapeutics Revenue (million) Forecast, by Application 2019 & 2032
- Table 22: France Mast Cell Tumor Therapeutics Revenue (million) Forecast, by Application 2019 & 2032
- Table 23: Italy Mast Cell Tumor Therapeutics Revenue (million) Forecast, by Application 2019 & 2032
- Table 24: Spain Mast Cell Tumor Therapeutics Revenue (million) Forecast, by Application 2019 & 2032
- Table 25: Russia Mast Cell Tumor Therapeutics Revenue (million) Forecast, by Application 2019 & 2032
- Table 26: Benelux Mast Cell Tumor Therapeutics Revenue (million) Forecast, by Application 2019 & 2032
- Table 27: Nordics Mast Cell Tumor Therapeutics Revenue (million) Forecast, by Application 2019 & 2032
- Table 28: Rest of Europe Mast Cell Tumor Therapeutics Revenue (million) Forecast, by Application 2019 & 2032
- Table 29: Global Mast Cell Tumor Therapeutics Revenue million Forecast, by Application 2019 & 2032
- Table 30: Global Mast Cell Tumor Therapeutics Revenue million Forecast, by Types 2019 & 2032
- Table 31: Global Mast Cell Tumor Therapeutics Revenue million Forecast, by Country 2019 & 2032
- Table 32: Turkey Mast Cell Tumor Therapeutics Revenue (million) Forecast, by Application 2019 & 2032
- Table 33: Israel Mast Cell Tumor Therapeutics Revenue (million) Forecast, by Application 2019 & 2032
- Table 34: GCC Mast Cell Tumor Therapeutics Revenue (million) Forecast, by Application 2019 & 2032
- Table 35: North Africa Mast Cell Tumor Therapeutics Revenue (million) Forecast, by Application 2019 & 2032
- Table 36: South Africa Mast Cell Tumor Therapeutics Revenue (million) Forecast, by Application 2019 & 2032
- Table 37: Rest of Middle East & Africa Mast Cell Tumor Therapeutics Revenue (million) Forecast, by Application 2019 & 2032
- Table 38: Global Mast Cell Tumor Therapeutics Revenue million Forecast, by Application 2019 & 2032
- Table 39: Global Mast Cell Tumor Therapeutics Revenue million Forecast, by Types 2019 & 2032
- Table 40: Global Mast Cell Tumor Therapeutics Revenue million Forecast, by Country 2019 & 2032
- Table 41: China Mast Cell Tumor Therapeutics Revenue (million) Forecast, by Application 2019 & 2032
- Table 42: India Mast Cell Tumor Therapeutics Revenue (million) Forecast, by Application 2019 & 2032
- Table 43: Japan Mast Cell Tumor Therapeutics Revenue (million) Forecast, by Application 2019 & 2032
- Table 44: South Korea Mast Cell Tumor Therapeutics Revenue (million) Forecast, by Application 2019 & 2032
- Table 45: ASEAN Mast Cell Tumor Therapeutics Revenue (million) Forecast, by Application 2019 & 2032
- Table 46: Oceania Mast Cell Tumor Therapeutics Revenue (million) Forecast, by Application 2019 & 2032
- Table 47: Rest of Asia Pacific Mast Cell Tumor Therapeutics Revenue (million) Forecast, by Application 2019 & 2032
Frequently Asked Questions
1. What is the projected Compound Annual Growth Rate (CAGR) of the Mast Cell Tumor Therapeutics?
The projected CAGR is approximately XX%.
2. Which companies are prominent players in the Mast Cell Tumor Therapeutics?
Key companies in the market include Merck & Co. Inc., Pfizer Inc., EPI Health LLC, Teva Pharmaceutical Industries Ltd., Bausch Health Companies Inc., Novartis AG, Mylan NV, Bayer AG, Sanofi S.A., Johnson & Johnson.
3. What are the main segments of the Mast Cell Tumor Therapeutics?
The market segments include Application, Types.
4. Can you provide details about the market size?
The market size is estimated to be USD XXX million as of 2022.
5. What are some drivers contributing to market growth?
N/A
6. What are the notable trends driving market growth?
N/A
7. Are there any restraints impacting market growth?
N/A
8. Can you provide examples of recent developments in the market?
N/A
9. What pricing options are available for accessing the report?
Pricing options include single-user, multi-user, and enterprise licenses priced at USD 3950.00, USD 5925.00, and USD 7900.00 respectively.
10. Is the market size provided in terms of value or volume?
The market size is provided in terms of value, measured in million.
11. Are there any specific market keywords associated with the report?
Yes, the market keyword associated with the report is "Mast Cell Tumor Therapeutics," which aids in identifying and referencing the specific market segment covered.
12. How do I determine which pricing option suits my needs best?
The pricing options vary based on user requirements and access needs. Individual users may opt for single-user licenses, while businesses requiring broader access may choose multi-user or enterprise licenses for cost-effective access to the report.
13. Are there any additional resources or data provided in the Mast Cell Tumor Therapeutics report?
While the report offers comprehensive insights, it's advisable to review the specific contents or supplementary materials provided to ascertain if additional resources or data are available.
14. How can I stay updated on further developments or reports in the Mast Cell Tumor Therapeutics?
To stay informed about further developments, trends, and reports in the Mast Cell Tumor Therapeutics, consider subscribing to industry newsletters, following relevant companies and organizations, or regularly checking reputable industry news sources and publications.
Methodology
Step 1 - Identification of Relevant Samples Size from Population Database


Step 2 - Approaches for Defining Global Market Size (Value, Volume* & Price*)

Note*: In applicable scenarios
Step 3 - Data Sources
Primary Research
- Web Analytics
- Survey Reports
- Research Institute
- Latest Research Reports
- Opinion Leaders
Secondary Research
- Annual Reports
- White Paper
- Latest Press Release
- Industry Association
- Paid Database
- Investor Presentations

Step 4 - Data Triangulation
Involves using different sources of information in order to increase the validity of a study
These sources are likely to be stakeholders in a program - participants, other researchers, program staff, other community members, and so on.
Then we put all data in single framework & apply various statistical tools to find out the dynamic on the market.
During the analysis stage, feedback from the stakeholder groups would be compared to determine areas of agreement as well as areas of divergence


