

Key Insights
The global Cancer Immunotherapy market is poised for significant expansion, with an estimated market size of USD 153.27 billion by 2025, and a projected Compound Annual Growth Rate (CAGR) of 9.02%. This growth is driven by advancements in therapeutic technologies, including enhanced monoclonal antibodies and promising cancer vaccines. The rising incidence of cancers such as breast, lung, and skin cancer, coupled with increasing global cancer rates, underscores the need for innovative treatments. Immunotherapy is emerging as a vital component of modern oncology. Increased awareness of immunotherapy benefits, such as fewer side effects and improved long-term survival compared to conventional treatments, is a key market driver. Substantial R&D investment by leading pharmaceutical and biotechnology firms is continuously introducing new immunotherapeutic agents, fueling market growth.
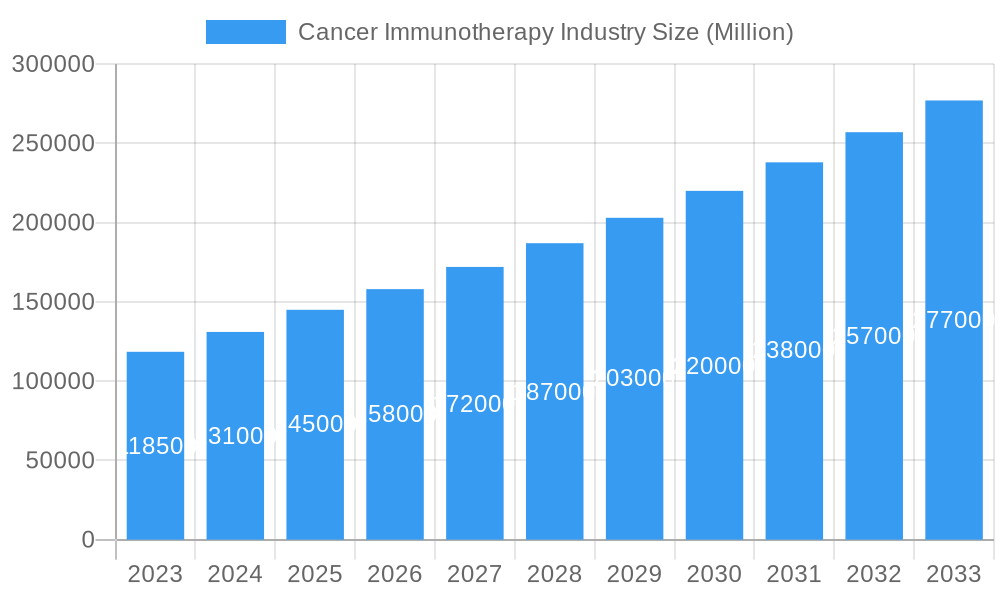
Cancer Immunotherapy Industry Market Size (In Billion)
The market's expansion is further supported by a supportive regulatory environment in major regions and the increasing adoption of these advanced therapies in healthcare facilities globally. While significant opportunities exist, challenges such as the high cost of certain immunotherapies and potential side effects are acknowledged. Ongoing efforts to refine treatment protocols and develop more affordable options are expected to address these limitations. Key segments contributing to this growth include immune checkpoint inhibitors and monoclonal antibodies, which have shown considerable success in treating various cancers. North America and Europe currently dominate the market, attributed to their advanced healthcare infrastructure and robust R&D investment. However, the Asia Pacific region is anticipated to experience the most rapid growth, driven by its developing healthcare sector, rising disposable incomes, and increasing cancer burden.
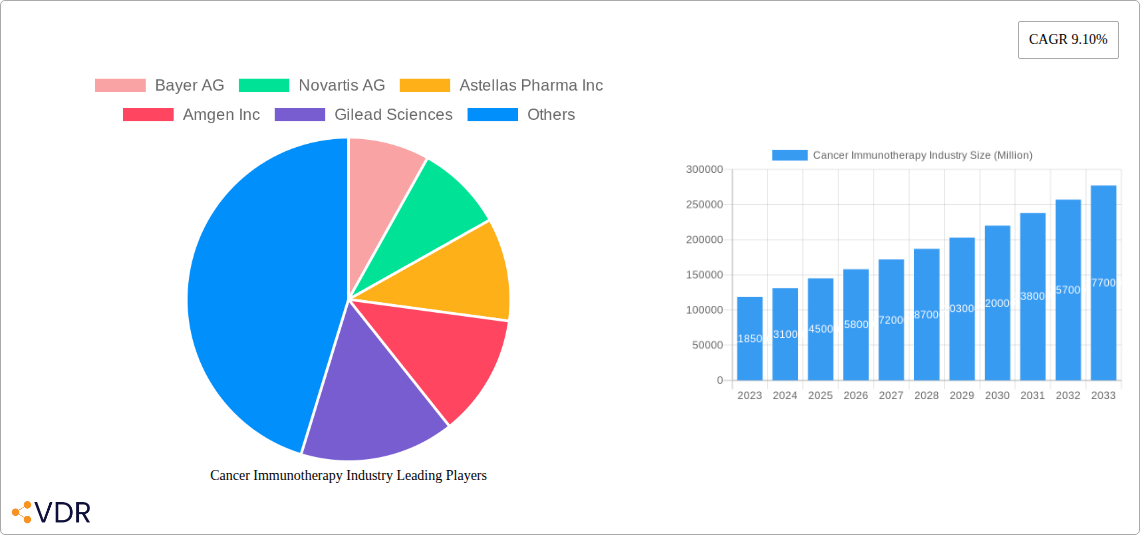
Cancer Immunotherapy Industry Company Market Share
This comprehensive market research report delivers an in-depth analysis of the global cancer immunotherapy market, providing critical insights into its current state, future outlook, and primary growth catalysts. Covering the forecast period up to 2033, with a base year of 2025, this report is an essential resource for stakeholders aiming to comprehend the dynamics of this rapidly evolving sector.
Cancer Immunotherapy Industry Market Dynamics & Structure
The global cancer immunotherapy market is characterized by a moderately concentrated structure, driven by significant investments in research and development and increasing clinical approvals for novel therapies. Technological innovation is a paramount driver, with continuous advancements in understanding tumor microenvironments and immune system modulation leading to more effective and targeted treatments. The robust regulatory frameworks established by bodies like the FDA and EMA, while stringent, provide a clear pathway for drug development and market entry. However, the market faces competition from established oncology treatments such as chemotherapy and radiation therapy, necessitating continuous innovation and demonstration of superior efficacy and safety profiles for cancer immunotherapy drugs. End-user demographics are shifting, with an aging global population and increasing cancer incidence fueling demand. Mergers and acquisitions (M&A) are prevalent, as larger pharmaceutical companies seek to bolster their oncology portfolios and gain access to innovative pipeline assets.
- Market Concentration: Moderate, with a few key players holding significant market share.
- Technological Innovation Drivers: Advances in CAR T-cell therapy, bispecific antibodies, and personalized vaccines.
- Regulatory Frameworks: Strict but supportive, encouraging innovation with clear approval pathways.
- Competitive Substitutes: Chemotherapy, radiation therapy, targeted therapies.
- End-User Demographics: Growing patient populations due to aging and increased cancer diagnosis rates.
- M&A Trends: Active M&A landscape to acquire innovative technologies and expand market reach. Expected M&A deal volume in the forecast period is approximately 150-200 Million units.
Cancer Immunotherapy Industry Growth Trends & Insights
The cancer immunotherapy market is poised for substantial growth, driven by a confluence of factors including increasing cancer prevalence, advancements in scientific understanding of the immune system, and supportive government initiatives. The market size evolution is projected to witness a Compound Annual Growth Rate (CAGR) of approximately 15.2% from 2025 to 2033, escalating from an estimated cancer immunotherapy market size of $65,000 Million units in 2025 to over $190,000 Million units by 2033. Adoption rates of immunotherapy for cancer are rapidly increasing across various cancer types, fueled by their proven efficacy in treating previously intractable malignancies. Technological disruptions, such as the development of novel immune checkpoint inhibitors and engineered T-cell therapies, are reshaping treatment paradigms. Consumer behavior shifts are also playing a crucial role, with patients and healthcare providers increasingly seeking less toxic and more durable treatment options. The market penetration of cancer immunotherapies is expected to rise significantly as more indications are approved and real-world evidence supports their benefits. The development of personalized cancer vaccines and combination therapies represents a significant trend, aiming to enhance treatment responses and overcome resistance mechanisms. The growing emphasis on precision medicine and the identification of predictive biomarkers are further accelerating the adoption of these advanced therapies.
Dominant Regions, Countries, or Segments in Cancer Immunotherapy Industry
North America, particularly the United States, currently dominates the cancer immunotherapy market due to its advanced healthcare infrastructure, high R&D spending, and early adoption of novel therapies. The region's dominance is further bolstered by a favorable regulatory environment and a high incidence of cancer diagnoses. Within the global cancer immunotherapy market, Immune Check Point Inhibitors represent the largest segment by therapy type, accounting for approximately 45% of the market share in 2025, driven by their broad applicability across numerous cancer types like lung cancer and skin cancer. Lung cancer is also a leading application, contributing over 30% to the overall market revenue in 2025, owing to the significant number of patients and the efficacy of immunotherapies in this disease. Hospitals and Clinics are the primary end-users, consuming approximately 60% of the cancer immunotherapy products, due to their established infrastructure for administering complex treatments.
- Dominant Region: North America, with the United States leading in market share and innovation.
- Leading Therapy Type: Immune Check Point Inhibitors (approx. 45% market share in 2025).
- Leading Application: Lung Cancer (over 30% market share in 2025).
- Primary End User: Hospitals and Clinics (approx. 60% market share in 2025).
- Key Drivers in North America: High R&D investment, robust clinical trial activity, strong reimbursement policies, and a high prevalence of cancer.
- Growth Potential in Immune Check Point Inhibitors: Continued expansion into new cancer indications and combination therapies.
- Future Growth in Lung Cancer: Ongoing clinical trials for first-line treatments and adjuvant therapies.
- End User Infrastructure: Well-equipped hospitals and clinics capable of managing immunotherapy side effects.
Cancer Immunotherapy Industry Product Landscape
The cancer immunotherapy product landscape is characterized by a dynamic influx of innovative therapies. Monoclonal antibodies, particularly immune checkpoint inhibitors like PD-1 and PD-L1 blockers, continue to dominate, offering significant clinical benefits across various malignancies. Cancer vaccines, both therapeutic and prophylactic, are gaining traction, with advancements in mRNA and viral vector platforms promising enhanced efficacy. Immunomodulators, including cytokines and oncolytic viruses, are being explored for their synergistic potential with other immunotherapies. The unique selling propositions of these products lie in their ability to harness the patient's own immune system to fight cancer, leading to potentially durable responses and improved quality of life. Technological advancements in genetic engineering and targeted drug delivery are paving the way for next-generation immunotherapy treatments.
Key Drivers, Barriers & Challenges in Cancer Immunotherapy Industry
The cancer immunotherapy industry is propelled by several key drivers. Technological advancements in understanding immune evasion mechanisms and developing novel targets are primary. Increasing cancer incidence globally, coupled with a growing demand for more effective and less toxic treatments than traditional chemotherapy, further fuels market growth. Supportive government initiatives and substantial R&D investments from pharmaceutical giants are also critical.
However, the market faces significant challenges and barriers. High development costs and lengthy clinical trial timelines can impede the pace of innovation. Stringent regulatory approvals and the need for extensive post-market surveillance add to the complexity. The high cost of immunotherapy drugs can limit patient access, especially in developing economies, leading to reimbursement challenges. Furthermore, the emergence of treatment resistance and potential immune-related adverse events necessitate ongoing research and careful patient management.
Emerging Opportunities in Cancer Immunotherapy Industry
Emerging opportunities within the cancer immunotherapy market are abundant. The development of personalized cancer vaccines tailored to individual tumor neoantigens holds immense promise for improving treatment efficacy and reducing side effects. Combination therapies, integrating different immunotherapy agents or combining immunotherapy with targeted therapies and chemotherapy, are expected to unlock new treatment avenues. Untapped markets in emerging economies present significant growth potential as healthcare infrastructure and awareness improve. The application of cancer immunotherapy to rarer cancers and pediatric malignancies also represents a growing frontier. Evolving consumer preferences towards less toxic and more durable treatment options will continue to drive demand.
Growth Accelerators in the Cancer Immunotherapy Industry Industry
Several catalysts are accelerating the long-term growth of the cancer immunotherapy industry. Breakthroughs in areas like CAR T-cell therapy for solid tumors and the development of bispecific antibodies are expanding the therapeutic landscape. Strategic partnerships between academic institutions and biopharmaceutical companies are fostering innovation and accelerating the translation of research into clinical applications. Market expansion strategies, including the pursuit of new indications for existing drugs and global market penetration efforts, are also contributing significantly. The increasing understanding of the tumor microenvironment and the development of novel adjuvants to enhance immune responses are further poised to drive sustained growth.
Key Players Shaping the Cancer Immunotherapy Industry Market
- Bayer AG
- Novartis AG
- Astellas Pharma Inc
- Amgen Inc
- Gilead Sciences
- OSE Immunotherapeutics
- Seattle Genetics Inc
- AstraZeneca PLC
- Eli Lilly and Company
- Bristol-Myers Squibb
- Merck and Co Inc
- GlaxoSmithKline PLC
- F Hoffman La Roche Ltd
- Pfizer Inc
Notable Milestones in Cancer Immunotherapy Industry Sector
- 2019: FDA approval of nivolumab and ipilimumab combination for unresectable malignant pleural mesothelioma.
- 2020: EMA approval of axicabtagene ciloleucel for certain types of lymphoma.
- 2021: Significant advancements in CAR T-cell therapy for hematological malignancies, with several new approvals and expanded indications.
- 2022: Increased focus on developing and testing novel bispecific antibodies targeting multiple immune pathways.
- 2023: Promising early-stage clinical trial results for personalized neoantigen vaccines in various solid tumors.
- 2024: Growing interest and investment in oncolytic virus therapies as combination treatments.
In-Depth Cancer Immunotherapy Industry Market Outlook
The cancer immunotherapy market is projected for robust and sustained growth in the coming years. Key growth accelerators, including technological breakthroughs in cellular therapies, expanded indications for existing drugs, and strategic collaborations, will continue to propel the market forward. The increasing prevalence of cancer globally and a growing patient preference for immunotherapies over traditional treatments will underpin this expansion. Strategic opportunities lie in developing cost-effective therapies, expanding access to emerging markets, and leveraging artificial intelligence for drug discovery and patient stratification. The future of cancer immunotherapy is bright, promising more effective and durable treatment options for patients worldwide.
Cancer Immunotherapy Industry Segmentation
-
1. Therapy Type
- 1.1. Monoclonal Antibodies
- 1.2. Cancer Vaccines
- 1.3. Immunomodulators
- 1.4. Immune Check Point Inhibitors
- 1.5. Other Therapy Types
-
2. Application
- 2.1. Prostate Cancer
- 2.2. Breast Cancer
- 2.3. Skin Cancer
- 2.4. Lung Cancer
- 2.5. Other Applications
-
3. End Users
- 3.1. Hospitals and Clinics
- 3.2. Cancer Research Centers
- 3.3. Other End Users
Cancer Immunotherapy Industry Segmentation By Geography
-
1. North America
- 1.1. United States
- 1.2. Canada
- 1.3. Mexico
-
2. Europe
- 2.1. Germany
- 2.2. United Kingdom
- 2.3. France
- 2.4. Italy
- 2.5. Spain
- 2.6. Rest of Europe
-
3. Asia Pacific
- 3.1. China
- 3.2. Japan
- 3.3. India
- 3.4. Australia
- 3.5. South Korea
- 3.6. Rest of Asia Pacific
-
4. Middle East and Africa
- 4.1. GCC
- 4.2. South Africa
- 4.3. Rest of Middle East and Africa
-
5. South America
- 5.1. Brazil
- 5.2. Argentina
- 5.3. Rest of South America
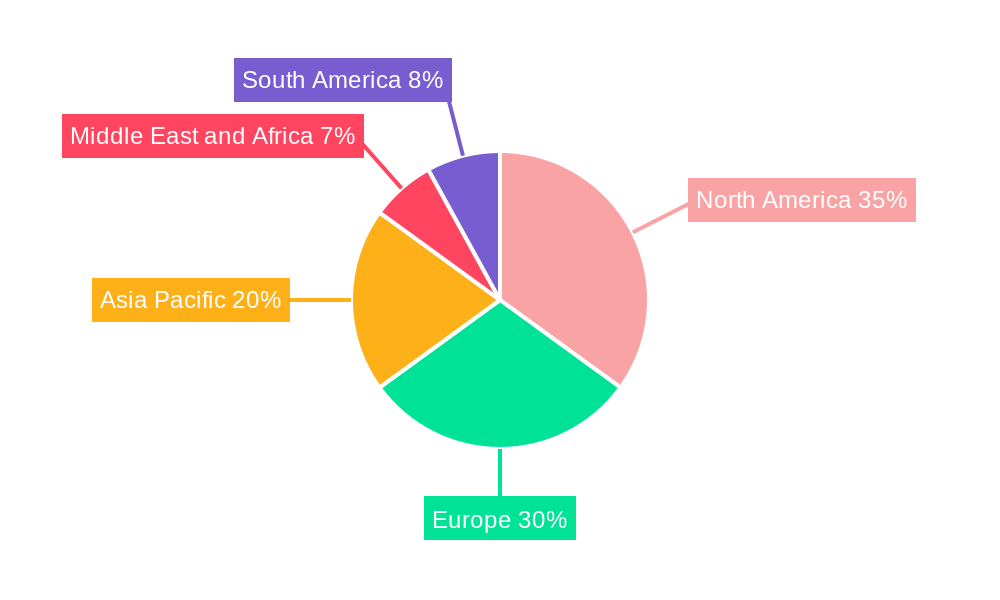
Cancer Immunotherapy Industry Regional Market Share
Geographic Coverage of Cancer Immunotherapy Industry
Cancer Immunotherapy Industry REPORT HIGHLIGHTS
| Aspects | Details |
|---|---|
| Study Period | 2020-2034 |
| Base Year | 2025 |
| Estimated Year | 2026 |
| Forecast Period | 2026-2034 |
| Historical Period | 2020-2025 |
| Growth Rate | CAGR of 9.02% from 2020-2034 |
| Segmentation |
|
Table of Contents
- 1. Introduction
- 1.1. Research Scope
- 1.2. Market Segmentation
- 1.3. Research Objective
- 1.4. Definitions and Assumptions
- 2. Executive Summary
- 2.1. Market Snapshot
- 3. Market Dynamics
- 3.1. Market Drivers
- 3.2. Market Restrains
- 3.3. Market Trends
- 3.4. Market Opportunities
- 4. Market Factor Analysis
- 4.1. Porters Five Forces
- 4.1.1. Bargaining Power of Suppliers
- 4.1.2. Bargaining Power of Buyers
- 4.1.3. Threat of New Entrants
- 4.1.4. Threat of Substitutes
- 4.1.5. Competitive Rivalry
- 4.2. PESTEL analysis
- 4.3. BCG Analysis
- 4.3.1. Stars (High Growth, High Market Share)
- 4.3.2. Cash Cows (Low Growth, High Market Share)
- 4.3.3. Question Mark (High Growth, Low Market Share)
- 4.3.4. Dogs (Low Growth, Low Market Share)
- 4.4. Ansoff Matrix Analysis
- 4.5. Supply Chain Analysis
- 4.6. Regulatory Landscape
- 4.7. Current Market Potential and Opportunity Assessment (TAM–SAM–SOM Framework)
- 4.8. VDR Analyst Note
- 4.1. Porters Five Forces
- 5. Market Analysis, Insights and Forecast 2021-2033
- 5.1. Market Analysis, Insights and Forecast - by Therapy Type
- 5.1.1. Monoclonal Antibodies
- 5.1.2. Cancer Vaccines
- 5.1.3. Immunomodulators
- 5.1.4. Immune Check Point Inhibitors
- 5.1.5. Other Therapy Types
- 5.2. Market Analysis, Insights and Forecast - by Application
- 5.2.1. Prostate Cancer
- 5.2.2. Breast Cancer
- 5.2.3. Skin Cancer
- 5.2.4. Lung Cancer
- 5.2.5. Other Applications
- 5.3. Market Analysis, Insights and Forecast - by End Users
- 5.3.1. Hospitals and Clinics
- 5.3.2. Cancer Research Centers
- 5.3.3. Other End Users
- 5.4. Market Analysis, Insights and Forecast - by Region
- 5.4.1. North America
- 5.4.2. Europe
- 5.4.3. Asia Pacific
- 5.4.4. Middle East and Africa
- 5.4.5. South America
- 5.1. Market Analysis, Insights and Forecast - by Therapy Type
- 6. Global Cancer Immunotherapy Industry Analysis, Insights and Forecast, 2021-2033
- 6.1. Market Analysis, Insights and Forecast - by Therapy Type
- 6.1.1. Monoclonal Antibodies
- 6.1.2. Cancer Vaccines
- 6.1.3. Immunomodulators
- 6.1.4. Immune Check Point Inhibitors
- 6.1.5. Other Therapy Types
- 6.2. Market Analysis, Insights and Forecast - by Application
- 6.2.1. Prostate Cancer
- 6.2.2. Breast Cancer
- 6.2.3. Skin Cancer
- 6.2.4. Lung Cancer
- 6.2.5. Other Applications
- 6.3. Market Analysis, Insights and Forecast - by End Users
- 6.3.1. Hospitals and Clinics
- 6.3.2. Cancer Research Centers
- 6.3.3. Other End Users
- 6.1. Market Analysis, Insights and Forecast - by Therapy Type
- 7. North America Cancer Immunotherapy Industry Analysis, Insights and Forecast, 2021-2033
- 7.1. Market Analysis, Insights and Forecast - by Therapy Type
- 7.1.1. Monoclonal Antibodies
- 7.1.2. Cancer Vaccines
- 7.1.3. Immunomodulators
- 7.1.4. Immune Check Point Inhibitors
- 7.1.5. Other Therapy Types
- 7.2. Market Analysis, Insights and Forecast - by Application
- 7.2.1. Prostate Cancer
- 7.2.2. Breast Cancer
- 7.2.3. Skin Cancer
- 7.2.4. Lung Cancer
- 7.2.5. Other Applications
- 7.3. Market Analysis, Insights and Forecast - by End Users
- 7.3.1. Hospitals and Clinics
- 7.3.2. Cancer Research Centers
- 7.3.3. Other End Users
- 7.1. Market Analysis, Insights and Forecast - by Therapy Type
- 8. Europe Cancer Immunotherapy Industry Analysis, Insights and Forecast, 2021-2033
- 8.1. Market Analysis, Insights and Forecast - by Therapy Type
- 8.1.1. Monoclonal Antibodies
- 8.1.2. Cancer Vaccines
- 8.1.3. Immunomodulators
- 8.1.4. Immune Check Point Inhibitors
- 8.1.5. Other Therapy Types
- 8.2. Market Analysis, Insights and Forecast - by Application
- 8.2.1. Prostate Cancer
- 8.2.2. Breast Cancer
- 8.2.3. Skin Cancer
- 8.2.4. Lung Cancer
- 8.2.5. Other Applications
- 8.3. Market Analysis, Insights and Forecast - by End Users
- 8.3.1. Hospitals and Clinics
- 8.3.2. Cancer Research Centers
- 8.3.3. Other End Users
- 8.1. Market Analysis, Insights and Forecast - by Therapy Type
- 9. Asia Pacific Cancer Immunotherapy Industry Analysis, Insights and Forecast, 2021-2033
- 9.1. Market Analysis, Insights and Forecast - by Therapy Type
- 9.1.1. Monoclonal Antibodies
- 9.1.2. Cancer Vaccines
- 9.1.3. Immunomodulators
- 9.1.4. Immune Check Point Inhibitors
- 9.1.5. Other Therapy Types
- 9.2. Market Analysis, Insights and Forecast - by Application
- 9.2.1. Prostate Cancer
- 9.2.2. Breast Cancer
- 9.2.3. Skin Cancer
- 9.2.4. Lung Cancer
- 9.2.5. Other Applications
- 9.3. Market Analysis, Insights and Forecast - by End Users
- 9.3.1. Hospitals and Clinics
- 9.3.2. Cancer Research Centers
- 9.3.3. Other End Users
- 9.1. Market Analysis, Insights and Forecast - by Therapy Type
- 10. Middle East and Africa Cancer Immunotherapy Industry Analysis, Insights and Forecast, 2021-2033
- 10.1. Market Analysis, Insights and Forecast - by Therapy Type
- 10.1.1. Monoclonal Antibodies
- 10.1.2. Cancer Vaccines
- 10.1.3. Immunomodulators
- 10.1.4. Immune Check Point Inhibitors
- 10.1.5. Other Therapy Types
- 10.2. Market Analysis, Insights and Forecast - by Application
- 10.2.1. Prostate Cancer
- 10.2.2. Breast Cancer
- 10.2.3. Skin Cancer
- 10.2.4. Lung Cancer
- 10.2.5. Other Applications
- 10.3. Market Analysis, Insights and Forecast - by End Users
- 10.3.1. Hospitals and Clinics
- 10.3.2. Cancer Research Centers
- 10.3.3. Other End Users
- 10.1. Market Analysis, Insights and Forecast - by Therapy Type
- 11. South America Cancer Immunotherapy Industry Analysis, Insights and Forecast, 2021-2033
- 11.1. Market Analysis, Insights and Forecast - by Therapy Type
- 11.1.1. Monoclonal Antibodies
- 11.1.2. Cancer Vaccines
- 11.1.3. Immunomodulators
- 11.1.4. Immune Check Point Inhibitors
- 11.1.5. Other Therapy Types
- 11.2. Market Analysis, Insights and Forecast - by Application
- 11.2.1. Prostate Cancer
- 11.2.2. Breast Cancer
- 11.2.3. Skin Cancer
- 11.2.4. Lung Cancer
- 11.2.5. Other Applications
- 11.3. Market Analysis, Insights and Forecast - by End Users
- 11.3.1. Hospitals and Clinics
- 11.3.2. Cancer Research Centers
- 11.3.3. Other End Users
- 11.1. Market Analysis, Insights and Forecast - by Therapy Type
- 12. Competitive Analysis
- 12.1. Company Profiles
- 12.1.1 Bayer AG
- 12.1.1.1. Company Overview
- 12.1.1.2. Products
- 12.1.1.3. Company Financials
- 12.1.1.4. SWOT Analysis
- 12.1.2 Novartis AG
- 12.1.2.1. Company Overview
- 12.1.2.2. Products
- 12.1.2.3. Company Financials
- 12.1.2.4. SWOT Analysis
- 12.1.3 Astellas Pharma Inc
- 12.1.3.1. Company Overview
- 12.1.3.2. Products
- 12.1.3.3. Company Financials
- 12.1.3.4. SWOT Analysis
- 12.1.4 Amgen Inc
- 12.1.4.1. Company Overview
- 12.1.4.2. Products
- 12.1.4.3. Company Financials
- 12.1.4.4. SWOT Analysis
- 12.1.5 Gilead Sciences
- 12.1.5.1. Company Overview
- 12.1.5.2. Products
- 12.1.5.3. Company Financials
- 12.1.5.4. SWOT Analysis
- 12.1.6 OSE Immunotherapeutics
- 12.1.6.1. Company Overview
- 12.1.6.2. Products
- 12.1.6.3. Company Financials
- 12.1.6.4. SWOT Analysis
- 12.1.7 Seattle Genetics Inc
- 12.1.7.1. Company Overview
- 12.1.7.2. Products
- 12.1.7.3. Company Financials
- 12.1.7.4. SWOT Analysis
- 12.1.8 AstraZeneca PLC
- 12.1.8.1. Company Overview
- 12.1.8.2. Products
- 12.1.8.3. Company Financials
- 12.1.8.4. SWOT Analysis
- 12.1.9 Eli Lilly and Company
- 12.1.9.1. Company Overview
- 12.1.9.2. Products
- 12.1.9.3. Company Financials
- 12.1.9.4. SWOT Analysis
- 12.1.10 Bristol-Myers Squibb
- 12.1.10.1. Company Overview
- 12.1.10.2. Products
- 12.1.10.3. Company Financials
- 12.1.10.4. SWOT Analysis
- 12.1.11 Merck and Co Inc
- 12.1.11.1. Company Overview
- 12.1.11.2. Products
- 12.1.11.3. Company Financials
- 12.1.11.4. SWOT Analysis
- 12.1.12 GlaxoSmithKline PLC
- 12.1.12.1. Company Overview
- 12.1.12.2. Products
- 12.1.12.3. Company Financials
- 12.1.12.4. SWOT Analysis
- 12.1.13 F Hoffman La Roche Ltd
- 12.1.13.1. Company Overview
- 12.1.13.2. Products
- 12.1.13.3. Company Financials
- 12.1.13.4. SWOT Analysis
- 12.1.14 Pfizer Inc
- 12.1.14.1. Company Overview
- 12.1.14.2. Products
- 12.1.14.3. Company Financials
- 12.1.14.4. SWOT Analysis
- 12.1.1 Bayer AG
- 12.2. Market Entropy
- 12.2.1 Company's Key Areas Served
- 12.2.2 Recent Developments
- 12.3. Company Market Share Analysis 2025
- 12.3.1 Top 5 Companies Market Share Analysis
- 12.3.2 Top 3 Companies Market Share Analysis
- 12.4. List of Potential Customers
- 13. Research Methodology
List of Figures
- Figure 1: Global Cancer Immunotherapy Industry Revenue Breakdown (billion, %) by Region 2025 & 2033
- Figure 2: Global Cancer Immunotherapy Industry Volume Breakdown (K Unit, %) by Region 2025 & 2033
- Figure 3: North America Cancer Immunotherapy Industry Revenue (billion), by Therapy Type 2025 & 2033
- Figure 4: North America Cancer Immunotherapy Industry Volume (K Unit), by Therapy Type 2025 & 2033
- Figure 5: North America Cancer Immunotherapy Industry Revenue Share (%), by Therapy Type 2025 & 2033
- Figure 6: North America Cancer Immunotherapy Industry Volume Share (%), by Therapy Type 2025 & 2033
- Figure 7: North America Cancer Immunotherapy Industry Revenue (billion), by Application 2025 & 2033
- Figure 8: North America Cancer Immunotherapy Industry Volume (K Unit), by Application 2025 & 2033
- Figure 9: North America Cancer Immunotherapy Industry Revenue Share (%), by Application 2025 & 2033
- Figure 10: North America Cancer Immunotherapy Industry Volume Share (%), by Application 2025 & 2033
- Figure 11: North America Cancer Immunotherapy Industry Revenue (billion), by End Users 2025 & 2033
- Figure 12: North America Cancer Immunotherapy Industry Volume (K Unit), by End Users 2025 & 2033
- Figure 13: North America Cancer Immunotherapy Industry Revenue Share (%), by End Users 2025 & 2033
- Figure 14: North America Cancer Immunotherapy Industry Volume Share (%), by End Users 2025 & 2033
- Figure 15: North America Cancer Immunotherapy Industry Revenue (billion), by Country 2025 & 2033
- Figure 16: North America Cancer Immunotherapy Industry Volume (K Unit), by Country 2025 & 2033
- Figure 17: North America Cancer Immunotherapy Industry Revenue Share (%), by Country 2025 & 2033
- Figure 18: North America Cancer Immunotherapy Industry Volume Share (%), by Country 2025 & 2033
- Figure 19: Europe Cancer Immunotherapy Industry Revenue (billion), by Therapy Type 2025 & 2033
- Figure 20: Europe Cancer Immunotherapy Industry Volume (K Unit), by Therapy Type 2025 & 2033
- Figure 21: Europe Cancer Immunotherapy Industry Revenue Share (%), by Therapy Type 2025 & 2033
- Figure 22: Europe Cancer Immunotherapy Industry Volume Share (%), by Therapy Type 2025 & 2033
- Figure 23: Europe Cancer Immunotherapy Industry Revenue (billion), by Application 2025 & 2033
- Figure 24: Europe Cancer Immunotherapy Industry Volume (K Unit), by Application 2025 & 2033
- Figure 25: Europe Cancer Immunotherapy Industry Revenue Share (%), by Application 2025 & 2033
- Figure 26: Europe Cancer Immunotherapy Industry Volume Share (%), by Application 2025 & 2033
- Figure 27: Europe Cancer Immunotherapy Industry Revenue (billion), by End Users 2025 & 2033
- Figure 28: Europe Cancer Immunotherapy Industry Volume (K Unit), by End Users 2025 & 2033
- Figure 29: Europe Cancer Immunotherapy Industry Revenue Share (%), by End Users 2025 & 2033
- Figure 30: Europe Cancer Immunotherapy Industry Volume Share (%), by End Users 2025 & 2033
- Figure 31: Europe Cancer Immunotherapy Industry Revenue (billion), by Country 2025 & 2033
- Figure 32: Europe Cancer Immunotherapy Industry Volume (K Unit), by Country 2025 & 2033
- Figure 33: Europe Cancer Immunotherapy Industry Revenue Share (%), by Country 2025 & 2033
- Figure 34: Europe Cancer Immunotherapy Industry Volume Share (%), by Country 2025 & 2033
- Figure 35: Asia Pacific Cancer Immunotherapy Industry Revenue (billion), by Therapy Type 2025 & 2033
- Figure 36: Asia Pacific Cancer Immunotherapy Industry Volume (K Unit), by Therapy Type 2025 & 2033
- Figure 37: Asia Pacific Cancer Immunotherapy Industry Revenue Share (%), by Therapy Type 2025 & 2033
- Figure 38: Asia Pacific Cancer Immunotherapy Industry Volume Share (%), by Therapy Type 2025 & 2033
- Figure 39: Asia Pacific Cancer Immunotherapy Industry Revenue (billion), by Application 2025 & 2033
- Figure 40: Asia Pacific Cancer Immunotherapy Industry Volume (K Unit), by Application 2025 & 2033
- Figure 41: Asia Pacific Cancer Immunotherapy Industry Revenue Share (%), by Application 2025 & 2033
- Figure 42: Asia Pacific Cancer Immunotherapy Industry Volume Share (%), by Application 2025 & 2033
- Figure 43: Asia Pacific Cancer Immunotherapy Industry Revenue (billion), by End Users 2025 & 2033
- Figure 44: Asia Pacific Cancer Immunotherapy Industry Volume (K Unit), by End Users 2025 & 2033
- Figure 45: Asia Pacific Cancer Immunotherapy Industry Revenue Share (%), by End Users 2025 & 2033
- Figure 46: Asia Pacific Cancer Immunotherapy Industry Volume Share (%), by End Users 2025 & 2033
- Figure 47: Asia Pacific Cancer Immunotherapy Industry Revenue (billion), by Country 2025 & 2033
- Figure 48: Asia Pacific Cancer Immunotherapy Industry Volume (K Unit), by Country 2025 & 2033
- Figure 49: Asia Pacific Cancer Immunotherapy Industry Revenue Share (%), by Country 2025 & 2033
- Figure 50: Asia Pacific Cancer Immunotherapy Industry Volume Share (%), by Country 2025 & 2033
- Figure 51: Middle East and Africa Cancer Immunotherapy Industry Revenue (billion), by Therapy Type 2025 & 2033
- Figure 52: Middle East and Africa Cancer Immunotherapy Industry Volume (K Unit), by Therapy Type 2025 & 2033
- Figure 53: Middle East and Africa Cancer Immunotherapy Industry Revenue Share (%), by Therapy Type 2025 & 2033
- Figure 54: Middle East and Africa Cancer Immunotherapy Industry Volume Share (%), by Therapy Type 2025 & 2033
- Figure 55: Middle East and Africa Cancer Immunotherapy Industry Revenue (billion), by Application 2025 & 2033
- Figure 56: Middle East and Africa Cancer Immunotherapy Industry Volume (K Unit), by Application 2025 & 2033
- Figure 57: Middle East and Africa Cancer Immunotherapy Industry Revenue Share (%), by Application 2025 & 2033
- Figure 58: Middle East and Africa Cancer Immunotherapy Industry Volume Share (%), by Application 2025 & 2033
- Figure 59: Middle East and Africa Cancer Immunotherapy Industry Revenue (billion), by End Users 2025 & 2033
- Figure 60: Middle East and Africa Cancer Immunotherapy Industry Volume (K Unit), by End Users 2025 & 2033
- Figure 61: Middle East and Africa Cancer Immunotherapy Industry Revenue Share (%), by End Users 2025 & 2033
- Figure 62: Middle East and Africa Cancer Immunotherapy Industry Volume Share (%), by End Users 2025 & 2033
- Figure 63: Middle East and Africa Cancer Immunotherapy Industry Revenue (billion), by Country 2025 & 2033
- Figure 64: Middle East and Africa Cancer Immunotherapy Industry Volume (K Unit), by Country 2025 & 2033
- Figure 65: Middle East and Africa Cancer Immunotherapy Industry Revenue Share (%), by Country 2025 & 2033
- Figure 66: Middle East and Africa Cancer Immunotherapy Industry Volume Share (%), by Country 2025 & 2033
- Figure 67: South America Cancer Immunotherapy Industry Revenue (billion), by Therapy Type 2025 & 2033
- Figure 68: South America Cancer Immunotherapy Industry Volume (K Unit), by Therapy Type 2025 & 2033
- Figure 69: South America Cancer Immunotherapy Industry Revenue Share (%), by Therapy Type 2025 & 2033
- Figure 70: South America Cancer Immunotherapy Industry Volume Share (%), by Therapy Type 2025 & 2033
- Figure 71: South America Cancer Immunotherapy Industry Revenue (billion), by Application 2025 & 2033
- Figure 72: South America Cancer Immunotherapy Industry Volume (K Unit), by Application 2025 & 2033
- Figure 73: South America Cancer Immunotherapy Industry Revenue Share (%), by Application 2025 & 2033
- Figure 74: South America Cancer Immunotherapy Industry Volume Share (%), by Application 2025 & 2033
- Figure 75: South America Cancer Immunotherapy Industry Revenue (billion), by End Users 2025 & 2033
- Figure 76: South America Cancer Immunotherapy Industry Volume (K Unit), by End Users 2025 & 2033
- Figure 77: South America Cancer Immunotherapy Industry Revenue Share (%), by End Users 2025 & 2033
- Figure 78: South America Cancer Immunotherapy Industry Volume Share (%), by End Users 2025 & 2033
- Figure 79: South America Cancer Immunotherapy Industry Revenue (billion), by Country 2025 & 2033
- Figure 80: South America Cancer Immunotherapy Industry Volume (K Unit), by Country 2025 & 2033
- Figure 81: South America Cancer Immunotherapy Industry Revenue Share (%), by Country 2025 & 2033
- Figure 82: South America Cancer Immunotherapy Industry Volume Share (%), by Country 2025 & 2033
List of Tables
- Table 1: Global Cancer Immunotherapy Industry Revenue billion Forecast, by Therapy Type 2020 & 2033
- Table 2: Global Cancer Immunotherapy Industry Volume K Unit Forecast, by Therapy Type 2020 & 2033
- Table 3: Global Cancer Immunotherapy Industry Revenue billion Forecast, by Application 2020 & 2033
- Table 4: Global Cancer Immunotherapy Industry Volume K Unit Forecast, by Application 2020 & 2033
- Table 5: Global Cancer Immunotherapy Industry Revenue billion Forecast, by End Users 2020 & 2033
- Table 6: Global Cancer Immunotherapy Industry Volume K Unit Forecast, by End Users 2020 & 2033
- Table 7: Global Cancer Immunotherapy Industry Revenue billion Forecast, by Region 2020 & 2033
- Table 8: Global Cancer Immunotherapy Industry Volume K Unit Forecast, by Region 2020 & 2033
- Table 9: Global Cancer Immunotherapy Industry Revenue billion Forecast, by Therapy Type 2020 & 2033
- Table 10: Global Cancer Immunotherapy Industry Volume K Unit Forecast, by Therapy Type 2020 & 2033
- Table 11: Global Cancer Immunotherapy Industry Revenue billion Forecast, by Application 2020 & 2033
- Table 12: Global Cancer Immunotherapy Industry Volume K Unit Forecast, by Application 2020 & 2033
- Table 13: Global Cancer Immunotherapy Industry Revenue billion Forecast, by End Users 2020 & 2033
- Table 14: Global Cancer Immunotherapy Industry Volume K Unit Forecast, by End Users 2020 & 2033
- Table 15: Global Cancer Immunotherapy Industry Revenue billion Forecast, by Country 2020 & 2033
- Table 16: Global Cancer Immunotherapy Industry Volume K Unit Forecast, by Country 2020 & 2033
- Table 17: United States Cancer Immunotherapy Industry Revenue (billion) Forecast, by Application 2020 & 2033
- Table 18: United States Cancer Immunotherapy Industry Volume (K Unit) Forecast, by Application 2020 & 2033
- Table 19: Canada Cancer Immunotherapy Industry Revenue (billion) Forecast, by Application 2020 & 2033
- Table 20: Canada Cancer Immunotherapy Industry Volume (K Unit) Forecast, by Application 2020 & 2033
- Table 21: Mexico Cancer Immunotherapy Industry Revenue (billion) Forecast, by Application 2020 & 2033
- Table 22: Mexico Cancer Immunotherapy Industry Volume (K Unit) Forecast, by Application 2020 & 2033
- Table 23: Global Cancer Immunotherapy Industry Revenue billion Forecast, by Therapy Type 2020 & 2033
- Table 24: Global Cancer Immunotherapy Industry Volume K Unit Forecast, by Therapy Type 2020 & 2033
- Table 25: Global Cancer Immunotherapy Industry Revenue billion Forecast, by Application 2020 & 2033
- Table 26: Global Cancer Immunotherapy Industry Volume K Unit Forecast, by Application 2020 & 2033
- Table 27: Global Cancer Immunotherapy Industry Revenue billion Forecast, by End Users 2020 & 2033
- Table 28: Global Cancer Immunotherapy Industry Volume K Unit Forecast, by End Users 2020 & 2033
- Table 29: Global Cancer Immunotherapy Industry Revenue billion Forecast, by Country 2020 & 2033
- Table 30: Global Cancer Immunotherapy Industry Volume K Unit Forecast, by Country 2020 & 2033
- Table 31: Germany Cancer Immunotherapy Industry Revenue (billion) Forecast, by Application 2020 & 2033
- Table 32: Germany Cancer Immunotherapy Industry Volume (K Unit) Forecast, by Application 2020 & 2033
- Table 33: United Kingdom Cancer Immunotherapy Industry Revenue (billion) Forecast, by Application 2020 & 2033
- Table 34: United Kingdom Cancer Immunotherapy Industry Volume (K Unit) Forecast, by Application 2020 & 2033
- Table 35: France Cancer Immunotherapy Industry Revenue (billion) Forecast, by Application 2020 & 2033
- Table 36: France Cancer Immunotherapy Industry Volume (K Unit) Forecast, by Application 2020 & 2033
- Table 37: Italy Cancer Immunotherapy Industry Revenue (billion) Forecast, by Application 2020 & 2033
- Table 38: Italy Cancer Immunotherapy Industry Volume (K Unit) Forecast, by Application 2020 & 2033
- Table 39: Spain Cancer Immunotherapy Industry Revenue (billion) Forecast, by Application 2020 & 2033
- Table 40: Spain Cancer Immunotherapy Industry Volume (K Unit) Forecast, by Application 2020 & 2033
- Table 41: Rest of Europe Cancer Immunotherapy Industry Revenue (billion) Forecast, by Application 2020 & 2033
- Table 42: Rest of Europe Cancer Immunotherapy Industry Volume (K Unit) Forecast, by Application 2020 & 2033
- Table 43: Global Cancer Immunotherapy Industry Revenue billion Forecast, by Therapy Type 2020 & 2033
- Table 44: Global Cancer Immunotherapy Industry Volume K Unit Forecast, by Therapy Type 2020 & 2033
- Table 45: Global Cancer Immunotherapy Industry Revenue billion Forecast, by Application 2020 & 2033
- Table 46: Global Cancer Immunotherapy Industry Volume K Unit Forecast, by Application 2020 & 2033
- Table 47: Global Cancer Immunotherapy Industry Revenue billion Forecast, by End Users 2020 & 2033
- Table 48: Global Cancer Immunotherapy Industry Volume K Unit Forecast, by End Users 2020 & 2033
- Table 49: Global Cancer Immunotherapy Industry Revenue billion Forecast, by Country 2020 & 2033
- Table 50: Global Cancer Immunotherapy Industry Volume K Unit Forecast, by Country 2020 & 2033
- Table 51: China Cancer Immunotherapy Industry Revenue (billion) Forecast, by Application 2020 & 2033
- Table 52: China Cancer Immunotherapy Industry Volume (K Unit) Forecast, by Application 2020 & 2033
- Table 53: Japan Cancer Immunotherapy Industry Revenue (billion) Forecast, by Application 2020 & 2033
- Table 54: Japan Cancer Immunotherapy Industry Volume (K Unit) Forecast, by Application 2020 & 2033
- Table 55: India Cancer Immunotherapy Industry Revenue (billion) Forecast, by Application 2020 & 2033
- Table 56: India Cancer Immunotherapy Industry Volume (K Unit) Forecast, by Application 2020 & 2033
- Table 57: Australia Cancer Immunotherapy Industry Revenue (billion) Forecast, by Application 2020 & 2033
- Table 58: Australia Cancer Immunotherapy Industry Volume (K Unit) Forecast, by Application 2020 & 2033
- Table 59: South Korea Cancer Immunotherapy Industry Revenue (billion) Forecast, by Application 2020 & 2033
- Table 60: South Korea Cancer Immunotherapy Industry Volume (K Unit) Forecast, by Application 2020 & 2033
- Table 61: Rest of Asia Pacific Cancer Immunotherapy Industry Revenue (billion) Forecast, by Application 2020 & 2033
- Table 62: Rest of Asia Pacific Cancer Immunotherapy Industry Volume (K Unit) Forecast, by Application 2020 & 2033
- Table 63: Global Cancer Immunotherapy Industry Revenue billion Forecast, by Therapy Type 2020 & 2033
- Table 64: Global Cancer Immunotherapy Industry Volume K Unit Forecast, by Therapy Type 2020 & 2033
- Table 65: Global Cancer Immunotherapy Industry Revenue billion Forecast, by Application 2020 & 2033
- Table 66: Global Cancer Immunotherapy Industry Volume K Unit Forecast, by Application 2020 & 2033
- Table 67: Global Cancer Immunotherapy Industry Revenue billion Forecast, by End Users 2020 & 2033
- Table 68: Global Cancer Immunotherapy Industry Volume K Unit Forecast, by End Users 2020 & 2033
- Table 69: Global Cancer Immunotherapy Industry Revenue billion Forecast, by Country 2020 & 2033
- Table 70: Global Cancer Immunotherapy Industry Volume K Unit Forecast, by Country 2020 & 2033
- Table 71: GCC Cancer Immunotherapy Industry Revenue (billion) Forecast, by Application 2020 & 2033
- Table 72: GCC Cancer Immunotherapy Industry Volume (K Unit) Forecast, by Application 2020 & 2033
- Table 73: South Africa Cancer Immunotherapy Industry Revenue (billion) Forecast, by Application 2020 & 2033
- Table 74: South Africa Cancer Immunotherapy Industry Volume (K Unit) Forecast, by Application 2020 & 2033
- Table 75: Rest of Middle East and Africa Cancer Immunotherapy Industry Revenue (billion) Forecast, by Application 2020 & 2033
- Table 76: Rest of Middle East and Africa Cancer Immunotherapy Industry Volume (K Unit) Forecast, by Application 2020 & 2033
- Table 77: Global Cancer Immunotherapy Industry Revenue billion Forecast, by Therapy Type 2020 & 2033
- Table 78: Global Cancer Immunotherapy Industry Volume K Unit Forecast, by Therapy Type 2020 & 2033
- Table 79: Global Cancer Immunotherapy Industry Revenue billion Forecast, by Application 2020 & 2033
- Table 80: Global Cancer Immunotherapy Industry Volume K Unit Forecast, by Application 2020 & 2033
- Table 81: Global Cancer Immunotherapy Industry Revenue billion Forecast, by End Users 2020 & 2033
- Table 82: Global Cancer Immunotherapy Industry Volume K Unit Forecast, by End Users 2020 & 2033
- Table 83: Global Cancer Immunotherapy Industry Revenue billion Forecast, by Country 2020 & 2033
- Table 84: Global Cancer Immunotherapy Industry Volume K Unit Forecast, by Country 2020 & 2033
- Table 85: Brazil Cancer Immunotherapy Industry Revenue (billion) Forecast, by Application 2020 & 2033
- Table 86: Brazil Cancer Immunotherapy Industry Volume (K Unit) Forecast, by Application 2020 & 2033
- Table 87: Argentina Cancer Immunotherapy Industry Revenue (billion) Forecast, by Application 2020 & 2033
- Table 88: Argentina Cancer Immunotherapy Industry Volume (K Unit) Forecast, by Application 2020 & 2033
- Table 89: Rest of South America Cancer Immunotherapy Industry Revenue (billion) Forecast, by Application 2020 & 2033
- Table 90: Rest of South America Cancer Immunotherapy Industry Volume (K Unit) Forecast, by Application 2020 & 2033
Frequently Asked Questions
1. What is the projected Compound Annual Growth Rate (CAGR) of the Cancer Immunotherapy Industry?
The projected CAGR is approximately 9.02%.
2. Which companies are prominent players in the Cancer Immunotherapy Industry?
Key companies in the market include Bayer AG, Novartis AG, Astellas Pharma Inc, Amgen Inc, Gilead Sciences, OSE Immunotherapeutics, Seattle Genetics Inc, AstraZeneca PLC, Eli Lilly and Company, Bristol-Myers Squibb, Merck and Co Inc, GlaxoSmithKline PLC, F Hoffman La Roche Ltd, Pfizer Inc.
3. What are the main segments of the Cancer Immunotherapy Industry?
The market segments include Therapy Type, Application, End Users.
4. Can you provide details about the market size?
The market size is estimated to be USD 153.27 billion as of 2022.
5. What are some drivers contributing to market growth?
Rising R&D Activities; Increasing Effectivity and Accuracy Of Newer Therapies; Growing Prevalence of Cancer.
6. What are the notable trends driving market growth?
Breast Cancer Segment Expected to Hold a Major Share in the Cancer Immunotherapy Market.
7. Are there any restraints impacting market growth?
High Cost Coupled with Expensive Development; Stringent Regulatory Factors.
8. Can you provide examples of recent developments in the market?
N/A
9. What pricing options are available for accessing the report?
Pricing options include single-user, multi-user, and enterprise licenses priced at USD 4750, USD 5250, and USD 8750 respectively.
10. Is the market size provided in terms of value or volume?
The market size is provided in terms of value, measured in billion and volume, measured in K Unit.
11. Are there any specific market keywords associated with the report?
Yes, the market keyword associated with the report is "Cancer Immunotherapy Industry," which aids in identifying and referencing the specific market segment covered.
12. How do I determine which pricing option suits my needs best?
The pricing options vary based on user requirements and access needs. Individual users may opt for single-user licenses, while businesses requiring broader access may choose multi-user or enterprise licenses for cost-effective access to the report.
13. Are there any additional resources or data provided in the Cancer Immunotherapy Industry report?
While the report offers comprehensive insights, it's advisable to review the specific contents or supplementary materials provided to ascertain if additional resources or data are available.
14. How can I stay updated on further developments or reports in the Cancer Immunotherapy Industry?
To stay informed about further developments, trends, and reports in the Cancer Immunotherapy Industry, consider subscribing to industry newsletters, following relevant companies and organizations, or regularly checking reputable industry news sources and publications.
Methodology
Step 1 - Identification of Relevant Samples Size from Population Database


Step 2 - Approaches for Defining Global Market Size (Value, Volume* & Price*)

Note*: In applicable scenarios
Step 3 - Data Sources
Primary Research
- Web Analytics
- Survey Reports
- Research Institute
- Latest Research Reports
- Opinion Leaders
Secondary Research
- Annual Reports
- White Paper
- Latest Press Release
- Industry Association
- Paid Database
- Investor Presentations

Step 4 - Data Triangulation
Involves using different sources of information in order to increase the validity of a study
These sources are likely to be stakeholders in a program - participants, other researchers, program staff, other community members, and so on.
Then we put all data in single framework & apply various statistical tools to find out the dynamic on the market.
During the analysis stage, feedback from the stakeholder groups would be compared to determine areas of agreement as well as areas of divergence