

Key Insights
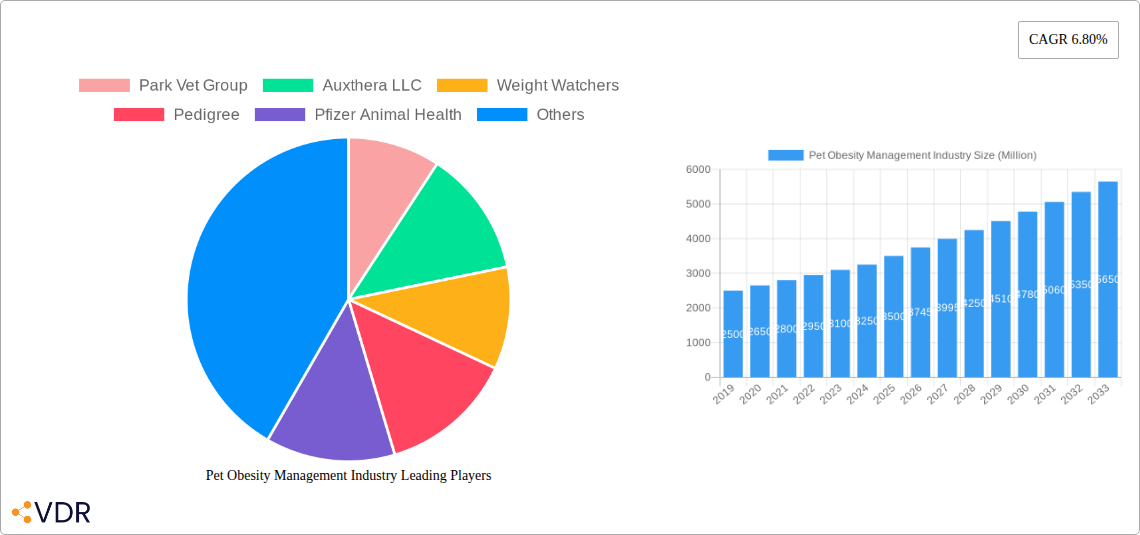
The global Pet Obesity Management market is poised for significant expansion, projected to reach $9.67 billion by 2025, with a robust Compound Annual Growth Rate (CAGR) of 13.83% through 2033. Key growth drivers include the increasing humanization of pets, heightened awareness of pet obesity's health risks (such as joint issues, diabetes, and cardiovascular diseases), and advancements in veterinary nutrition, including specialized diets and supplements. E-commerce channels are further boosting accessibility and market penetration.
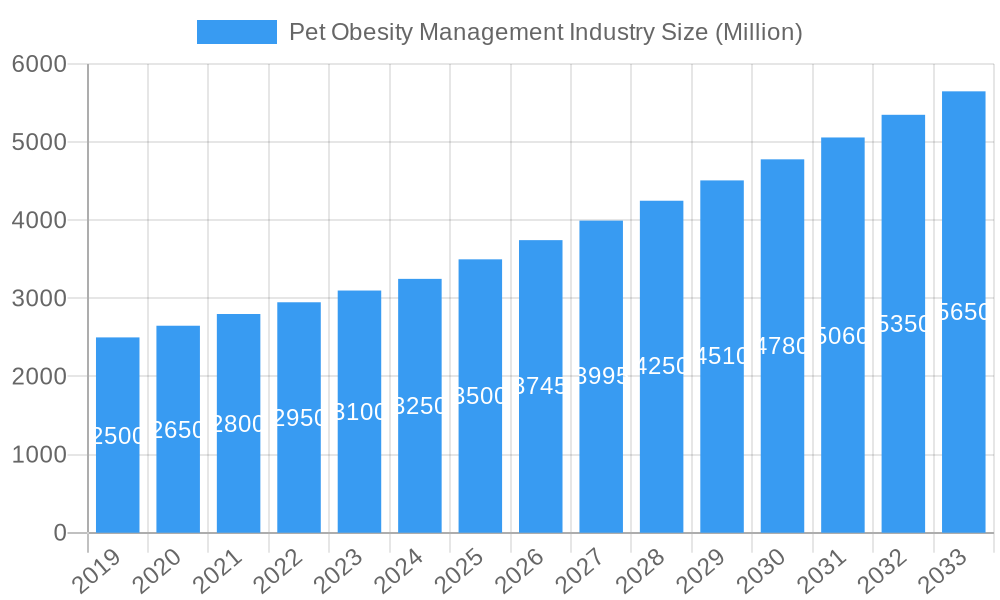
Pet Obesity Management Industry Market Size (In Billion)
The market is segmented by product, with "Drugs" anticipated to lead due to rising obesity-related conditions, and "Food Supplements" gaining prominence as preventive measures. "Dogs" and "Cats" dominate animal types, reflecting their widespread ownership. "Pet Specialty Stores" and "E-commerce" are key growth areas for end-users, driven by changing consumer preferences and online convenience. Emerging trends like personalized nutrition and pet health monitoring technology are influencing the market, while owner awareness and treatment costs present potential challenges.
Pet Obesity Management Industry Company Market Share
Report Description: Global Pet Obesity Management Industry Analysis 2019-2033
This comprehensive report provides an in-depth analysis of the global pet obesity management industry, a rapidly expanding market driven by increasing pet ownership, a growing awareness of pet health, and the parallel rise in pet obesity rates. The report offers critical insights for industry professionals, stakeholders, and investors, covering market dynamics, growth trends, regional dominance, product innovation, key challenges, and emerging opportunities. With a detailed forecast period from 2025 to 2033, and using 2025 as the base and estimated year, this study leverages historical data from 2019-2024 to present a robust and actionable market outlook. The report segments the market by Products (Drugs, Food Supplements), Animal Type (Dogs, Cats, Other Animals), and End User (Pet Specialty Stores, E-commerce, Other End Users), providing granular data and strategic intelligence. All quantitative values are presented in Million USD units for clarity and comparability.
Pet Obesity Management Industry Market Dynamics & Structure
The pet obesity management industry is characterized by a dynamic and evolving market structure, with a moderate level of concentration among key players. Technological innovation, particularly in the development of novel therapeutic drugs and scientifically formulated dietary supplements, is a primary driver. Regulatory frameworks are becoming increasingly stringent, influencing product development and marketing claims, especially concerning veterinary-approved solutions. Competitive product substitutes are abundant, ranging from prescription diets to over-the-counter supplements and specialized treat alternatives, creating a multifaceted competitive landscape. End-user demographics are shifting, with a growing segment of highly engaged pet owners actively seeking science-backed solutions for their pets' health and well-being. Mergers and acquisitions (M&A) trends indicate a consolidation phase, with larger animal health companies acquiring innovative startups to expand their portfolios and market reach.
- Market Concentration: Dominated by a few key players in prescription pharmaceuticals and premium pet foods, with a growing number of niche supplement providers.
- Technological Innovation Drivers: Advancements in veterinary nutrition science, development of targeted pharmaceuticals for weight management, and digital health platforms for pet monitoring.
- Regulatory Frameworks: Increasing scrutiny on product efficacy, labeling, and veterinary endorsement by bodies like the FDA and EMA for animal health products.
- Competitive Product Substitutes: Wide array of prescription diets, weight management treats, supplements, and behavioral modification programs.
- End-User Demographics: A growing segment of informed and proactive pet owners willing to invest in specialized pet health solutions.
- M&A Trends: Strategic acquisitions by major animal health corporations to integrate innovative technologies and expand product offerings.
Pet Obesity Management Industry Growth Trends & Insights
The pet obesity management industry is poised for significant expansion, driven by a confluence of factors including the humanization of pets, increasing disposable incomes dedicated to pet care, and a heightened awareness of the health risks associated with pet obesity. The market size is projected to witness a robust Compound Annual Growth Rate (CAGR) throughout the forecast period. Adoption rates for specialized weight management products are accelerating as pet owners transition from generic pet foods to science-backed nutritional solutions recommended by veterinarians. Technological disruptions are manifesting in the form of advanced diagnostic tools for assessing pet body condition, personalized nutrition plans powered by AI, and innovative drug delivery systems for therapeutic interventions. Consumer behavior shifts are evident in the increasing demand for convenient and effective solutions, with a growing willingness to purchase premium products that offer tangible health benefits. The market penetration of specialized pet obesity management products is expected to deepen as educational initiatives by veterinary professionals and industry players gain traction.
The increasing prevalence of pet obesity, mirroring human obesity trends, presents a substantial market opportunity. This surge is attributed to factors such as sedentary lifestyles, overfeeding, and the widespread availability of high-calorie pet treats. Consequently, pet owners are actively seeking effective strategies to manage their pets' weight, fueling demand for specialized products and services. The market is evolving rapidly, with innovations in nutritional science leading to the development of low-calorie, high-protein diets that promote satiety and support lean muscle mass. Pharmaceutical interventions are also playing a crucial role, with novel drugs targeting metabolic pathways to aid in weight loss and management. The digital transformation of the pet care industry is further influencing growth, with the emergence of pet health apps, wearable fitness trackers for pets, and e-commerce platforms offering a wide range of obesity management solutions. These advancements empower pet owners with accessible information and convenient purchasing options, thereby accelerating market penetration. Furthermore, the growing trend of preventive healthcare for pets, akin to human wellness, is driving proactive engagement with weight management strategies. This proactive approach, coupled with an increasing understanding of the long-term health benefits of maintaining a healthy weight in pets, is a key growth driver for the industry.
Dominant Regions, Countries, or Segments in Pet Obesity Management Industry
North America, particularly the United States, currently holds a dominant position in the global pet obesity management industry. This leadership is underpinned by several key drivers, including high pet ownership rates, substantial per-capita spending on pet healthcare, and a strong veterinary infrastructure that actively promotes pet wellness programs. The region’s robust economy and a significant segment of affluent pet owners are willing to invest in premium and specialized pet health products. The market share within North America is further bolstered by a highly developed e-commerce landscape, offering widespread access to a diverse range of obesity management products.
Leading Segments Driving Market Growth:
- Products: Food Supplements: This segment is experiencing rapid growth due to the increasing demand for scientifically formulated dietary supplements that aid in weight management, improve metabolism, and support overall pet health without the need for prescription medication. These supplements are often positioned as convenient and effective alternatives or complements to specialized diets.
- Animal Type: Dogs: Dogs represent the largest consumer segment within the pet obesity management market. This is attributed to their high prevalence as pets globally, coupled with breeds that are genetically predisposed to weight gain and a common tendency towards overconsumption of food and treats.
- End User: E-commerce: The e-commerce channel is a significant growth engine, providing unparalleled convenience and accessibility to a broad spectrum of pet owners. Online platforms offer a wide selection of products, competitive pricing, and detailed product information, catering to the evolving purchasing habits of consumers. This segment is experiencing substantial growth due to its ability to reach a wider customer base and facilitate direct-to-consumer sales.
Pet Obesity Management Industry Product Landscape
The product landscape within the pet obesity management industry is characterized by continuous innovation aimed at developing effective and palatable solutions for pets. Key product categories include specialized prescription diets formulated with reduced calories and enhanced fiber for satiety, as well as over-the-counter food supplements designed to support metabolism and fat breakdown. Emerging innovations include functional treats that offer health benefits beyond basic nutrition, and novel drug formulations for therapeutic weight loss in severe cases. Performance metrics are increasingly focused on measurable outcomes such as percentage of weight loss, improvement in body condition score, and enhanced pet vitality. Unique selling propositions often revolve around veterinarian recommendations, scientifically proven ingredients, and palatable flavors that ensure compliance.
Key Drivers, Barriers & Challenges in Pet Obesity Management Industry
Key Drivers:
- Rising Pet Obesity Rates: The alarming increase in overweight and obese pets globally is the primary catalyst, driving demand for effective management solutions.
- Humanization of Pets: The trend of pets being treated as family members leads to increased investment in their health and well-being.
- Veterinary Recommendations: The growing emphasis on preventive care and proactive health management by veterinarians significantly influences product adoption.
- Technological Advancements: Innovations in nutritional science, pharmaceuticals, and digital health platforms are creating more effective and accessible solutions.
Key Barriers & Challenges:
- Owner Compliance and Education: A significant challenge is ensuring consistent owner adherence to feeding plans and lifestyle changes, often due to a lack of understanding or perceived difficulty.
- Cost of Premium Products: Specialized diets and supplements can be expensive, posing a barrier for some pet owners.
- Regulatory Hurdles: Stringent regulations for veterinary pharmaceuticals and claims for dietary supplements can slow down product development and market entry.
- Counterfeit Products: The presence of counterfeit or ineffective products in the market can erode consumer trust and pose health risks.
Emerging Opportunities in Pet Obesity Management Industry
Emerging opportunities in the pet obesity management industry lie in the development of personalized nutrition plans leveraging AI and genetic data, creating innovative at-home diagnostic tools for proactive health monitoring, and expanding into emerging markets with growing pet populations and increasing disposable incomes. The growing trend of pet humanization is also driving demand for premium, natural, and sustainable pet food options that contribute to weight management. Furthermore, strategic partnerships between veterinary clinics, pet food manufacturers, and technology providers can unlock new avenues for integrated care solutions and digital platforms that support long-term pet health.
Growth Accelerators in the Pet Obesity Management Industry Industry
Long-term growth in the pet obesity management industry will be significantly accelerated by breakthroughs in understanding the complex metabolic pathways involved in pet weight regulation, leading to the development of highly targeted and effective pharmaceuticals. The increasing adoption of telemedicine and AI-powered pet health platforms will enable more personalized and proactive weight management strategies, improving owner engagement and compliance. Strategic alliances and collaborations between established animal health companies and agile biotech startups will foster innovation and expedite the commercialization of novel solutions. Furthermore, a concerted effort towards global education campaigns highlighting the health risks of pet obesity and the benefits of proactive management will continue to drive market expansion.
Key Players Shaping the Pet Obesity Management Industry Market
- Park Vet Group
- Auxthera LLC
- Weight Watchers
- Pedigree
- Pfizer Animal Health
- Vivaldis
- KONG Company
- Hills Pet Nutrition Inc
- Royal Canin
Notable Milestones in Pet Obesity Management Industry Sector
- May 2022: Park Vet Group launched the Veterinary Nursing Awareness campaign, raising awareness regarding the importance of veterinary nursing and pet nutrition balances, which indirectly supports obesity management initiatives.
- January 2022: Alton Brown joined Hill's Pet Nutrition on a mission to end pet obesity. The company revealed recent research findings to help enhance this campaign by offering pet owners free education, tools, and resources, increasing engagement with obesity management solutions.
In-Depth Pet Obesity Management Industry Market Outlook
The future market potential for pet obesity management is exceptionally promising, driven by sustained growth in pet ownership and an increasing understanding of the long-term health consequences of pet obesity. Strategic opportunities abound in the development of advanced, science-backed nutritional solutions and pharmaceutical interventions that offer improved efficacy and safety profiles. The integration of digital technologies, from AI-powered personalized diet plans to wearable fitness trackers for pets, will revolutionize how pet owners approach weight management. Furthermore, expanding into underserved geographical markets and forging stronger collaborations between veterinary professionals, pet food manufacturers, and technology innovators will be crucial for capitalizing on emerging trends and solidifying market leadership in this vital sector of the pet care industry.
Pet Obesity Management Industry Segmentation
-
1. Products
- 1.1. Drugs
- 1.2. Food Supplements
-
2. Animal Type
- 2.1. Dogs
- 2.2. Cats
- 2.3. Other Animals
-
3. End User
- 3.1. Pet Specialty Stores
- 3.2. E-commerce
- 3.3. Other End Users
Pet Obesity Management Industry Segmentation By Geography
-
1. North America
- 1.1. United States
- 1.2. Canada
- 1.3. Mexico
-
2. Europe
- 2.1. Germany
- 2.2. United Kingdom
- 2.3. France
- 2.4. Italy
- 2.5. Spain
- 2.6. Rest of Europe
-
3. Asia Pacific
- 3.1. China
- 3.2. Japan
- 3.3. India
- 3.4. Australia
- 3.5. South Korea
- 3.6. Rest of Asia Pacific
-
4. Middle East and Africa
- 4.1. GCC
- 4.2. South Africa
- 4.3. Rest of Middle East and Africa
-
5. South America
- 5.1. Brazil
- 5.2. Argentina
- 5.3. Rest of South America
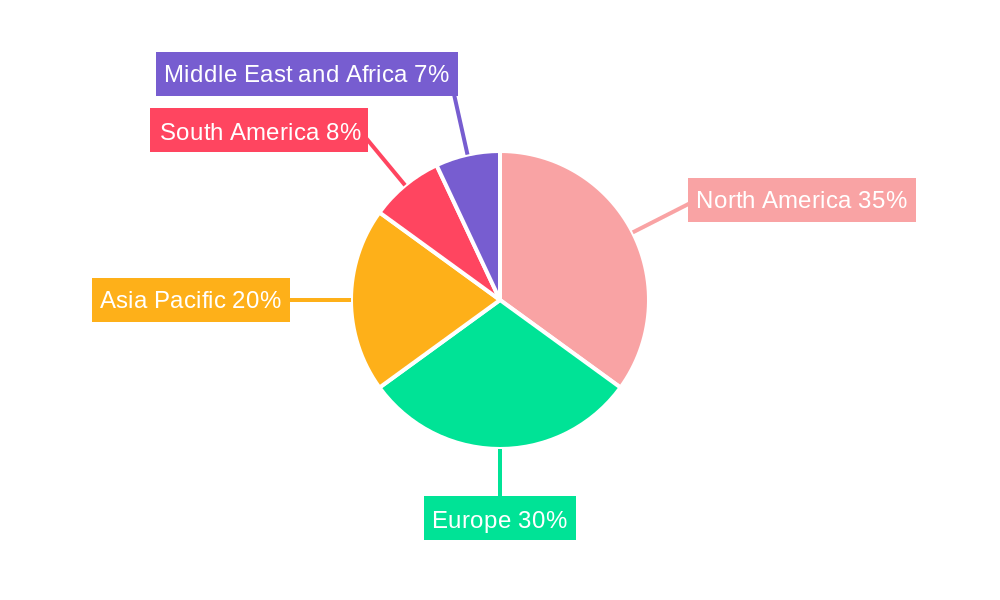
Pet Obesity Management Industry Regional Market Share
Geographic Coverage of Pet Obesity Management Industry
Pet Obesity Management Industry REPORT HIGHLIGHTS
| Aspects | Details |
|---|---|
| Study Period | 2020-2034 |
| Base Year | 2025 |
| Estimated Year | 2026 |
| Forecast Period | 2026-2034 |
| Historical Period | 2020-2025 |
| Growth Rate | CAGR of 13.83% from 2020-2034 |
| Segmentation |
|
Table of Contents
- 1. Introduction
- 1.1. Research Scope
- 1.2. Market Segmentation
- 1.3. Research Objective
- 1.4. Definitions and Assumptions
- 2. Executive Summary
- 2.1. Market Snapshot
- 3. Market Dynamics
- 3.1. Market Drivers
- 3.2. Market Restrains
- 3.3. Market Trends
- 3.4. Market Opportunities
- 4. Market Factor Analysis
- 4.1. Porters Five Forces
- 4.1.1. Bargaining Power of Suppliers
- 4.1.2. Bargaining Power of Buyers
- 4.1.3. Threat of New Entrants
- 4.1.4. Threat of Substitutes
- 4.1.5. Competitive Rivalry
- 4.2. PESTEL analysis
- 4.3. BCG Analysis
- 4.3.1. Stars (High Growth, High Market Share)
- 4.3.2. Cash Cows (Low Growth, High Market Share)
- 4.3.3. Question Mark (High Growth, Low Market Share)
- 4.3.4. Dogs (Low Growth, Low Market Share)
- 4.4. Ansoff Matrix Analysis
- 4.5. Supply Chain Analysis
- 4.6. Regulatory Landscape
- 4.7. Current Market Potential and Opportunity Assessment (TAM–SAM–SOM Framework)
- 4.8. VDR Analyst Note
- 4.1. Porters Five Forces
- 5. Market Analysis, Insights and Forecast 2021-2033
- 5.1. Market Analysis, Insights and Forecast - by Products
- 5.1.1. Drugs
- 5.1.2. Food Supplements
- 5.2. Market Analysis, Insights and Forecast - by Animal Type
- 5.2.1. Dogs
- 5.2.2. Cats
- 5.2.3. Other Animals
- 5.3. Market Analysis, Insights and Forecast - by End User
- 5.3.1. Pet Specialty Stores
- 5.3.2. E-commerce
- 5.3.3. Other End Users
- 5.4. Market Analysis, Insights and Forecast - by Region
- 5.4.1. North America
- 5.4.2. Europe
- 5.4.3. Asia Pacific
- 5.4.4. Middle East and Africa
- 5.4.5. South America
- 5.1. Market Analysis, Insights and Forecast - by Products
- 6. Global Pet Obesity Management Industry Analysis, Insights and Forecast, 2021-2033
- 6.1. Market Analysis, Insights and Forecast - by Products
- 6.1.1. Drugs
- 6.1.2. Food Supplements
- 6.2. Market Analysis, Insights and Forecast - by Animal Type
- 6.2.1. Dogs
- 6.2.2. Cats
- 6.2.3. Other Animals
- 6.3. Market Analysis, Insights and Forecast - by End User
- 6.3.1. Pet Specialty Stores
- 6.3.2. E-commerce
- 6.3.3. Other End Users
- 6.1. Market Analysis, Insights and Forecast - by Products
- 7. North America Pet Obesity Management Industry Analysis, Insights and Forecast, 2021-2033
- 7.1. Market Analysis, Insights and Forecast - by Products
- 7.1.1. Drugs
- 7.1.2. Food Supplements
- 7.2. Market Analysis, Insights and Forecast - by Animal Type
- 7.2.1. Dogs
- 7.2.2. Cats
- 7.2.3. Other Animals
- 7.3. Market Analysis, Insights and Forecast - by End User
- 7.3.1. Pet Specialty Stores
- 7.3.2. E-commerce
- 7.3.3. Other End Users
- 7.1. Market Analysis, Insights and Forecast - by Products
- 8. Europe Pet Obesity Management Industry Analysis, Insights and Forecast, 2021-2033
- 8.1. Market Analysis, Insights and Forecast - by Products
- 8.1.1. Drugs
- 8.1.2. Food Supplements
- 8.2. Market Analysis, Insights and Forecast - by Animal Type
- 8.2.1. Dogs
- 8.2.2. Cats
- 8.2.3. Other Animals
- 8.3. Market Analysis, Insights and Forecast - by End User
- 8.3.1. Pet Specialty Stores
- 8.3.2. E-commerce
- 8.3.3. Other End Users
- 8.1. Market Analysis, Insights and Forecast - by Products
- 9. Asia Pacific Pet Obesity Management Industry Analysis, Insights and Forecast, 2021-2033
- 9.1. Market Analysis, Insights and Forecast - by Products
- 9.1.1. Drugs
- 9.1.2. Food Supplements
- 9.2. Market Analysis, Insights and Forecast - by Animal Type
- 9.2.1. Dogs
- 9.2.2. Cats
- 9.2.3. Other Animals
- 9.3. Market Analysis, Insights and Forecast - by End User
- 9.3.1. Pet Specialty Stores
- 9.3.2. E-commerce
- 9.3.3. Other End Users
- 9.1. Market Analysis, Insights and Forecast - by Products
- 10. Middle East and Africa Pet Obesity Management Industry Analysis, Insights and Forecast, 2021-2033
- 10.1. Market Analysis, Insights and Forecast - by Products
- 10.1.1. Drugs
- 10.1.2. Food Supplements
- 10.2. Market Analysis, Insights and Forecast - by Animal Type
- 10.2.1. Dogs
- 10.2.2. Cats
- 10.2.3. Other Animals
- 10.3. Market Analysis, Insights and Forecast - by End User
- 10.3.1. Pet Specialty Stores
- 10.3.2. E-commerce
- 10.3.3. Other End Users
- 10.1. Market Analysis, Insights and Forecast - by Products
- 11. South America Pet Obesity Management Industry Analysis, Insights and Forecast, 2021-2033
- 11.1. Market Analysis, Insights and Forecast - by Products
- 11.1.1. Drugs
- 11.1.2. Food Supplements
- 11.2. Market Analysis, Insights and Forecast - by Animal Type
- 11.2.1. Dogs
- 11.2.2. Cats
- 11.2.3. Other Animals
- 11.3. Market Analysis, Insights and Forecast - by End User
- 11.3.1. Pet Specialty Stores
- 11.3.2. E-commerce
- 11.3.3. Other End Users
- 11.1. Market Analysis, Insights and Forecast - by Products
- 12. Competitive Analysis
- 12.1. Company Profiles
- 12.1.1 Park Vet Group
- 12.1.1.1. Company Overview
- 12.1.1.2. Products
- 12.1.1.3. Company Financials
- 12.1.1.4. SWOT Analysis
- 12.1.2 Auxthera LLC
- 12.1.2.1. Company Overview
- 12.1.2.2. Products
- 12.1.2.3. Company Financials
- 12.1.2.4. SWOT Analysis
- 12.1.3 Weight Watchers
- 12.1.3.1. Company Overview
- 12.1.3.2. Products
- 12.1.3.3. Company Financials
- 12.1.3.4. SWOT Analysis
- 12.1.4 Pedigree
- 12.1.4.1. Company Overview
- 12.1.4.2. Products
- 12.1.4.3. Company Financials
- 12.1.4.4. SWOT Analysis
- 12.1.5 Pfizer Animal Health
- 12.1.5.1. Company Overview
- 12.1.5.2. Products
- 12.1.5.3. Company Financials
- 12.1.5.4. SWOT Analysis
- 12.1.6 Vivaldis
- 12.1.6.1. Company Overview
- 12.1.6.2. Products
- 12.1.6.3. Company Financials
- 12.1.6.4. SWOT Analysis
- 12.1.7 KONG Company
- 12.1.7.1. Company Overview
- 12.1.7.2. Products
- 12.1.7.3. Company Financials
- 12.1.7.4. SWOT Analysis
- 12.1.8 Hills Pet Nutrition Inc
- 12.1.8.1. Company Overview
- 12.1.8.2. Products
- 12.1.8.3. Company Financials
- 12.1.8.4. SWOT Analysis
- 12.1.9 Royal Canin
- 12.1.9.1. Company Overview
- 12.1.9.2. Products
- 12.1.9.3. Company Financials
- 12.1.9.4. SWOT Analysis
- 12.1.1 Park Vet Group
- 12.2. Market Entropy
- 12.2.1 Company's Key Areas Served
- 12.2.2 Recent Developments
- 12.3. Company Market Share Analysis 2025
- 12.3.1 Top 5 Companies Market Share Analysis
- 12.3.2 Top 3 Companies Market Share Analysis
- 12.4. List of Potential Customers
- 13. Research Methodology
List of Figures
- Figure 1: Global Pet Obesity Management Industry Revenue Breakdown (billion, %) by Region 2025 & 2033
- Figure 2: Global Pet Obesity Management Industry Volume Breakdown (K Unit, %) by Region 2025 & 2033
- Figure 3: North America Pet Obesity Management Industry Revenue (billion), by Products 2025 & 2033
- Figure 4: North America Pet Obesity Management Industry Volume (K Unit), by Products 2025 & 2033
- Figure 5: North America Pet Obesity Management Industry Revenue Share (%), by Products 2025 & 2033
- Figure 6: North America Pet Obesity Management Industry Volume Share (%), by Products 2025 & 2033
- Figure 7: North America Pet Obesity Management Industry Revenue (billion), by Animal Type 2025 & 2033
- Figure 8: North America Pet Obesity Management Industry Volume (K Unit), by Animal Type 2025 & 2033
- Figure 9: North America Pet Obesity Management Industry Revenue Share (%), by Animal Type 2025 & 2033
- Figure 10: North America Pet Obesity Management Industry Volume Share (%), by Animal Type 2025 & 2033
- Figure 11: North America Pet Obesity Management Industry Revenue (billion), by End User 2025 & 2033
- Figure 12: North America Pet Obesity Management Industry Volume (K Unit), by End User 2025 & 2033
- Figure 13: North America Pet Obesity Management Industry Revenue Share (%), by End User 2025 & 2033
- Figure 14: North America Pet Obesity Management Industry Volume Share (%), by End User 2025 & 2033
- Figure 15: North America Pet Obesity Management Industry Revenue (billion), by Country 2025 & 2033
- Figure 16: North America Pet Obesity Management Industry Volume (K Unit), by Country 2025 & 2033
- Figure 17: North America Pet Obesity Management Industry Revenue Share (%), by Country 2025 & 2033
- Figure 18: North America Pet Obesity Management Industry Volume Share (%), by Country 2025 & 2033
- Figure 19: Europe Pet Obesity Management Industry Revenue (billion), by Products 2025 & 2033
- Figure 20: Europe Pet Obesity Management Industry Volume (K Unit), by Products 2025 & 2033
- Figure 21: Europe Pet Obesity Management Industry Revenue Share (%), by Products 2025 & 2033
- Figure 22: Europe Pet Obesity Management Industry Volume Share (%), by Products 2025 & 2033
- Figure 23: Europe Pet Obesity Management Industry Revenue (billion), by Animal Type 2025 & 2033
- Figure 24: Europe Pet Obesity Management Industry Volume (K Unit), by Animal Type 2025 & 2033
- Figure 25: Europe Pet Obesity Management Industry Revenue Share (%), by Animal Type 2025 & 2033
- Figure 26: Europe Pet Obesity Management Industry Volume Share (%), by Animal Type 2025 & 2033
- Figure 27: Europe Pet Obesity Management Industry Revenue (billion), by End User 2025 & 2033
- Figure 28: Europe Pet Obesity Management Industry Volume (K Unit), by End User 2025 & 2033
- Figure 29: Europe Pet Obesity Management Industry Revenue Share (%), by End User 2025 & 2033
- Figure 30: Europe Pet Obesity Management Industry Volume Share (%), by End User 2025 & 2033
- Figure 31: Europe Pet Obesity Management Industry Revenue (billion), by Country 2025 & 2033
- Figure 32: Europe Pet Obesity Management Industry Volume (K Unit), by Country 2025 & 2033
- Figure 33: Europe Pet Obesity Management Industry Revenue Share (%), by Country 2025 & 2033
- Figure 34: Europe Pet Obesity Management Industry Volume Share (%), by Country 2025 & 2033
- Figure 35: Asia Pacific Pet Obesity Management Industry Revenue (billion), by Products 2025 & 2033
- Figure 36: Asia Pacific Pet Obesity Management Industry Volume (K Unit), by Products 2025 & 2033
- Figure 37: Asia Pacific Pet Obesity Management Industry Revenue Share (%), by Products 2025 & 2033
- Figure 38: Asia Pacific Pet Obesity Management Industry Volume Share (%), by Products 2025 & 2033
- Figure 39: Asia Pacific Pet Obesity Management Industry Revenue (billion), by Animal Type 2025 & 2033
- Figure 40: Asia Pacific Pet Obesity Management Industry Volume (K Unit), by Animal Type 2025 & 2033
- Figure 41: Asia Pacific Pet Obesity Management Industry Revenue Share (%), by Animal Type 2025 & 2033
- Figure 42: Asia Pacific Pet Obesity Management Industry Volume Share (%), by Animal Type 2025 & 2033
- Figure 43: Asia Pacific Pet Obesity Management Industry Revenue (billion), by End User 2025 & 2033
- Figure 44: Asia Pacific Pet Obesity Management Industry Volume (K Unit), by End User 2025 & 2033
- Figure 45: Asia Pacific Pet Obesity Management Industry Revenue Share (%), by End User 2025 & 2033
- Figure 46: Asia Pacific Pet Obesity Management Industry Volume Share (%), by End User 2025 & 2033
- Figure 47: Asia Pacific Pet Obesity Management Industry Revenue (billion), by Country 2025 & 2033
- Figure 48: Asia Pacific Pet Obesity Management Industry Volume (K Unit), by Country 2025 & 2033
- Figure 49: Asia Pacific Pet Obesity Management Industry Revenue Share (%), by Country 2025 & 2033
- Figure 50: Asia Pacific Pet Obesity Management Industry Volume Share (%), by Country 2025 & 2033
- Figure 51: Middle East and Africa Pet Obesity Management Industry Revenue (billion), by Products 2025 & 2033
- Figure 52: Middle East and Africa Pet Obesity Management Industry Volume (K Unit), by Products 2025 & 2033
- Figure 53: Middle East and Africa Pet Obesity Management Industry Revenue Share (%), by Products 2025 & 2033
- Figure 54: Middle East and Africa Pet Obesity Management Industry Volume Share (%), by Products 2025 & 2033
- Figure 55: Middle East and Africa Pet Obesity Management Industry Revenue (billion), by Animal Type 2025 & 2033
- Figure 56: Middle East and Africa Pet Obesity Management Industry Volume (K Unit), by Animal Type 2025 & 2033
- Figure 57: Middle East and Africa Pet Obesity Management Industry Revenue Share (%), by Animal Type 2025 & 2033
- Figure 58: Middle East and Africa Pet Obesity Management Industry Volume Share (%), by Animal Type 2025 & 2033
- Figure 59: Middle East and Africa Pet Obesity Management Industry Revenue (billion), by End User 2025 & 2033
- Figure 60: Middle East and Africa Pet Obesity Management Industry Volume (K Unit), by End User 2025 & 2033
- Figure 61: Middle East and Africa Pet Obesity Management Industry Revenue Share (%), by End User 2025 & 2033
- Figure 62: Middle East and Africa Pet Obesity Management Industry Volume Share (%), by End User 2025 & 2033
- Figure 63: Middle East and Africa Pet Obesity Management Industry Revenue (billion), by Country 2025 & 2033
- Figure 64: Middle East and Africa Pet Obesity Management Industry Volume (K Unit), by Country 2025 & 2033
- Figure 65: Middle East and Africa Pet Obesity Management Industry Revenue Share (%), by Country 2025 & 2033
- Figure 66: Middle East and Africa Pet Obesity Management Industry Volume Share (%), by Country 2025 & 2033
- Figure 67: South America Pet Obesity Management Industry Revenue (billion), by Products 2025 & 2033
- Figure 68: South America Pet Obesity Management Industry Volume (K Unit), by Products 2025 & 2033
- Figure 69: South America Pet Obesity Management Industry Revenue Share (%), by Products 2025 & 2033
- Figure 70: South America Pet Obesity Management Industry Volume Share (%), by Products 2025 & 2033
- Figure 71: South America Pet Obesity Management Industry Revenue (billion), by Animal Type 2025 & 2033
- Figure 72: South America Pet Obesity Management Industry Volume (K Unit), by Animal Type 2025 & 2033
- Figure 73: South America Pet Obesity Management Industry Revenue Share (%), by Animal Type 2025 & 2033
- Figure 74: South America Pet Obesity Management Industry Volume Share (%), by Animal Type 2025 & 2033
- Figure 75: South America Pet Obesity Management Industry Revenue (billion), by End User 2025 & 2033
- Figure 76: South America Pet Obesity Management Industry Volume (K Unit), by End User 2025 & 2033
- Figure 77: South America Pet Obesity Management Industry Revenue Share (%), by End User 2025 & 2033
- Figure 78: South America Pet Obesity Management Industry Volume Share (%), by End User 2025 & 2033
- Figure 79: South America Pet Obesity Management Industry Revenue (billion), by Country 2025 & 2033
- Figure 80: South America Pet Obesity Management Industry Volume (K Unit), by Country 2025 & 2033
- Figure 81: South America Pet Obesity Management Industry Revenue Share (%), by Country 2025 & 2033
- Figure 82: South America Pet Obesity Management Industry Volume Share (%), by Country 2025 & 2033
List of Tables
- Table 1: Global Pet Obesity Management Industry Revenue billion Forecast, by Products 2020 & 2033
- Table 2: Global Pet Obesity Management Industry Volume K Unit Forecast, by Products 2020 & 2033
- Table 3: Global Pet Obesity Management Industry Revenue billion Forecast, by Animal Type 2020 & 2033
- Table 4: Global Pet Obesity Management Industry Volume K Unit Forecast, by Animal Type 2020 & 2033
- Table 5: Global Pet Obesity Management Industry Revenue billion Forecast, by End User 2020 & 2033
- Table 6: Global Pet Obesity Management Industry Volume K Unit Forecast, by End User 2020 & 2033
- Table 7: Global Pet Obesity Management Industry Revenue billion Forecast, by Region 2020 & 2033
- Table 8: Global Pet Obesity Management Industry Volume K Unit Forecast, by Region 2020 & 2033
- Table 9: Global Pet Obesity Management Industry Revenue billion Forecast, by Products 2020 & 2033
- Table 10: Global Pet Obesity Management Industry Volume K Unit Forecast, by Products 2020 & 2033
- Table 11: Global Pet Obesity Management Industry Revenue billion Forecast, by Animal Type 2020 & 2033
- Table 12: Global Pet Obesity Management Industry Volume K Unit Forecast, by Animal Type 2020 & 2033
- Table 13: Global Pet Obesity Management Industry Revenue billion Forecast, by End User 2020 & 2033
- Table 14: Global Pet Obesity Management Industry Volume K Unit Forecast, by End User 2020 & 2033
- Table 15: Global Pet Obesity Management Industry Revenue billion Forecast, by Country 2020 & 2033
- Table 16: Global Pet Obesity Management Industry Volume K Unit Forecast, by Country 2020 & 2033
- Table 17: United States Pet Obesity Management Industry Revenue (billion) Forecast, by Application 2020 & 2033
- Table 18: United States Pet Obesity Management Industry Volume (K Unit) Forecast, by Application 2020 & 2033
- Table 19: Canada Pet Obesity Management Industry Revenue (billion) Forecast, by Application 2020 & 2033
- Table 20: Canada Pet Obesity Management Industry Volume (K Unit) Forecast, by Application 2020 & 2033
- Table 21: Mexico Pet Obesity Management Industry Revenue (billion) Forecast, by Application 2020 & 2033
- Table 22: Mexico Pet Obesity Management Industry Volume (K Unit) Forecast, by Application 2020 & 2033
- Table 23: Global Pet Obesity Management Industry Revenue billion Forecast, by Products 2020 & 2033
- Table 24: Global Pet Obesity Management Industry Volume K Unit Forecast, by Products 2020 & 2033
- Table 25: Global Pet Obesity Management Industry Revenue billion Forecast, by Animal Type 2020 & 2033
- Table 26: Global Pet Obesity Management Industry Volume K Unit Forecast, by Animal Type 2020 & 2033
- Table 27: Global Pet Obesity Management Industry Revenue billion Forecast, by End User 2020 & 2033
- Table 28: Global Pet Obesity Management Industry Volume K Unit Forecast, by End User 2020 & 2033
- Table 29: Global Pet Obesity Management Industry Revenue billion Forecast, by Country 2020 & 2033
- Table 30: Global Pet Obesity Management Industry Volume K Unit Forecast, by Country 2020 & 2033
- Table 31: Germany Pet Obesity Management Industry Revenue (billion) Forecast, by Application 2020 & 2033
- Table 32: Germany Pet Obesity Management Industry Volume (K Unit) Forecast, by Application 2020 & 2033
- Table 33: United Kingdom Pet Obesity Management Industry Revenue (billion) Forecast, by Application 2020 & 2033
- Table 34: United Kingdom Pet Obesity Management Industry Volume (K Unit) Forecast, by Application 2020 & 2033
- Table 35: France Pet Obesity Management Industry Revenue (billion) Forecast, by Application 2020 & 2033
- Table 36: France Pet Obesity Management Industry Volume (K Unit) Forecast, by Application 2020 & 2033
- Table 37: Italy Pet Obesity Management Industry Revenue (billion) Forecast, by Application 2020 & 2033
- Table 38: Italy Pet Obesity Management Industry Volume (K Unit) Forecast, by Application 2020 & 2033
- Table 39: Spain Pet Obesity Management Industry Revenue (billion) Forecast, by Application 2020 & 2033
- Table 40: Spain Pet Obesity Management Industry Volume (K Unit) Forecast, by Application 2020 & 2033
- Table 41: Rest of Europe Pet Obesity Management Industry Revenue (billion) Forecast, by Application 2020 & 2033
- Table 42: Rest of Europe Pet Obesity Management Industry Volume (K Unit) Forecast, by Application 2020 & 2033
- Table 43: Global Pet Obesity Management Industry Revenue billion Forecast, by Products 2020 & 2033
- Table 44: Global Pet Obesity Management Industry Volume K Unit Forecast, by Products 2020 & 2033
- Table 45: Global Pet Obesity Management Industry Revenue billion Forecast, by Animal Type 2020 & 2033
- Table 46: Global Pet Obesity Management Industry Volume K Unit Forecast, by Animal Type 2020 & 2033
- Table 47: Global Pet Obesity Management Industry Revenue billion Forecast, by End User 2020 & 2033
- Table 48: Global Pet Obesity Management Industry Volume K Unit Forecast, by End User 2020 & 2033
- Table 49: Global Pet Obesity Management Industry Revenue billion Forecast, by Country 2020 & 2033
- Table 50: Global Pet Obesity Management Industry Volume K Unit Forecast, by Country 2020 & 2033
- Table 51: China Pet Obesity Management Industry Revenue (billion) Forecast, by Application 2020 & 2033
- Table 52: China Pet Obesity Management Industry Volume (K Unit) Forecast, by Application 2020 & 2033
- Table 53: Japan Pet Obesity Management Industry Revenue (billion) Forecast, by Application 2020 & 2033
- Table 54: Japan Pet Obesity Management Industry Volume (K Unit) Forecast, by Application 2020 & 2033
- Table 55: India Pet Obesity Management Industry Revenue (billion) Forecast, by Application 2020 & 2033
- Table 56: India Pet Obesity Management Industry Volume (K Unit) Forecast, by Application 2020 & 2033
- Table 57: Australia Pet Obesity Management Industry Revenue (billion) Forecast, by Application 2020 & 2033
- Table 58: Australia Pet Obesity Management Industry Volume (K Unit) Forecast, by Application 2020 & 2033
- Table 59: South Korea Pet Obesity Management Industry Revenue (billion) Forecast, by Application 2020 & 2033
- Table 60: South Korea Pet Obesity Management Industry Volume (K Unit) Forecast, by Application 2020 & 2033
- Table 61: Rest of Asia Pacific Pet Obesity Management Industry Revenue (billion) Forecast, by Application 2020 & 2033
- Table 62: Rest of Asia Pacific Pet Obesity Management Industry Volume (K Unit) Forecast, by Application 2020 & 2033
- Table 63: Global Pet Obesity Management Industry Revenue billion Forecast, by Products 2020 & 2033
- Table 64: Global Pet Obesity Management Industry Volume K Unit Forecast, by Products 2020 & 2033
- Table 65: Global Pet Obesity Management Industry Revenue billion Forecast, by Animal Type 2020 & 2033
- Table 66: Global Pet Obesity Management Industry Volume K Unit Forecast, by Animal Type 2020 & 2033
- Table 67: Global Pet Obesity Management Industry Revenue billion Forecast, by End User 2020 & 2033
- Table 68: Global Pet Obesity Management Industry Volume K Unit Forecast, by End User 2020 & 2033
- Table 69: Global Pet Obesity Management Industry Revenue billion Forecast, by Country 2020 & 2033
- Table 70: Global Pet Obesity Management Industry Volume K Unit Forecast, by Country 2020 & 2033
- Table 71: GCC Pet Obesity Management Industry Revenue (billion) Forecast, by Application 2020 & 2033
- Table 72: GCC Pet Obesity Management Industry Volume (K Unit) Forecast, by Application 2020 & 2033
- Table 73: South Africa Pet Obesity Management Industry Revenue (billion) Forecast, by Application 2020 & 2033
- Table 74: South Africa Pet Obesity Management Industry Volume (K Unit) Forecast, by Application 2020 & 2033
- Table 75: Rest of Middle East and Africa Pet Obesity Management Industry Revenue (billion) Forecast, by Application 2020 & 2033
- Table 76: Rest of Middle East and Africa Pet Obesity Management Industry Volume (K Unit) Forecast, by Application 2020 & 2033
- Table 77: Global Pet Obesity Management Industry Revenue billion Forecast, by Products 2020 & 2033
- Table 78: Global Pet Obesity Management Industry Volume K Unit Forecast, by Products 2020 & 2033
- Table 79: Global Pet Obesity Management Industry Revenue billion Forecast, by Animal Type 2020 & 2033
- Table 80: Global Pet Obesity Management Industry Volume K Unit Forecast, by Animal Type 2020 & 2033
- Table 81: Global Pet Obesity Management Industry Revenue billion Forecast, by End User 2020 & 2033
- Table 82: Global Pet Obesity Management Industry Volume K Unit Forecast, by End User 2020 & 2033
- Table 83: Global Pet Obesity Management Industry Revenue billion Forecast, by Country 2020 & 2033
- Table 84: Global Pet Obesity Management Industry Volume K Unit Forecast, by Country 2020 & 2033
- Table 85: Brazil Pet Obesity Management Industry Revenue (billion) Forecast, by Application 2020 & 2033
- Table 86: Brazil Pet Obesity Management Industry Volume (K Unit) Forecast, by Application 2020 & 2033
- Table 87: Argentina Pet Obesity Management Industry Revenue (billion) Forecast, by Application 2020 & 2033
- Table 88: Argentina Pet Obesity Management Industry Volume (K Unit) Forecast, by Application 2020 & 2033
- Table 89: Rest of South America Pet Obesity Management Industry Revenue (billion) Forecast, by Application 2020 & 2033
- Table 90: Rest of South America Pet Obesity Management Industry Volume (K Unit) Forecast, by Application 2020 & 2033
Frequently Asked Questions
1. What is the projected Compound Annual Growth Rate (CAGR) of the Pet Obesity Management Industry?
The projected CAGR is approximately 13.83%.
2. Which companies are prominent players in the Pet Obesity Management Industry?
Key companies in the market include Park Vet Group, Auxthera LLC, Weight Watchers, Pedigree, Pfizer Animal Health, Vivaldis, KONG Company, Hills Pet Nutrition Inc, Royal Canin.
3. What are the main segments of the Pet Obesity Management Industry?
The market segments include Products, Animal Type, End User.
4. Can you provide details about the market size?
The market size is estimated to be USD 9.67 billion as of 2022.
5. What are some drivers contributing to market growth?
Increasing Pet Ownership; Increasing Prevalence of Diabetes and Other Chronic Diseases Among Pets; Increasing Pet Insurance Policies and Coverage.
6. What are the notable trends driving market growth?
Dogs Segment is Expected to Hold a Major Share in the Pet Obesity Management Market.
7. Are there any restraints impacting market growth?
Lack of Awareness About Pet Obesity Management in Developing Economies.
8. Can you provide examples of recent developments in the market?
In May 2022, Park Vet Group launched the Veterinary Nursing Awareness campaign to raise awareness regarding the importance of veterinary nursing and pet nutrition balances.
9. What pricing options are available for accessing the report?
Pricing options include single-user, multi-user, and enterprise licenses priced at USD 4750, USD 5250, and USD 8750 respectively.
10. Is the market size provided in terms of value or volume?
The market size is provided in terms of value, measured in billion and volume, measured in K Unit.
11. Are there any specific market keywords associated with the report?
Yes, the market keyword associated with the report is "Pet Obesity Management Industry," which aids in identifying and referencing the specific market segment covered.
12. How do I determine which pricing option suits my needs best?
The pricing options vary based on user requirements and access needs. Individual users may opt for single-user licenses, while businesses requiring broader access may choose multi-user or enterprise licenses for cost-effective access to the report.
13. Are there any additional resources or data provided in the Pet Obesity Management Industry report?
While the report offers comprehensive insights, it's advisable to review the specific contents or supplementary materials provided to ascertain if additional resources or data are available.
14. How can I stay updated on further developments or reports in the Pet Obesity Management Industry?
To stay informed about further developments, trends, and reports in the Pet Obesity Management Industry, consider subscribing to industry newsletters, following relevant companies and organizations, or regularly checking reputable industry news sources and publications.
Methodology
Step 1 - Identification of Relevant Samples Size from Population Database


Step 2 - Approaches for Defining Global Market Size (Value, Volume* & Price*)

Note*: In applicable scenarios
Step 3 - Data Sources
Primary Research
- Web Analytics
- Survey Reports
- Research Institute
- Latest Research Reports
- Opinion Leaders
Secondary Research
- Annual Reports
- White Paper
- Latest Press Release
- Industry Association
- Paid Database
- Investor Presentations

Step 4 - Data Triangulation
Involves using different sources of information in order to increase the validity of a study
These sources are likely to be stakeholders in a program - participants, other researchers, program staff, other community members, and so on.
Then we put all data in single framework & apply various statistical tools to find out the dynamic on the market.
During the analysis stage, feedback from the stakeholder groups would be compared to determine areas of agreement as well as areas of divergence