

Key Insights
The global wearable injectors market is projected for significant expansion, forecasted to reach an estimated USD 10.1 billion by 2033, with a Compound Annual Growth Rate (CAGR) of 10.6% from a 2024 base year. This growth is propelled by the rising incidence of chronic conditions like diabetes, oncology, and autoimmune disorders, demanding precise and frequent drug administration. The increasing focus on patient-centric healthcare and the growing preference for home-based treatments are key drivers for these advanced drug delivery systems. Continuous technological innovation, including device miniaturization, enhanced connectivity, and improved drug compatibility, is broadening therapeutic applications and accessibility. Significant R&D investments by leading companies are further accelerating market penetration.
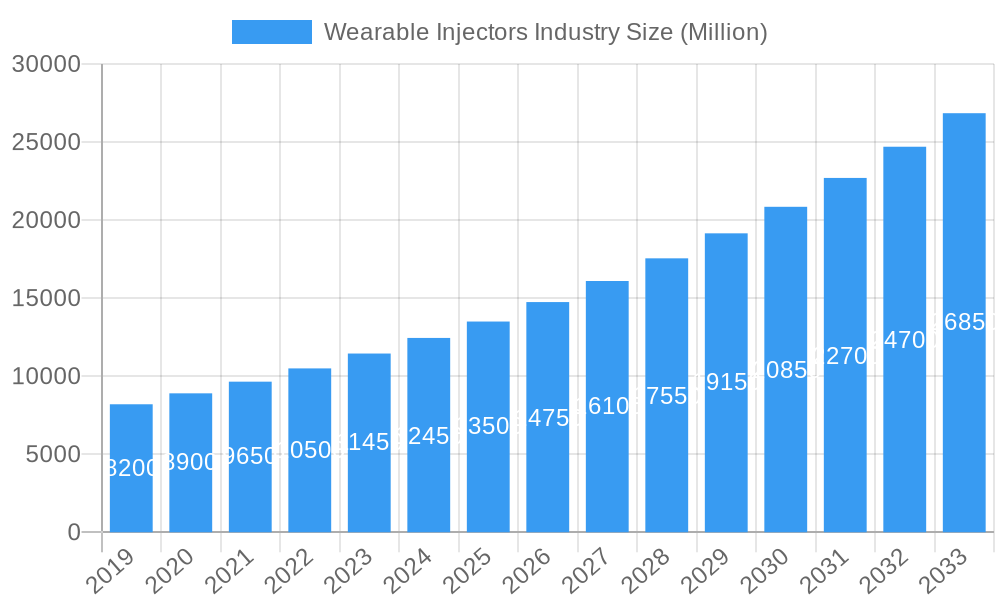
Wearable Injectors Industry Market Size (In Billion)
The adoption of convenient on-body injectors is a major market stimulant, particularly for long-term therapies, enhancing patient adherence. While oncology remains a dominant segment due to rising cancer rates and the need for targeted treatments, diabetes and autoimmune disease segments are also experiencing robust growth. Emerging economies, with improving healthcare infrastructure and increasing disposable incomes, present new market opportunities. Despite potential growth restraints from high device costs and rigorous regulatory pathways, the market outlook remains highly positive, driven by unmet medical needs and ongoing industry innovation.
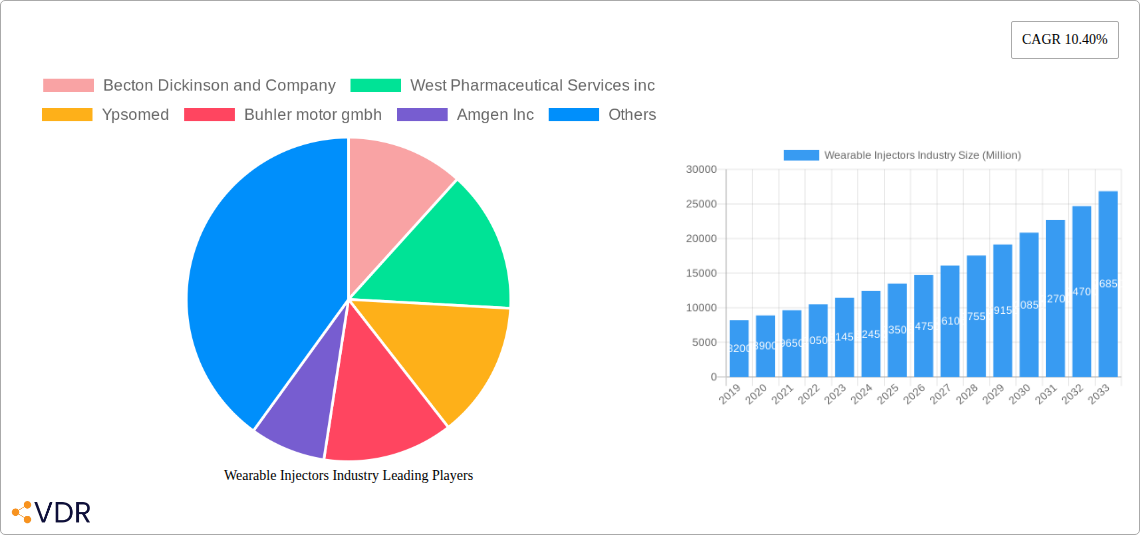
Wearable Injectors Industry Company Market Share
Wearable Injectors Industry Report: Market Analysis, Trends, and Future Outlook (2019–2033)
This comprehensive report delves into the dynamic Wearable Injectors Industry, offering in-depth analysis of market size, growth drivers, segmentation, and key player strategies. With a study period spanning from 2019 to 2033, including a base year of 2025 and a forecast period of 2025–2033, this report provides essential insights for stakeholders seeking to navigate and capitalize on the evolving landscape of drug delivery. All values are presented in Million Units for precise quantitative understanding.
Wearable Injectors Industry Market Dynamics & Structure
The Wearable Injectors Industry is characterized by a moderately concentrated market, with key players investing heavily in technological innovation to meet the growing demand for convenient and patient-centric drug administration. The primary drivers of this innovation include the increasing prevalence of chronic diseases such as diabetes, autoimmune disorders, and oncology, necessitating more frequent and user-friendly self-administration of therapeutics. Regulatory frameworks are evolving to support the approval and adoption of advanced drug delivery systems, though strict efficacy and safety standards remain paramount. Competitive product substitutes include traditional syringe-based injections and auto-injectors, but wearable injectors offer enhanced compliance and a reduced patient burden. End-user demographics are shifting towards a greater preference for home-based care, driven by an aging global population and the pursuit of improved quality of life. Mergers and acquisitions (M&A) are a recurring theme, as larger pharmaceutical companies and medical device manufacturers seek to acquire innovative technologies and expand their portfolios.
- Market Concentration: Dominated by a few key players, with increasing M&A activity.
- Technological Innovation Drivers: Rising chronic disease burden, patient preference for self-administration, advancements in miniaturization and connectivity.
- Regulatory Frameworks: FDA and EMA approvals are critical; focus on safety, efficacy, and usability.
- Competitive Product Substitutes: Traditional syringes, auto-injectors, and pen injectors.
- End-User Demographics: Growing demand from home care settings and a focus on patient convenience.
- M&A Trends: Strategic acquisitions to integrate wearable injector technology into broader drug delivery platforms.
Wearable Injectors Industry Growth Trends & Insights
The Wearable Injectors Industry is poised for substantial growth, projected to evolve from approximately 1050 Million Units in 2025 to over 2500 Million Units by 2033, exhibiting a Compound Annual Growth Rate (CAGR) of XX%. This expansion is fueled by a confluence of factors, including the escalating incidence of chronic conditions like diabetes, autoimmune diseases, and certain cancers, which require consistent and often complex therapeutic regimens. The shift towards home-based healthcare, amplified by convenience and a desire for improved patient autonomy, further propels the adoption of wearable injector systems. Technological advancements are central to this growth trajectory, with continuous innovation in areas such as miniaturization, smart connectivity for data tracking and adherence monitoring, and improved drug compatibility enabling the administration of a wider range of biologics and high-volume drugs. Consumer behavior is increasingly influenced by the demand for less invasive and more comfortable injection experiences, leading to higher patient compliance rates compared to traditional methods. The integration of these devices into personalized medicine approaches, allowing for tailored dosing and treatment regimens, also represents a significant growth accelerant.
- Market Size Evolution: From approximately 1050 Million Units in 2025 to over 2500 Million Units by 2033.
- Adoption Rates: Steadily increasing due to enhanced patient comfort and compliance.
- Technological Disruptions: Miniaturization, smart features (connectivity, data logging), advanced materials for drug compatibility.
- Consumer Behavior Shifts: Growing preference for self-administration, convenience, and reduced pain.
- Market Penetration: Expected to significantly increase across various therapeutic areas.
- Impact of Biologics: Increased demand for wearable injectors capable of delivering complex biologics.
Dominant Regions, Countries, or Segments in Wearable Injectors Industry
The On-Body Injectors segment is currently the dominant force within the Wearable Injectors Industry, driven by its advanced capabilities and suitability for chronic condition management. This segment is expected to maintain its leading position throughout the forecast period. The Diabetes therapy segment also holds significant sway, owing to the high and persistent need for insulin delivery and the widespread adoption of wearable insulin pumps and patch injectors by a large patient population.
North America is anticipated to be the dominant region, with the United States leading country-specific growth. This dominance is attributed to several factors:
- Advanced Healthcare Infrastructure: A well-developed healthcare system with robust pharmaceutical and medical device industries.
- High Prevalence of Chronic Diseases: A significant patient pool suffering from diabetes, autoimmune diseases, and oncology.
- Favorable Regulatory Environment: A relatively streamlined approval process for innovative medical devices and strong intellectual property protection.
- High Disposable Income and Healthcare Spending: Enables greater patient access to advanced and often more expensive therapeutic options.
- Early Adoption of Technology: A demographic that readily embraces new technologies for healthcare management.
Within the On-Body Injectors segment, key drivers include:
- Sustained Drug Release Capabilities: Ideal for long-term therapies requiring continuous or frequent administration.
- Improved Patient Compliance: The discreet and user-friendly nature of on-body devices encourages regular use.
- Technological Advancements: Integration of smart features for enhanced patient monitoring and data collection.
In the Diabetes therapy segment, growth is propelled by:
Growing Diabetes Population: A relentless increase in the global incidence of Type 1 and Type 2 diabetes.
Technological Innovations in Insulin Delivery: Continuous evolution of insulin pumps and patch systems.
Patient Empowerment: A strong desire among diabetic patients to actively manage their condition with convenient tools.
Dominant Segment (Type): On-Body Injectors
Dominant Segment (Therapy): Diabetes
Dominant Region: North America
Leading Country: United States
Key Drivers for On-Body Injectors: Sustained drug delivery, patient compliance, technological integration.
Key Drivers for Diabetes Therapy: Rising diabetes rates, innovation in insulin delivery, patient empowerment.
Market Share: On-Body Injectors are expected to capture over 60% of the wearable injector market by 2033.
Growth Potential: High in emerging economies as healthcare access improves.
Wearable Injectors Industry Product Landscape
The product landscape of the Wearable Injectors Industry is marked by an increasing sophistication of devices designed for enhanced patient usability and therapeutic efficacy. Innovations are centered around miniaturized, discreet, and user-friendly designs that facilitate self-administration of a diverse range of medications. Key advancements include the development of multi-dose capabilities, programmable delivery profiles for personalized dosing, and integrated connectivity for remote monitoring and data logging. These devices are crucial for the delivery of biologics and complex molecules, offering a compelling alternative to traditional injection methods. Unique selling propositions include reduced injection frequency, minimized pain and discomfort, and improved patient adherence to treatment regimens, ultimately leading to better health outcomes.
Key Drivers, Barriers & Challenges in Wearable Injectors Industry
The Wearable Injectors Industry is propelled by several key drivers. The escalating prevalence of chronic diseases requiring long-term, consistent medication, such as diabetes and autoimmune disorders, is a primary catalyst. Technological advancements enabling miniaturization, smart features, and improved drug compatibility are also significant drivers. Furthermore, a growing patient preference for convenience, home-based care, and reduced invasiveness is reshaping market demand. Supportive regulatory environments for innovative drug delivery systems also contribute to growth.
However, the industry faces notable barriers and challenges. High development and manufacturing costs associated with these advanced devices can limit accessibility. Stringent regulatory approval processes, while essential for safety, can also lead to lengthy time-to-market. Patient and physician education regarding the proper use and benefits of wearable injectors remains crucial for widespread adoption. Supply chain complexities for specialized components and the potential for device malfunctions or technical glitches present ongoing challenges. Competitive pressures from established injection methods also persist.
Emerging Opportunities in Wearable Injectors Industry
Emerging opportunities in the Wearable Injectors Industry lie in the expanding application of these devices for novel therapeutic areas beyond traditional chronic diseases. The development of smart wearable injectors with advanced connectivity for real-time patient monitoring and personalized treatment adjustments presents a significant growth avenue. Untapped markets in emerging economies, where there is a growing demand for accessible and patient-friendly healthcare solutions, offer substantial potential. Furthermore, the integration of these devices with digital health platforms and artificial intelligence for predictive analytics and improved patient outcomes is a key area for future innovation and market expansion.
Growth Accelerators in the Wearable Injectors Industry Industry
Several catalysts are driving long-term growth in the Wearable Injectors Industry. Continuous technological breakthroughs in materials science, miniaturization, and wireless connectivity are enabling the development of more sophisticated and versatile devices. Strategic partnerships between pharmaceutical companies and medical device manufacturers are crucial for integrating drug formulations with optimized delivery systems, thereby accelerating product development and market entry. Market expansion strategies, including focusing on emerging economies and developing specialized injectors for a wider array of complex biologics, are also key to sustained growth and increased adoption across diverse patient populations.
Key Players Shaping the Wearable Injectors Industry Market
- Becton Dickinson and Company
- West Pharmaceutical Services inc
- Ypsomed
- Buhler motor gmbh
- Amgen Inc
- Sensile Medical
- Dexcom Inc
- Insulet Corporation
- Tandem Diabetes Care Inc
- Eitan Medical
- Stevanato Group
- Enable Injections
- United Therapeutics (Steadymed Therapeutics)
Notable Milestones in Wearable Injectors Industry Sector
- June 2022: AbbVie received US FDA approval for SKYRIZI (risankizumab-rzaa) as the first and only specific interleukin-23 (IL-23) inhibitor for the treatment of adults with moderately to severely active Crohn's disease (CD). It can be self-administered by Subcutaneous Injection (SC) with an On-Body Injector (OBI).
- February 2022: Enable Injections raised a USD 215 million round to fund work on the subcutaneous drug delivery system enFuse. The device consists of a wearable delivery disc and a system for transferring the drug from its original vessel.
In-Depth Wearable Injectors Industry Market Outlook
The Wearable Injectors Industry is on a robust growth trajectory, driven by the increasing demand for convenient, patient-centric drug delivery solutions. The future market potential is immense, with significant opportunities arising from advancements in smart connectivity, personalized medicine, and the expanding pipeline of biologics requiring advanced delivery systems. Strategic collaborations between device manufacturers and pharmaceutical companies will be pivotal in unlocking this potential, ensuring that innovative wearable injectors are seamlessly integrated with novel therapeutics. Focus on user experience, cost-effectiveness, and expanding access to emerging markets will be crucial for capitalizing on these growth accelerators and solidifying the industry's role in transforming healthcare delivery.
Wearable Injectors Industry Segmentation
-
1. Type
- 1.1. On-Body Injectors
- 1.2. Off-Body Injectors
-
2. Therapy
- 2.1. Oncology
- 2.2. Autoimmune Disease
- 2.3. Diabetes
- 2.4. Cardiovascular Disease
- 2.5. Others
-
3. End User
- 3.1. Hospitals and Clinics
- 3.2. Home Care
- 3.3. Others
Wearable Injectors Industry Segmentation By Geography
-
1. North America
- 1.1. United States
- 1.2. Canada
- 1.3. Mexico
-
2. Europe
- 2.1. Germany
- 2.2. United Kingdom
- 2.3. France
- 2.4. Italy
- 2.5. Spain
- 2.6. Rest of Europe
-
3. Asia Pacific
- 3.1. China
- 3.2. Japan
- 3.3. India
- 3.4. Australia
- 3.5. South Korea
- 3.6. Rest of Asia Pacific
-
4. Middle East and Africa
- 4.1. GCC
- 4.2. South Africa
- 4.3. Rest of Middle East and Africa
-
5. South America
- 5.1. Brazil
- 5.2. Argentina
- 5.3. Rest of South America
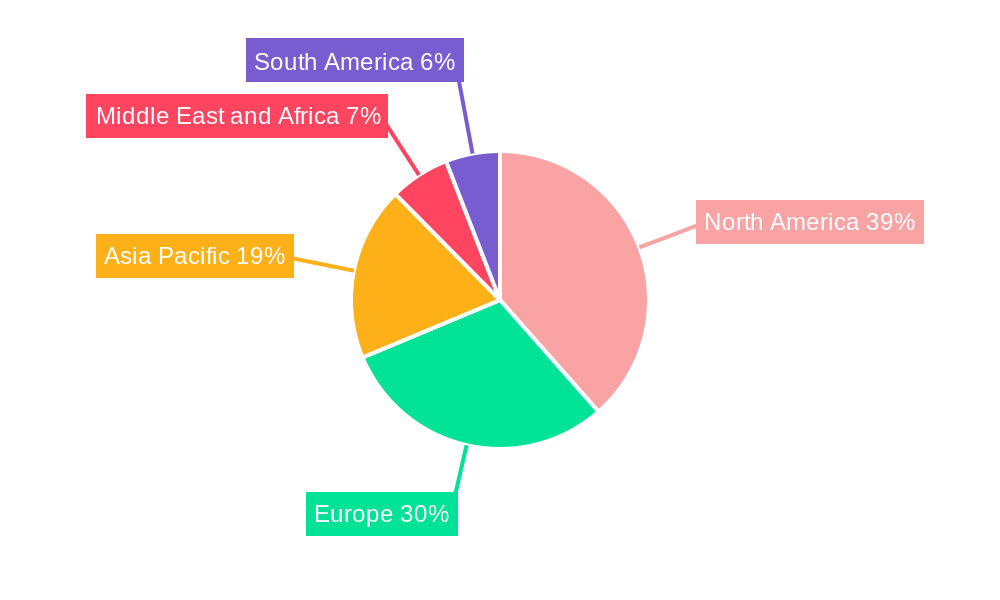
Wearable Injectors Industry Regional Market Share
Geographic Coverage of Wearable Injectors Industry
Wearable Injectors Industry REPORT HIGHLIGHTS
| Aspects | Details |
|---|---|
| Study Period | 2020-2034 |
| Base Year | 2025 |
| Estimated Year | 2026 |
| Forecast Period | 2026-2034 |
| Historical Period | 2020-2025 |
| Growth Rate | CAGR of 10.6% from 2020-2034 |
| Segmentation |
|
Table of Contents
- 1. Introduction
- 1.1. Research Scope
- 1.2. Market Segmentation
- 1.3. Research Objective
- 1.4. Definitions and Assumptions
- 2. Executive Summary
- 2.1. Market Snapshot
- 3. Market Dynamics
- 3.1. Market Drivers
- 3.2. Market Restrains
- 3.3. Market Trends
- 3.4. Market Opportunities
- 4. Market Factor Analysis
- 4.1. Porters Five Forces
- 4.1.1. Bargaining Power of Suppliers
- 4.1.2. Bargaining Power of Buyers
- 4.1.3. Threat of New Entrants
- 4.1.4. Threat of Substitutes
- 4.1.5. Competitive Rivalry
- 4.2. PESTEL analysis
- 4.3. BCG Analysis
- 4.3.1. Stars (High Growth, High Market Share)
- 4.3.2. Cash Cows (Low Growth, High Market Share)
- 4.3.3. Question Mark (High Growth, Low Market Share)
- 4.3.4. Dogs (Low Growth, Low Market Share)
- 4.4. Ansoff Matrix Analysis
- 4.5. Supply Chain Analysis
- 4.6. Regulatory Landscape
- 4.7. Current Market Potential and Opportunity Assessment (TAM–SAM–SOM Framework)
- 4.8. VDR Analyst Note
- 4.1. Porters Five Forces
- 5. Market Analysis, Insights and Forecast 2021-2033
- 5.1. Market Analysis, Insights and Forecast - by Type
- 5.1.1. On-Body Injectors
- 5.1.2. Off-Body Injectors
- 5.2. Market Analysis, Insights and Forecast - by Therapy
- 5.2.1. Oncology
- 5.2.2. Autoimmune Disease
- 5.2.3. Diabetes
- 5.2.4. Cardiovascular Disease
- 5.2.5. Others
- 5.3. Market Analysis, Insights and Forecast - by End User
- 5.3.1. Hospitals and Clinics
- 5.3.2. Home Care
- 5.3.3. Others
- 5.4. Market Analysis, Insights and Forecast - by Region
- 5.4.1. North America
- 5.4.2. Europe
- 5.4.3. Asia Pacific
- 5.4.4. Middle East and Africa
- 5.4.5. South America
- 5.1. Market Analysis, Insights and Forecast - by Type
- 6. Global Wearable Injectors Industry Analysis, Insights and Forecast, 2021-2033
- 6.1. Market Analysis, Insights and Forecast - by Type
- 6.1.1. On-Body Injectors
- 6.1.2. Off-Body Injectors
- 6.2. Market Analysis, Insights and Forecast - by Therapy
- 6.2.1. Oncology
- 6.2.2. Autoimmune Disease
- 6.2.3. Diabetes
- 6.2.4. Cardiovascular Disease
- 6.2.5. Others
- 6.3. Market Analysis, Insights and Forecast - by End User
- 6.3.1. Hospitals and Clinics
- 6.3.2. Home Care
- 6.3.3. Others
- 6.1. Market Analysis, Insights and Forecast - by Type
- 7. North America Wearable Injectors Industry Analysis, Insights and Forecast, 2021-2033
- 7.1. Market Analysis, Insights and Forecast - by Type
- 7.1.1. On-Body Injectors
- 7.1.2. Off-Body Injectors
- 7.2. Market Analysis, Insights and Forecast - by Therapy
- 7.2.1. Oncology
- 7.2.2. Autoimmune Disease
- 7.2.3. Diabetes
- 7.2.4. Cardiovascular Disease
- 7.2.5. Others
- 7.3. Market Analysis, Insights and Forecast - by End User
- 7.3.1. Hospitals and Clinics
- 7.3.2. Home Care
- 7.3.3. Others
- 7.1. Market Analysis, Insights and Forecast - by Type
- 8. Europe Wearable Injectors Industry Analysis, Insights and Forecast, 2021-2033
- 8.1. Market Analysis, Insights and Forecast - by Type
- 8.1.1. On-Body Injectors
- 8.1.2. Off-Body Injectors
- 8.2. Market Analysis, Insights and Forecast - by Therapy
- 8.2.1. Oncology
- 8.2.2. Autoimmune Disease
- 8.2.3. Diabetes
- 8.2.4. Cardiovascular Disease
- 8.2.5. Others
- 8.3. Market Analysis, Insights and Forecast - by End User
- 8.3.1. Hospitals and Clinics
- 8.3.2. Home Care
- 8.3.3. Others
- 8.1. Market Analysis, Insights and Forecast - by Type
- 9. Asia Pacific Wearable Injectors Industry Analysis, Insights and Forecast, 2021-2033
- 9.1. Market Analysis, Insights and Forecast - by Type
- 9.1.1. On-Body Injectors
- 9.1.2. Off-Body Injectors
- 9.2. Market Analysis, Insights and Forecast - by Therapy
- 9.2.1. Oncology
- 9.2.2. Autoimmune Disease
- 9.2.3. Diabetes
- 9.2.4. Cardiovascular Disease
- 9.2.5. Others
- 9.3. Market Analysis, Insights and Forecast - by End User
- 9.3.1. Hospitals and Clinics
- 9.3.2. Home Care
- 9.3.3. Others
- 9.1. Market Analysis, Insights and Forecast - by Type
- 10. Middle East and Africa Wearable Injectors Industry Analysis, Insights and Forecast, 2021-2033
- 10.1. Market Analysis, Insights and Forecast - by Type
- 10.1.1. On-Body Injectors
- 10.1.2. Off-Body Injectors
- 10.2. Market Analysis, Insights and Forecast - by Therapy
- 10.2.1. Oncology
- 10.2.2. Autoimmune Disease
- 10.2.3. Diabetes
- 10.2.4. Cardiovascular Disease
- 10.2.5. Others
- 10.3. Market Analysis, Insights and Forecast - by End User
- 10.3.1. Hospitals and Clinics
- 10.3.2. Home Care
- 10.3.3. Others
- 10.1. Market Analysis, Insights and Forecast - by Type
- 11. South America Wearable Injectors Industry Analysis, Insights and Forecast, 2021-2033
- 11.1. Market Analysis, Insights and Forecast - by Type
- 11.1.1. On-Body Injectors
- 11.1.2. Off-Body Injectors
- 11.2. Market Analysis, Insights and Forecast - by Therapy
- 11.2.1. Oncology
- 11.2.2. Autoimmune Disease
- 11.2.3. Diabetes
- 11.2.4. Cardiovascular Disease
- 11.2.5. Others
- 11.3. Market Analysis, Insights and Forecast - by End User
- 11.3.1. Hospitals and Clinics
- 11.3.2. Home Care
- 11.3.3. Others
- 11.1. Market Analysis, Insights and Forecast - by Type
- 12. Competitive Analysis
- 12.1. Company Profiles
- 12.1.1 Becton Dickinson and Company
- 12.1.1.1. Company Overview
- 12.1.1.2. Products
- 12.1.1.3. Company Financials
- 12.1.1.4. SWOT Analysis
- 12.1.2 West Pharmaceutical Services inc
- 12.1.2.1. Company Overview
- 12.1.2.2. Products
- 12.1.2.3. Company Financials
- 12.1.2.4. SWOT Analysis
- 12.1.3 Ypsomed
- 12.1.3.1. Company Overview
- 12.1.3.2. Products
- 12.1.3.3. Company Financials
- 12.1.3.4. SWOT Analysis
- 12.1.4 Buhler motor gmbh
- 12.1.4.1. Company Overview
- 12.1.4.2. Products
- 12.1.4.3. Company Financials
- 12.1.4.4. SWOT Analysis
- 12.1.5 Amgen Inc
- 12.1.5.1. Company Overview
- 12.1.5.2. Products
- 12.1.5.3. Company Financials
- 12.1.5.4. SWOT Analysis
- 12.1.6 Sensile Medical
- 12.1.6.1. Company Overview
- 12.1.6.2. Products
- 12.1.6.3. Company Financials
- 12.1.6.4. SWOT Analysis
- 12.1.7 Dexcom Inc
- 12.1.7.1. Company Overview
- 12.1.7.2. Products
- 12.1.7.3. Company Financials
- 12.1.7.4. SWOT Analysis
- 12.1.8 Insulet Corporation
- 12.1.8.1. Company Overview
- 12.1.8.2. Products
- 12.1.8.3. Company Financials
- 12.1.8.4. SWOT Analysis
- 12.1.9 Tandem Diabetes Care Inc
- 12.1.9.1. Company Overview
- 12.1.9.2. Products
- 12.1.9.3. Company Financials
- 12.1.9.4. SWOT Analysis
- 12.1.10 Eitan Medical
- 12.1.10.1. Company Overview
- 12.1.10.2. Products
- 12.1.10.3. Company Financials
- 12.1.10.4. SWOT Analysis
- 12.1.11 Stevanato Group
- 12.1.11.1. Company Overview
- 12.1.11.2. Products
- 12.1.11.3. Company Financials
- 12.1.11.4. SWOT Analysis
- 12.1.12 Enable Injections
- 12.1.12.1. Company Overview
- 12.1.12.2. Products
- 12.1.12.3. Company Financials
- 12.1.12.4. SWOT Analysis
- 12.1.13 United Therapeutics (Steadymed Therapeutics)
- 12.1.13.1. Company Overview
- 12.1.13.2. Products
- 12.1.13.3. Company Financials
- 12.1.13.4. SWOT Analysis
- 12.1.1 Becton Dickinson and Company
- 12.2. Market Entropy
- 12.2.1 Company's Key Areas Served
- 12.2.2 Recent Developments
- 12.3. Company Market Share Analysis 2025
- 12.3.1 Top 5 Companies Market Share Analysis
- 12.3.2 Top 3 Companies Market Share Analysis
- 12.4. List of Potential Customers
- 13. Research Methodology
List of Figures
- Figure 1: Global Wearable Injectors Industry Revenue Breakdown (billion, %) by Region 2025 & 2033
- Figure 2: Global Wearable Injectors Industry Volume Breakdown (K Unit, %) by Region 2025 & 2033
- Figure 3: North America Wearable Injectors Industry Revenue (billion), by Type 2025 & 2033
- Figure 4: North America Wearable Injectors Industry Volume (K Unit), by Type 2025 & 2033
- Figure 5: North America Wearable Injectors Industry Revenue Share (%), by Type 2025 & 2033
- Figure 6: North America Wearable Injectors Industry Volume Share (%), by Type 2025 & 2033
- Figure 7: North America Wearable Injectors Industry Revenue (billion), by Therapy 2025 & 2033
- Figure 8: North America Wearable Injectors Industry Volume (K Unit), by Therapy 2025 & 2033
- Figure 9: North America Wearable Injectors Industry Revenue Share (%), by Therapy 2025 & 2033
- Figure 10: North America Wearable Injectors Industry Volume Share (%), by Therapy 2025 & 2033
- Figure 11: North America Wearable Injectors Industry Revenue (billion), by End User 2025 & 2033
- Figure 12: North America Wearable Injectors Industry Volume (K Unit), by End User 2025 & 2033
- Figure 13: North America Wearable Injectors Industry Revenue Share (%), by End User 2025 & 2033
- Figure 14: North America Wearable Injectors Industry Volume Share (%), by End User 2025 & 2033
- Figure 15: North America Wearable Injectors Industry Revenue (billion), by Country 2025 & 2033
- Figure 16: North America Wearable Injectors Industry Volume (K Unit), by Country 2025 & 2033
- Figure 17: North America Wearable Injectors Industry Revenue Share (%), by Country 2025 & 2033
- Figure 18: North America Wearable Injectors Industry Volume Share (%), by Country 2025 & 2033
- Figure 19: Europe Wearable Injectors Industry Revenue (billion), by Type 2025 & 2033
- Figure 20: Europe Wearable Injectors Industry Volume (K Unit), by Type 2025 & 2033
- Figure 21: Europe Wearable Injectors Industry Revenue Share (%), by Type 2025 & 2033
- Figure 22: Europe Wearable Injectors Industry Volume Share (%), by Type 2025 & 2033
- Figure 23: Europe Wearable Injectors Industry Revenue (billion), by Therapy 2025 & 2033
- Figure 24: Europe Wearable Injectors Industry Volume (K Unit), by Therapy 2025 & 2033
- Figure 25: Europe Wearable Injectors Industry Revenue Share (%), by Therapy 2025 & 2033
- Figure 26: Europe Wearable Injectors Industry Volume Share (%), by Therapy 2025 & 2033
- Figure 27: Europe Wearable Injectors Industry Revenue (billion), by End User 2025 & 2033
- Figure 28: Europe Wearable Injectors Industry Volume (K Unit), by End User 2025 & 2033
- Figure 29: Europe Wearable Injectors Industry Revenue Share (%), by End User 2025 & 2033
- Figure 30: Europe Wearable Injectors Industry Volume Share (%), by End User 2025 & 2033
- Figure 31: Europe Wearable Injectors Industry Revenue (billion), by Country 2025 & 2033
- Figure 32: Europe Wearable Injectors Industry Volume (K Unit), by Country 2025 & 2033
- Figure 33: Europe Wearable Injectors Industry Revenue Share (%), by Country 2025 & 2033
- Figure 34: Europe Wearable Injectors Industry Volume Share (%), by Country 2025 & 2033
- Figure 35: Asia Pacific Wearable Injectors Industry Revenue (billion), by Type 2025 & 2033
- Figure 36: Asia Pacific Wearable Injectors Industry Volume (K Unit), by Type 2025 & 2033
- Figure 37: Asia Pacific Wearable Injectors Industry Revenue Share (%), by Type 2025 & 2033
- Figure 38: Asia Pacific Wearable Injectors Industry Volume Share (%), by Type 2025 & 2033
- Figure 39: Asia Pacific Wearable Injectors Industry Revenue (billion), by Therapy 2025 & 2033
- Figure 40: Asia Pacific Wearable Injectors Industry Volume (K Unit), by Therapy 2025 & 2033
- Figure 41: Asia Pacific Wearable Injectors Industry Revenue Share (%), by Therapy 2025 & 2033
- Figure 42: Asia Pacific Wearable Injectors Industry Volume Share (%), by Therapy 2025 & 2033
- Figure 43: Asia Pacific Wearable Injectors Industry Revenue (billion), by End User 2025 & 2033
- Figure 44: Asia Pacific Wearable Injectors Industry Volume (K Unit), by End User 2025 & 2033
- Figure 45: Asia Pacific Wearable Injectors Industry Revenue Share (%), by End User 2025 & 2033
- Figure 46: Asia Pacific Wearable Injectors Industry Volume Share (%), by End User 2025 & 2033
- Figure 47: Asia Pacific Wearable Injectors Industry Revenue (billion), by Country 2025 & 2033
- Figure 48: Asia Pacific Wearable Injectors Industry Volume (K Unit), by Country 2025 & 2033
- Figure 49: Asia Pacific Wearable Injectors Industry Revenue Share (%), by Country 2025 & 2033
- Figure 50: Asia Pacific Wearable Injectors Industry Volume Share (%), by Country 2025 & 2033
- Figure 51: Middle East and Africa Wearable Injectors Industry Revenue (billion), by Type 2025 & 2033
- Figure 52: Middle East and Africa Wearable Injectors Industry Volume (K Unit), by Type 2025 & 2033
- Figure 53: Middle East and Africa Wearable Injectors Industry Revenue Share (%), by Type 2025 & 2033
- Figure 54: Middle East and Africa Wearable Injectors Industry Volume Share (%), by Type 2025 & 2033
- Figure 55: Middle East and Africa Wearable Injectors Industry Revenue (billion), by Therapy 2025 & 2033
- Figure 56: Middle East and Africa Wearable Injectors Industry Volume (K Unit), by Therapy 2025 & 2033
- Figure 57: Middle East and Africa Wearable Injectors Industry Revenue Share (%), by Therapy 2025 & 2033
- Figure 58: Middle East and Africa Wearable Injectors Industry Volume Share (%), by Therapy 2025 & 2033
- Figure 59: Middle East and Africa Wearable Injectors Industry Revenue (billion), by End User 2025 & 2033
- Figure 60: Middle East and Africa Wearable Injectors Industry Volume (K Unit), by End User 2025 & 2033
- Figure 61: Middle East and Africa Wearable Injectors Industry Revenue Share (%), by End User 2025 & 2033
- Figure 62: Middle East and Africa Wearable Injectors Industry Volume Share (%), by End User 2025 & 2033
- Figure 63: Middle East and Africa Wearable Injectors Industry Revenue (billion), by Country 2025 & 2033
- Figure 64: Middle East and Africa Wearable Injectors Industry Volume (K Unit), by Country 2025 & 2033
- Figure 65: Middle East and Africa Wearable Injectors Industry Revenue Share (%), by Country 2025 & 2033
- Figure 66: Middle East and Africa Wearable Injectors Industry Volume Share (%), by Country 2025 & 2033
- Figure 67: South America Wearable Injectors Industry Revenue (billion), by Type 2025 & 2033
- Figure 68: South America Wearable Injectors Industry Volume (K Unit), by Type 2025 & 2033
- Figure 69: South America Wearable Injectors Industry Revenue Share (%), by Type 2025 & 2033
- Figure 70: South America Wearable Injectors Industry Volume Share (%), by Type 2025 & 2033
- Figure 71: South America Wearable Injectors Industry Revenue (billion), by Therapy 2025 & 2033
- Figure 72: South America Wearable Injectors Industry Volume (K Unit), by Therapy 2025 & 2033
- Figure 73: South America Wearable Injectors Industry Revenue Share (%), by Therapy 2025 & 2033
- Figure 74: South America Wearable Injectors Industry Volume Share (%), by Therapy 2025 & 2033
- Figure 75: South America Wearable Injectors Industry Revenue (billion), by End User 2025 & 2033
- Figure 76: South America Wearable Injectors Industry Volume (K Unit), by End User 2025 & 2033
- Figure 77: South America Wearable Injectors Industry Revenue Share (%), by End User 2025 & 2033
- Figure 78: South America Wearable Injectors Industry Volume Share (%), by End User 2025 & 2033
- Figure 79: South America Wearable Injectors Industry Revenue (billion), by Country 2025 & 2033
- Figure 80: South America Wearable Injectors Industry Volume (K Unit), by Country 2025 & 2033
- Figure 81: South America Wearable Injectors Industry Revenue Share (%), by Country 2025 & 2033
- Figure 82: South America Wearable Injectors Industry Volume Share (%), by Country 2025 & 2033
List of Tables
- Table 1: Global Wearable Injectors Industry Revenue billion Forecast, by Type 2020 & 2033
- Table 2: Global Wearable Injectors Industry Volume K Unit Forecast, by Type 2020 & 2033
- Table 3: Global Wearable Injectors Industry Revenue billion Forecast, by Therapy 2020 & 2033
- Table 4: Global Wearable Injectors Industry Volume K Unit Forecast, by Therapy 2020 & 2033
- Table 5: Global Wearable Injectors Industry Revenue billion Forecast, by End User 2020 & 2033
- Table 6: Global Wearable Injectors Industry Volume K Unit Forecast, by End User 2020 & 2033
- Table 7: Global Wearable Injectors Industry Revenue billion Forecast, by Region 2020 & 2033
- Table 8: Global Wearable Injectors Industry Volume K Unit Forecast, by Region 2020 & 2033
- Table 9: Global Wearable Injectors Industry Revenue billion Forecast, by Type 2020 & 2033
- Table 10: Global Wearable Injectors Industry Volume K Unit Forecast, by Type 2020 & 2033
- Table 11: Global Wearable Injectors Industry Revenue billion Forecast, by Therapy 2020 & 2033
- Table 12: Global Wearable Injectors Industry Volume K Unit Forecast, by Therapy 2020 & 2033
- Table 13: Global Wearable Injectors Industry Revenue billion Forecast, by End User 2020 & 2033
- Table 14: Global Wearable Injectors Industry Volume K Unit Forecast, by End User 2020 & 2033
- Table 15: Global Wearable Injectors Industry Revenue billion Forecast, by Country 2020 & 2033
- Table 16: Global Wearable Injectors Industry Volume K Unit Forecast, by Country 2020 & 2033
- Table 17: United States Wearable Injectors Industry Revenue (billion) Forecast, by Application 2020 & 2033
- Table 18: United States Wearable Injectors Industry Volume (K Unit) Forecast, by Application 2020 & 2033
- Table 19: Canada Wearable Injectors Industry Revenue (billion) Forecast, by Application 2020 & 2033
- Table 20: Canada Wearable Injectors Industry Volume (K Unit) Forecast, by Application 2020 & 2033
- Table 21: Mexico Wearable Injectors Industry Revenue (billion) Forecast, by Application 2020 & 2033
- Table 22: Mexico Wearable Injectors Industry Volume (K Unit) Forecast, by Application 2020 & 2033
- Table 23: Global Wearable Injectors Industry Revenue billion Forecast, by Type 2020 & 2033
- Table 24: Global Wearable Injectors Industry Volume K Unit Forecast, by Type 2020 & 2033
- Table 25: Global Wearable Injectors Industry Revenue billion Forecast, by Therapy 2020 & 2033
- Table 26: Global Wearable Injectors Industry Volume K Unit Forecast, by Therapy 2020 & 2033
- Table 27: Global Wearable Injectors Industry Revenue billion Forecast, by End User 2020 & 2033
- Table 28: Global Wearable Injectors Industry Volume K Unit Forecast, by End User 2020 & 2033
- Table 29: Global Wearable Injectors Industry Revenue billion Forecast, by Country 2020 & 2033
- Table 30: Global Wearable Injectors Industry Volume K Unit Forecast, by Country 2020 & 2033
- Table 31: Germany Wearable Injectors Industry Revenue (billion) Forecast, by Application 2020 & 2033
- Table 32: Germany Wearable Injectors Industry Volume (K Unit) Forecast, by Application 2020 & 2033
- Table 33: United Kingdom Wearable Injectors Industry Revenue (billion) Forecast, by Application 2020 & 2033
- Table 34: United Kingdom Wearable Injectors Industry Volume (K Unit) Forecast, by Application 2020 & 2033
- Table 35: France Wearable Injectors Industry Revenue (billion) Forecast, by Application 2020 & 2033
- Table 36: France Wearable Injectors Industry Volume (K Unit) Forecast, by Application 2020 & 2033
- Table 37: Italy Wearable Injectors Industry Revenue (billion) Forecast, by Application 2020 & 2033
- Table 38: Italy Wearable Injectors Industry Volume (K Unit) Forecast, by Application 2020 & 2033
- Table 39: Spain Wearable Injectors Industry Revenue (billion) Forecast, by Application 2020 & 2033
- Table 40: Spain Wearable Injectors Industry Volume (K Unit) Forecast, by Application 2020 & 2033
- Table 41: Rest of Europe Wearable Injectors Industry Revenue (billion) Forecast, by Application 2020 & 2033
- Table 42: Rest of Europe Wearable Injectors Industry Volume (K Unit) Forecast, by Application 2020 & 2033
- Table 43: Global Wearable Injectors Industry Revenue billion Forecast, by Type 2020 & 2033
- Table 44: Global Wearable Injectors Industry Volume K Unit Forecast, by Type 2020 & 2033
- Table 45: Global Wearable Injectors Industry Revenue billion Forecast, by Therapy 2020 & 2033
- Table 46: Global Wearable Injectors Industry Volume K Unit Forecast, by Therapy 2020 & 2033
- Table 47: Global Wearable Injectors Industry Revenue billion Forecast, by End User 2020 & 2033
- Table 48: Global Wearable Injectors Industry Volume K Unit Forecast, by End User 2020 & 2033
- Table 49: Global Wearable Injectors Industry Revenue billion Forecast, by Country 2020 & 2033
- Table 50: Global Wearable Injectors Industry Volume K Unit Forecast, by Country 2020 & 2033
- Table 51: China Wearable Injectors Industry Revenue (billion) Forecast, by Application 2020 & 2033
- Table 52: China Wearable Injectors Industry Volume (K Unit) Forecast, by Application 2020 & 2033
- Table 53: Japan Wearable Injectors Industry Revenue (billion) Forecast, by Application 2020 & 2033
- Table 54: Japan Wearable Injectors Industry Volume (K Unit) Forecast, by Application 2020 & 2033
- Table 55: India Wearable Injectors Industry Revenue (billion) Forecast, by Application 2020 & 2033
- Table 56: India Wearable Injectors Industry Volume (K Unit) Forecast, by Application 2020 & 2033
- Table 57: Australia Wearable Injectors Industry Revenue (billion) Forecast, by Application 2020 & 2033
- Table 58: Australia Wearable Injectors Industry Volume (K Unit) Forecast, by Application 2020 & 2033
- Table 59: South Korea Wearable Injectors Industry Revenue (billion) Forecast, by Application 2020 & 2033
- Table 60: South Korea Wearable Injectors Industry Volume (K Unit) Forecast, by Application 2020 & 2033
- Table 61: Rest of Asia Pacific Wearable Injectors Industry Revenue (billion) Forecast, by Application 2020 & 2033
- Table 62: Rest of Asia Pacific Wearable Injectors Industry Volume (K Unit) Forecast, by Application 2020 & 2033
- Table 63: Global Wearable Injectors Industry Revenue billion Forecast, by Type 2020 & 2033
- Table 64: Global Wearable Injectors Industry Volume K Unit Forecast, by Type 2020 & 2033
- Table 65: Global Wearable Injectors Industry Revenue billion Forecast, by Therapy 2020 & 2033
- Table 66: Global Wearable Injectors Industry Volume K Unit Forecast, by Therapy 2020 & 2033
- Table 67: Global Wearable Injectors Industry Revenue billion Forecast, by End User 2020 & 2033
- Table 68: Global Wearable Injectors Industry Volume K Unit Forecast, by End User 2020 & 2033
- Table 69: Global Wearable Injectors Industry Revenue billion Forecast, by Country 2020 & 2033
- Table 70: Global Wearable Injectors Industry Volume K Unit Forecast, by Country 2020 & 2033
- Table 71: GCC Wearable Injectors Industry Revenue (billion) Forecast, by Application 2020 & 2033
- Table 72: GCC Wearable Injectors Industry Volume (K Unit) Forecast, by Application 2020 & 2033
- Table 73: South Africa Wearable Injectors Industry Revenue (billion) Forecast, by Application 2020 & 2033
- Table 74: South Africa Wearable Injectors Industry Volume (K Unit) Forecast, by Application 2020 & 2033
- Table 75: Rest of Middle East and Africa Wearable Injectors Industry Revenue (billion) Forecast, by Application 2020 & 2033
- Table 76: Rest of Middle East and Africa Wearable Injectors Industry Volume (K Unit) Forecast, by Application 2020 & 2033
- Table 77: Global Wearable Injectors Industry Revenue billion Forecast, by Type 2020 & 2033
- Table 78: Global Wearable Injectors Industry Volume K Unit Forecast, by Type 2020 & 2033
- Table 79: Global Wearable Injectors Industry Revenue billion Forecast, by Therapy 2020 & 2033
- Table 80: Global Wearable Injectors Industry Volume K Unit Forecast, by Therapy 2020 & 2033
- Table 81: Global Wearable Injectors Industry Revenue billion Forecast, by End User 2020 & 2033
- Table 82: Global Wearable Injectors Industry Volume K Unit Forecast, by End User 2020 & 2033
- Table 83: Global Wearable Injectors Industry Revenue billion Forecast, by Country 2020 & 2033
- Table 84: Global Wearable Injectors Industry Volume K Unit Forecast, by Country 2020 & 2033
- Table 85: Brazil Wearable Injectors Industry Revenue (billion) Forecast, by Application 2020 & 2033
- Table 86: Brazil Wearable Injectors Industry Volume (K Unit) Forecast, by Application 2020 & 2033
- Table 87: Argentina Wearable Injectors Industry Revenue (billion) Forecast, by Application 2020 & 2033
- Table 88: Argentina Wearable Injectors Industry Volume (K Unit) Forecast, by Application 2020 & 2033
- Table 89: Rest of South America Wearable Injectors Industry Revenue (billion) Forecast, by Application 2020 & 2033
- Table 90: Rest of South America Wearable Injectors Industry Volume (K Unit) Forecast, by Application 2020 & 2033
Frequently Asked Questions
1. What is the projected Compound Annual Growth Rate (CAGR) of the Wearable Injectors Industry?
The projected CAGR is approximately 10.6%.
2. Which companies are prominent players in the Wearable Injectors Industry?
Key companies in the market include Becton Dickinson and Company, West Pharmaceutical Services inc, Ypsomed, Buhler motor gmbh, Amgen Inc, Sensile Medical, Dexcom Inc, Insulet Corporation, Tandem Diabetes Care Inc, Eitan Medical, Stevanato Group, Enable Injections, United Therapeutics (Steadymed Therapeutics).
3. What are the main segments of the Wearable Injectors Industry?
The market segments include Type, Therapy, End User.
4. Can you provide details about the market size?
The market size is estimated to be USD 10.1 billion as of 2022.
5. What are some drivers contributing to market growth?
Growing Prevalence of Chronic Diseases; Technological Advancements; Increasing Concern over the Hazards and Limitations Related to Needle stick.
6. What are the notable trends driving market growth?
Oncology Segment is Expected to Hold Significant Market Share Over the Forecast Period.
7. Are there any restraints impacting market growth?
Preference for Alternative Drug Delivery Modes; Unfavorable Reimbursement Structure in Developing Countries.
8. Can you provide examples of recent developments in the market?
June 2022: AbbVie received US FDA approval for SKYRIZI (risankizumab-rzaa) as the first and only specific interleukin-23 (IL-23) inhibitor for the treatment of adults with moderately to severely active Crohn's disease (CD). It can be self-administered by Subcutaneous Injection (SC) with an On-Body Injector (OBI).
9. What pricing options are available for accessing the report?
Pricing options include single-user, multi-user, and enterprise licenses priced at USD 4750, USD 5250, and USD 8750 respectively.
10. Is the market size provided in terms of value or volume?
The market size is provided in terms of value, measured in billion and volume, measured in K Unit.
11. Are there any specific market keywords associated with the report?
Yes, the market keyword associated with the report is "Wearable Injectors Industry," which aids in identifying and referencing the specific market segment covered.
12. How do I determine which pricing option suits my needs best?
The pricing options vary based on user requirements and access needs. Individual users may opt for single-user licenses, while businesses requiring broader access may choose multi-user or enterprise licenses for cost-effective access to the report.
13. Are there any additional resources or data provided in the Wearable Injectors Industry report?
While the report offers comprehensive insights, it's advisable to review the specific contents or supplementary materials provided to ascertain if additional resources or data are available.
14. How can I stay updated on further developments or reports in the Wearable Injectors Industry?
To stay informed about further developments, trends, and reports in the Wearable Injectors Industry, consider subscribing to industry newsletters, following relevant companies and organizations, or regularly checking reputable industry news sources and publications.
Methodology
Step 1 - Identification of Relevant Samples Size from Population Database


Step 2 - Approaches for Defining Global Market Size (Value, Volume* & Price*)

Note*: In applicable scenarios
Step 3 - Data Sources
Primary Research
- Web Analytics
- Survey Reports
- Research Institute
- Latest Research Reports
- Opinion Leaders
Secondary Research
- Annual Reports
- White Paper
- Latest Press Release
- Industry Association
- Paid Database
- Investor Presentations

Step 4 - Data Triangulation
Involves using different sources of information in order to increase the validity of a study
These sources are likely to be stakeholders in a program - participants, other researchers, program staff, other community members, and so on.
Then we put all data in single framework & apply various statistical tools to find out the dynamic on the market.
During the analysis stage, feedback from the stakeholder groups would be compared to determine areas of agreement as well as areas of divergence