

Key Insights
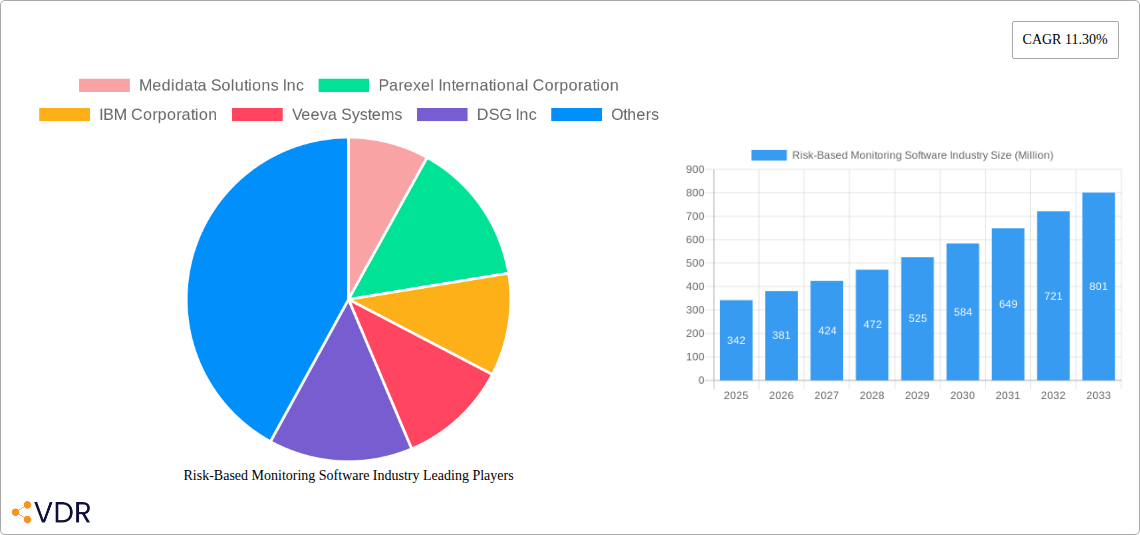
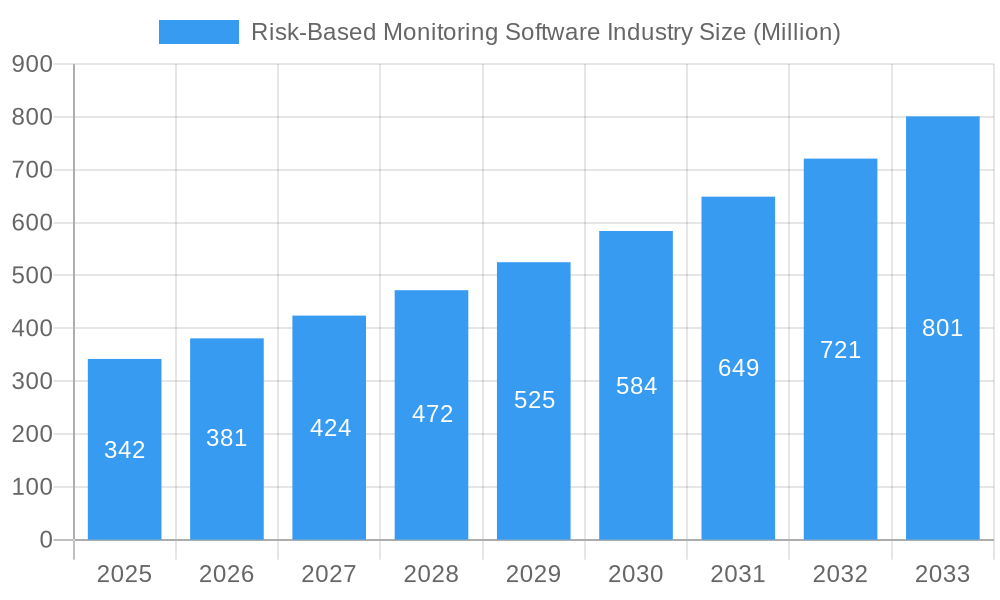
The global Risk-Based Monitoring (RBM) Software market is poised for substantial expansion, projected to reach an estimated $342 million by 2025, exhibiting a robust Compound Annual Growth Rate (CAGR) of 11.30%. This impressive growth trajectory is primarily fueled by the increasing complexity of clinical trials, the growing emphasis on data integrity, and regulatory bodies' proactive push towards more efficient and effective trial oversight. Pharmaceutical and biopharmaceutical companies, in particular, are heavily investing in RBM solutions to optimize their trial operations, reduce costs associated with traditional monitoring methods, and expedite the drug development process. The inherent benefits of RBM, such as enhanced patient safety, improved data quality, and early detection of risks, are key drivers propelling its adoption across the industry. The market's expansion is further supported by technological advancements in software, including AI and machine learning, which are enhancing predictive capabilities and streamlining monitoring workflows.
Risk-Based Monitoring Software Industry Market Size (In Million)
The RBM Software market is segmented across various components, delivery modes, and end-users, reflecting its broad applicability. The software segment, encompassing core RBM functionalities and advanced analytics, is expected to dominate. Web-based and cloud-based delivery models are gaining significant traction due to their scalability, accessibility, and cost-effectiveness, while on-premise solutions cater to organizations with specific data security requirements. The primary end-users, including Pharma and Biopharmaceutical Companies, Medical Device Companies, and Contract Research Organizations (CROs), are actively seeking sophisticated RBM solutions. North America currently leads the market, driven by early adoption and strong regulatory frameworks. However, the Asia Pacific region is anticipated to witness the fastest growth, propelled by expanding clinical trial activities and increasing investments in healthcare infrastructure. Emerging trends include the integration of RBM with other clinical trial management systems (CTMS) and electronic data capture (EDC) platforms, leading to a more unified and intelligent approach to trial oversight. While the market is robust, challenges such as the initial implementation costs and the need for specialized training can pose moderate restraints for smaller organizations.
Risk-Based Monitoring Software Industry Company Market Share
Risk-Based Monitoring (RBM) Software Market: Strategic Insights and Growth Forecast (2019-2033)
This comprehensive report delivers an in-depth analysis of the global Risk-Based Monitoring (RBM) Software market, projected to witness significant expansion and transformation. With the healthcare industry's increasing focus on efficient, compliant, and patient-centric clinical trials, RBM software has become indispensable. This report provides a granular view of market dynamics, growth trajectories, regional dominance, product innovations, key drivers, challenges, emerging opportunities, and leading players shaping the future of RBM software solutions. It is meticulously crafted for industry professionals, including stakeholders in pharmaceutical and biopharmaceutical companies, medical device manufacturers, contract research organizations (CROs), and technology providers.
Risk-Based Monitoring Software Industry Market Dynamics & Structure
The Risk-Based Monitoring (RBM) Software market is characterized by a dynamic interplay of technological advancements, evolving regulatory landscapes, and intense competition. Market concentration is moderately fragmented, with key players vying for market share through continuous innovation and strategic partnerships. Technological innovation is primarily driven by the demand for enhanced data analytics, artificial intelligence (AI) integration, and real-time monitoring capabilities to improve clinical trial efficiency and patient safety. Regulatory frameworks, such as Good Clinical Practice (GCP) guidelines, strongly influence adoption, pushing organizations towards RBM solutions that ensure data integrity and compliance. Competitive product substitutes, including traditional source data verification (SDV) methods, are increasingly being displaced by the superior efficiency and cost-effectiveness of RBM. End-user demographics are dominated by large pharmaceutical and biopharmaceutical companies and CROs, who are the primary adopters of these advanced software solutions. Merger and acquisition (M&A) trends indicate a consolidation phase, with larger entities acquiring innovative startups to expand their RBM portfolios and market reach.
- Market Concentration: Moderately fragmented with key players focusing on innovation and strategic alliances.
- Technological Drivers: AI integration, big data analytics, real-time monitoring, predictive analytics.
- Regulatory Influence: Strict adherence to GCP, FDA, and EMA guidelines driving RBM adoption.
- Competitive Landscape: Displacement of traditional SDV by RBM software due to efficiency gains.
- End-User Dominance: Pharma/Biopharma companies and CROs are the primary market segments.
- M&A Activity: Consolidation through acquisitions to enhance product offerings and market presence.
Risk-Based Monitoring Software Industry Growth Trends & Insights
The global Risk-Based Monitoring (RBM) Software market is poised for substantial growth, fueled by the escalating complexity and cost of clinical trials, alongside the imperative for enhanced data quality and patient safety. The adoption rate of RBM software is accelerating as organizations recognize its potential to optimize resource allocation, reduce trial timelines, and minimize risks. Technological disruptions, particularly in areas like artificial intelligence (AI) and machine learning (ML), are revolutionizing RBM capabilities, enabling more sophisticated risk identification and mitigation strategies. Consumer behavior shifts are evident, with an increasing demand for cloud-based, user-friendly RBM solutions that offer seamless integration with other clinical trial management systems. The market size is projected to grow at a significant Compound Annual Growth Rate (CAGR) of XX% during the forecast period (2025–2033), reaching an estimated market value of $XX Billion by 2033. This expansion is a direct response to the industry's ongoing pursuit of operational excellence and regulatory compliance in a rapidly evolving healthcare ecosystem. The parent market, encompassing broader clinical trial management software, provides a fertile ground for RBM software's penetration, with RBM software itself acting as a specialized and high-growth child market.
Dominant Regions, Countries, or Segments in Risk-Based Monitoring Software Industry
North America currently holds a dominant position in the Risk-Based Monitoring (RBM) Software market, driven by a robust pharmaceutical and biopharmaceutical industry, significant R&D investments, and stringent regulatory requirements that mandate advanced data oversight. The United States, in particular, is a key contributor, with a high concentration of leading pharmaceutical companies and CROs actively adopting cutting-edge RBM solutions. The dominance of North America can be attributed to its advanced healthcare infrastructure, favorable economic policies supporting clinical research, and early adoption of technological innovations. The "Pharma and Biopharmaceutical Companies" segment, as an end-user, is the largest and fastest-growing segment within the RBM software market, contributing an estimated XX% to the overall market revenue in 2025. This segment's growth is propelled by the increasing number and complexity of clinical trials undertaken by these entities. Cloud-based delivery modes are also experiencing rapid expansion, reflecting a global trend towards flexible, scalable, and accessible software solutions. The market penetration in this segment is projected to reach XX% by 2030.
- Dominant Region: North America, led by the United States.
- Key Drivers: High R&D spending, strong regulatory environment, presence of major pharma and biopharma companies.
- Dominant End User Segment: Pharma and Biopharmaceutical Companies.
- Market Share (2025): XX%
- Growth Potential: Fueled by increasing trial complexity and investment in drug development.
- Dominant Delivery Mode: Cloud-based solutions.
- Adoption Drivers: Scalability, accessibility, cost-effectiveness, and ease of integration.
- Key Countries: United States, Germany, United Kingdom, Japan, China.
Risk-Based Monitoring Software Industry Product Landscape
The Risk-Based Monitoring (RBM) Software product landscape is defined by sophisticated platforms offering comprehensive data management, risk assessment, and anomaly detection capabilities. Innovations focus on intuitive dashboards, advanced analytics powered by AI and ML, and seamless integration with electronic data capture (EDC) systems, clinical trial management systems (CTMS), and other clinical trial software. Unique selling propositions include real-time risk identification, predictive analytics for proactive intervention, and automated reporting features that significantly reduce manual effort. Technological advancements are leading to more intelligent risk assessment algorithms, enhanced data visualization tools, and greater customization options to meet diverse trial needs. The current market offers solutions capable of managing complex, multi-regional trials with a focus on ensuring data integrity and accelerating time-to-market for new therapies.
Key Drivers, Barriers & Challenges in Risk-Based Monitoring Software Industry
The Risk-Based Monitoring (RBM) Software market is propelled by several key drivers, including the escalating need for cost-effective and efficient clinical trial management, stringent regulatory requirements for data integrity and patient safety, and the growing adoption of digital technologies in healthcare. The technological imperative to reduce trial timelines and improve data quality further fuels market growth. Furthermore, increasing investments in drug development and the rise of personalized medicine necessitate sophisticated monitoring solutions.
Conversely, several barriers and challenges impede market growth. These include the high initial implementation costs of RBM software, the need for extensive training and expertise to effectively utilize these complex systems, and resistance to change from organizations accustomed to traditional monitoring methods. Data security concerns and the complexity of integrating RBM software with existing IT infrastructure also present significant hurdles. The evolving regulatory landscape, while a driver, can also pose challenges due to continuous updates and varying interpretations across different regions.
Emerging Opportunities in Risk-Based Monitoring Software Industry
Emerging opportunities in the Risk-Based Monitoring (RBM) Software industry are abundant, particularly in the integration of advanced AI and machine learning for predictive risk analytics, enabling proactive rather than reactive trial management. The expansion of RBM solutions to encompass decentralized and hybrid clinical trial models presents a significant untapped market, catering to the growing trend of remote patient monitoring. Furthermore, there is a burgeoning demand for specialized RBM software tailored for rare disease trials and complex oncology studies, where data sensitivity and patient safety are paramount. The increasing focus on real-world evidence (RWE) generation also opens avenues for RBM software to monitor the collection and integrity of RWE data.
Growth Accelerators in the Risk-Based Monitoring Software Industry Industry
Several catalysts are accelerating the growth of the Risk-Based Monitoring (RBM) Software industry. The continued digital transformation within the pharmaceutical and healthcare sectors is a primary accelerator, pushing organizations to embrace advanced technological solutions for clinical trial optimization. Strategic partnerships between RBM software providers and other clinical trial technology vendors, as well as collaborations with AI and data analytics companies, are expanding the capabilities and reach of RBM solutions. Market expansion into emerging economies, where the adoption of advanced clinical trial methodologies is gaining momentum, also represents a significant growth accelerator. The increasing focus on patient-centricity in clinical trials further drives the demand for RBM software that can enhance patient safety and improve the overall trial experience.
Key Players Shaping the Risk-Based Monitoring Software Industry Market
- Medidata Solutions Inc
- Parexel International Corporation
- IBM Corporation
- Veeva Systems
- DSG Inc
- MedNet Solutions Inc
- Signant Health
- OpenClinica LLC
- Oracle
- Anju Software
Notable Milestones in Risk-Based Monitoring Software Industry Sector
- June 2024: Medidata unveiled its offering, the Medidata Clinical Data Studio. This innovative platform is designed to empower stakeholders, granting them enhanced control over data quality and, in turn, expediting the delivery of safer trials to patients. This Medidata Clinical Data Studio supports the principles of risk-based monitoring (RBM) by enhancing data quality control and accelerating trial timelines.
- April 2024: Parexel and Palantir Technologies Inc. unveiled a multi-year strategic alliance. The collaboration aims to harness artificial intelligence (AI) to expedite and improve the safety of clinical trials, catering specifically to the global biopharmaceutical clientele. This collaboration highlights Parexel's dedication to improving the efficiency of clinical trials while upholding strict safety and regulatory standards. Further, this strategic partnership supports the advancement of AI-driven efficiencies in clinical trials, aligning with the objectives of the RBM Software to improve trial outcomes and operational effectiveness.
In-Depth Risk-Based Monitoring Software Industry Market Outlook
The future outlook for the Risk-Based Monitoring (RBM) Software industry is exceptionally positive, driven by sustained innovation and increasing global adoption. Growth accelerators such as advanced AI integration for predictive risk identification, the expansion of RBM capabilities into decentralized and hybrid trial models, and the demand for specialized solutions in niche therapeutic areas will continue to shape the market. Strategic partnerships and market expansion into underdeveloped regions offer substantial growth potential. The industry is set to evolve further, with RBM software becoming an even more integral component of efficient, compliant, and patient-centric clinical trial execution, ensuring the timely delivery of safe and effective therapies to patients worldwide.
Risk-Based Monitoring Software Industry Segmentation
-
1. Component
- 1.1. Software
- 1.2. Services
-
2. Delivery Mode
- 2.1. Web Based
- 2.2. On-premise
- 2.3. Cloud-based
-
3. End User
- 3.1. Pharma and Biopharmaceutical Companies
- 3.2. Medical Device Companies
- 3.3. Contract Research Organizations (CRO)
- 3.4. Other End Users
Risk-Based Monitoring Software Industry Segmentation By Geography
-
1. North America
- 1.1. United States
- 1.2. Canada
- 1.3. Mexico
-
2. Europe
- 2.1. Germany
- 2.2. United Kingdom
- 2.3. France
- 2.4. Italy
- 2.5. Spain
- 2.6. Rest of Europe
-
3. Asia Pacific
- 3.1. China
- 3.2. Japan
- 3.3. India
- 3.4. Australia
- 3.5. South Korea
- 3.6. Rest of Asia Pacific
- 4. Rest of the World
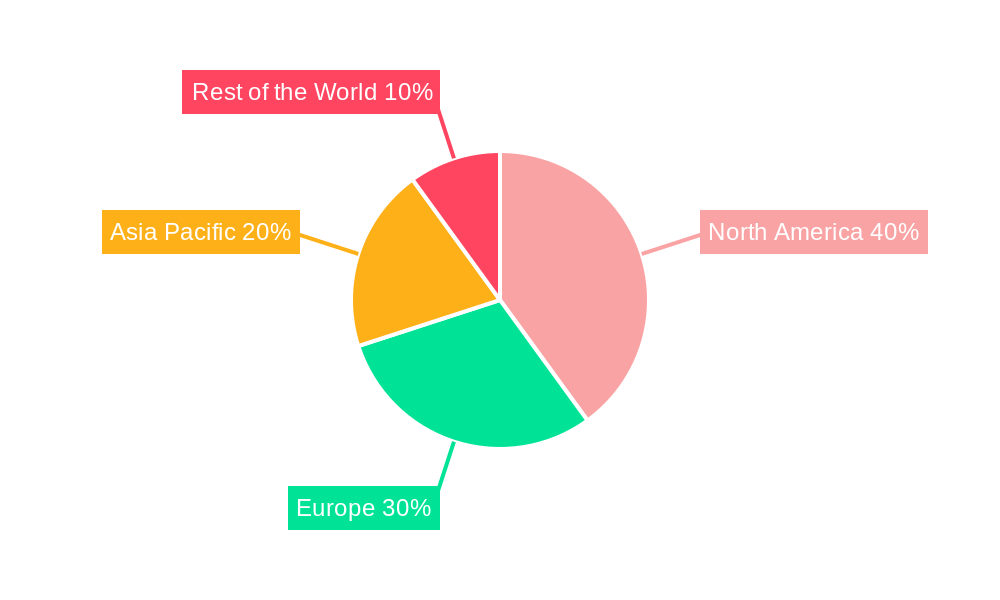
Risk-Based Monitoring Software Industry Regional Market Share
Geographic Coverage of Risk-Based Monitoring Software Industry
Risk-Based Monitoring Software Industry REPORT HIGHLIGHTS
| Aspects | Details |
|---|---|
| Study Period | 2020-2034 |
| Base Year | 2025 |
| Estimated Year | 2026 |
| Forecast Period | 2026-2034 |
| Historical Period | 2020-2025 |
| Growth Rate | CAGR of 11.30% from 2020-2034 |
| Segmentation |
|
Table of Contents
- 1. Introduction
- 1.1. Research Scope
- 1.2. Market Segmentation
- 1.3. Research Objective
- 1.4. Definitions and Assumptions
- 2. Executive Summary
- 2.1. Market Snapshot
- 3. Market Dynamics
- 3.1. Market Drivers
- 3.2. Market Restrains
- 3.3. Market Trends
- 3.4. Market Opportunities
- 4. Market Factor Analysis
- 4.1. Porters Five Forces
- 4.1.1. Bargaining Power of Suppliers
- 4.1.2. Bargaining Power of Buyers
- 4.1.3. Threat of New Entrants
- 4.1.4. Threat of Substitutes
- 4.1.5. Competitive Rivalry
- 4.2. PESTEL analysis
- 4.3. BCG Analysis
- 4.3.1. Stars (High Growth, High Market Share)
- 4.3.2. Cash Cows (Low Growth, High Market Share)
- 4.3.3. Question Mark (High Growth, Low Market Share)
- 4.3.4. Dogs (Low Growth, Low Market Share)
- 4.4. Ansoff Matrix Analysis
- 4.5. Supply Chain Analysis
- 4.6. Regulatory Landscape
- 4.7. Current Market Potential and Opportunity Assessment (TAM–SAM–SOM Framework)
- 4.8. VDR Analyst Note
- 4.1. Porters Five Forces
- 5. Market Analysis, Insights and Forecast 2021-2033
- 5.1. Market Analysis, Insights and Forecast - by Component
- 5.1.1. Software
- 5.1.2. Services
- 5.2. Market Analysis, Insights and Forecast - by Delivery Mode
- 5.2.1. Web Based
- 5.2.2. On-premise
- 5.2.3. Cloud-based
- 5.3. Market Analysis, Insights and Forecast - by End User
- 5.3.1. Pharma and Biopharmaceutical Companies
- 5.3.2. Medical Device Companies
- 5.3.3. Contract Research Organizations (CRO)
- 5.3.4. Other End Users
- 5.4. Market Analysis, Insights and Forecast - by Region
- 5.4.1. North America
- 5.4.2. Europe
- 5.4.3. Asia Pacific
- 5.4.4. Rest of the World
- 5.1. Market Analysis, Insights and Forecast - by Component
- 6. Global Risk-Based Monitoring Software Industry Analysis, Insights and Forecast, 2021-2033
- 6.1. Market Analysis, Insights and Forecast - by Component
- 6.1.1. Software
- 6.1.2. Services
- 6.2. Market Analysis, Insights and Forecast - by Delivery Mode
- 6.2.1. Web Based
- 6.2.2. On-premise
- 6.2.3. Cloud-based
- 6.3. Market Analysis, Insights and Forecast - by End User
- 6.3.1. Pharma and Biopharmaceutical Companies
- 6.3.2. Medical Device Companies
- 6.3.3. Contract Research Organizations (CRO)
- 6.3.4. Other End Users
- 6.1. Market Analysis, Insights and Forecast - by Component
- 7. North America Risk-Based Monitoring Software Industry Analysis, Insights and Forecast, 2021-2033
- 7.1. Market Analysis, Insights and Forecast - by Component
- 7.1.1. Software
- 7.1.2. Services
- 7.2. Market Analysis, Insights and Forecast - by Delivery Mode
- 7.2.1. Web Based
- 7.2.2. On-premise
- 7.2.3. Cloud-based
- 7.3. Market Analysis, Insights and Forecast - by End User
- 7.3.1. Pharma and Biopharmaceutical Companies
- 7.3.2. Medical Device Companies
- 7.3.3. Contract Research Organizations (CRO)
- 7.3.4. Other End Users
- 7.1. Market Analysis, Insights and Forecast - by Component
- 8. Europe Risk-Based Monitoring Software Industry Analysis, Insights and Forecast, 2021-2033
- 8.1. Market Analysis, Insights and Forecast - by Component
- 8.1.1. Software
- 8.1.2. Services
- 8.2. Market Analysis, Insights and Forecast - by Delivery Mode
- 8.2.1. Web Based
- 8.2.2. On-premise
- 8.2.3. Cloud-based
- 8.3. Market Analysis, Insights and Forecast - by End User
- 8.3.1. Pharma and Biopharmaceutical Companies
- 8.3.2. Medical Device Companies
- 8.3.3. Contract Research Organizations (CRO)
- 8.3.4. Other End Users
- 8.1. Market Analysis, Insights and Forecast - by Component
- 9. Asia Pacific Risk-Based Monitoring Software Industry Analysis, Insights and Forecast, 2021-2033
- 9.1. Market Analysis, Insights and Forecast - by Component
- 9.1.1. Software
- 9.1.2. Services
- 9.2. Market Analysis, Insights and Forecast - by Delivery Mode
- 9.2.1. Web Based
- 9.2.2. On-premise
- 9.2.3. Cloud-based
- 9.3. Market Analysis, Insights and Forecast - by End User
- 9.3.1. Pharma and Biopharmaceutical Companies
- 9.3.2. Medical Device Companies
- 9.3.3. Contract Research Organizations (CRO)
- 9.3.4. Other End Users
- 9.1. Market Analysis, Insights and Forecast - by Component
- 10. Rest of the World Risk-Based Monitoring Software Industry Analysis, Insights and Forecast, 2021-2033
- 10.1. Market Analysis, Insights and Forecast - by Component
- 10.1.1. Software
- 10.1.2. Services
- 10.2. Market Analysis, Insights and Forecast - by Delivery Mode
- 10.2.1. Web Based
- 10.2.2. On-premise
- 10.2.3. Cloud-based
- 10.3. Market Analysis, Insights and Forecast - by End User
- 10.3.1. Pharma and Biopharmaceutical Companies
- 10.3.2. Medical Device Companies
- 10.3.3. Contract Research Organizations (CRO)
- 10.3.4. Other End Users
- 10.1. Market Analysis, Insights and Forecast - by Component
- 11. Competitive Analysis
- 11.1. Company Profiles
- 11.1.1 Medidata Solutions Inc
- 11.1.1.1. Company Overview
- 11.1.1.2. Products
- 11.1.1.3. Company Financials
- 11.1.1.4. SWOT Analysis
- 11.1.2 Parexel International Corporation
- 11.1.2.1. Company Overview
- 11.1.2.2. Products
- 11.1.2.3. Company Financials
- 11.1.2.4. SWOT Analysis
- 11.1.3 IBM Corporation
- 11.1.3.1. Company Overview
- 11.1.3.2. Products
- 11.1.3.3. Company Financials
- 11.1.3.4. SWOT Analysis
- 11.1.4 Veeva Systems
- 11.1.4.1. Company Overview
- 11.1.4.2. Products
- 11.1.4.3. Company Financials
- 11.1.4.4. SWOT Analysis
- 11.1.5 DSG Inc
- 11.1.5.1. Company Overview
- 11.1.5.2. Products
- 11.1.5.3. Company Financials
- 11.1.5.4. SWOT Analysis
- 11.1.6 MedNet Solutions Inc
- 11.1.6.1. Company Overview
- 11.1.6.2. Products
- 11.1.6.3. Company Financials
- 11.1.6.4. SWOT Analysis
- 11.1.7 Signant Health
- 11.1.7.1. Company Overview
- 11.1.7.2. Products
- 11.1.7.3. Company Financials
- 11.1.7.4. SWOT Analysis
- 11.1.8 OpenClinica LLC
- 11.1.8.1. Company Overview
- 11.1.8.2. Products
- 11.1.8.3. Company Financials
- 11.1.8.4. SWOT Analysis
- 11.1.9 Oracle
- 11.1.9.1. Company Overview
- 11.1.9.2. Products
- 11.1.9.3. Company Financials
- 11.1.9.4. SWOT Analysis
- 11.1.10 Anju Software*List Not Exhaustive
- 11.1.10.1. Company Overview
- 11.1.10.2. Products
- 11.1.10.3. Company Financials
- 11.1.10.4. SWOT Analysis
- 11.1.1 Medidata Solutions Inc
- 11.2. Market Entropy
- 11.2.1 Company's Key Areas Served
- 11.2.2 Recent Developments
- 11.3. Company Market Share Analysis 2025
- 11.3.1 Top 5 Companies Market Share Analysis
- 11.3.2 Top 3 Companies Market Share Analysis
- 11.4. List of Potential Customers
- 12. Research Methodology
List of Figures
- Figure 1: Global Risk-Based Monitoring Software Industry Revenue Breakdown (Million, %) by Region 2025 & 2033
- Figure 2: Global Risk-Based Monitoring Software Industry Volume Breakdown (Million, %) by Region 2025 & 2033
- Figure 3: North America Risk-Based Monitoring Software Industry Revenue (Million), by Component 2025 & 2033
- Figure 4: North America Risk-Based Monitoring Software Industry Volume (Million), by Component 2025 & 2033
- Figure 5: North America Risk-Based Monitoring Software Industry Revenue Share (%), by Component 2025 & 2033
- Figure 6: North America Risk-Based Monitoring Software Industry Volume Share (%), by Component 2025 & 2033
- Figure 7: North America Risk-Based Monitoring Software Industry Revenue (Million), by Delivery Mode 2025 & 2033
- Figure 8: North America Risk-Based Monitoring Software Industry Volume (Million), by Delivery Mode 2025 & 2033
- Figure 9: North America Risk-Based Monitoring Software Industry Revenue Share (%), by Delivery Mode 2025 & 2033
- Figure 10: North America Risk-Based Monitoring Software Industry Volume Share (%), by Delivery Mode 2025 & 2033
- Figure 11: North America Risk-Based Monitoring Software Industry Revenue (Million), by End User 2025 & 2033
- Figure 12: North America Risk-Based Monitoring Software Industry Volume (Million), by End User 2025 & 2033
- Figure 13: North America Risk-Based Monitoring Software Industry Revenue Share (%), by End User 2025 & 2033
- Figure 14: North America Risk-Based Monitoring Software Industry Volume Share (%), by End User 2025 & 2033
- Figure 15: North America Risk-Based Monitoring Software Industry Revenue (Million), by Country 2025 & 2033
- Figure 16: North America Risk-Based Monitoring Software Industry Volume (Million), by Country 2025 & 2033
- Figure 17: North America Risk-Based Monitoring Software Industry Revenue Share (%), by Country 2025 & 2033
- Figure 18: North America Risk-Based Monitoring Software Industry Volume Share (%), by Country 2025 & 2033
- Figure 19: Europe Risk-Based Monitoring Software Industry Revenue (Million), by Component 2025 & 2033
- Figure 20: Europe Risk-Based Monitoring Software Industry Volume (Million), by Component 2025 & 2033
- Figure 21: Europe Risk-Based Monitoring Software Industry Revenue Share (%), by Component 2025 & 2033
- Figure 22: Europe Risk-Based Monitoring Software Industry Volume Share (%), by Component 2025 & 2033
- Figure 23: Europe Risk-Based Monitoring Software Industry Revenue (Million), by Delivery Mode 2025 & 2033
- Figure 24: Europe Risk-Based Monitoring Software Industry Volume (Million), by Delivery Mode 2025 & 2033
- Figure 25: Europe Risk-Based Monitoring Software Industry Revenue Share (%), by Delivery Mode 2025 & 2033
- Figure 26: Europe Risk-Based Monitoring Software Industry Volume Share (%), by Delivery Mode 2025 & 2033
- Figure 27: Europe Risk-Based Monitoring Software Industry Revenue (Million), by End User 2025 & 2033
- Figure 28: Europe Risk-Based Monitoring Software Industry Volume (Million), by End User 2025 & 2033
- Figure 29: Europe Risk-Based Monitoring Software Industry Revenue Share (%), by End User 2025 & 2033
- Figure 30: Europe Risk-Based Monitoring Software Industry Volume Share (%), by End User 2025 & 2033
- Figure 31: Europe Risk-Based Monitoring Software Industry Revenue (Million), by Country 2025 & 2033
- Figure 32: Europe Risk-Based Monitoring Software Industry Volume (Million), by Country 2025 & 2033
- Figure 33: Europe Risk-Based Monitoring Software Industry Revenue Share (%), by Country 2025 & 2033
- Figure 34: Europe Risk-Based Monitoring Software Industry Volume Share (%), by Country 2025 & 2033
- Figure 35: Asia Pacific Risk-Based Monitoring Software Industry Revenue (Million), by Component 2025 & 2033
- Figure 36: Asia Pacific Risk-Based Monitoring Software Industry Volume (Million), by Component 2025 & 2033
- Figure 37: Asia Pacific Risk-Based Monitoring Software Industry Revenue Share (%), by Component 2025 & 2033
- Figure 38: Asia Pacific Risk-Based Monitoring Software Industry Volume Share (%), by Component 2025 & 2033
- Figure 39: Asia Pacific Risk-Based Monitoring Software Industry Revenue (Million), by Delivery Mode 2025 & 2033
- Figure 40: Asia Pacific Risk-Based Monitoring Software Industry Volume (Million), by Delivery Mode 2025 & 2033
- Figure 41: Asia Pacific Risk-Based Monitoring Software Industry Revenue Share (%), by Delivery Mode 2025 & 2033
- Figure 42: Asia Pacific Risk-Based Monitoring Software Industry Volume Share (%), by Delivery Mode 2025 & 2033
- Figure 43: Asia Pacific Risk-Based Monitoring Software Industry Revenue (Million), by End User 2025 & 2033
- Figure 44: Asia Pacific Risk-Based Monitoring Software Industry Volume (Million), by End User 2025 & 2033
- Figure 45: Asia Pacific Risk-Based Monitoring Software Industry Revenue Share (%), by End User 2025 & 2033
- Figure 46: Asia Pacific Risk-Based Monitoring Software Industry Volume Share (%), by End User 2025 & 2033
- Figure 47: Asia Pacific Risk-Based Monitoring Software Industry Revenue (Million), by Country 2025 & 2033
- Figure 48: Asia Pacific Risk-Based Monitoring Software Industry Volume (Million), by Country 2025 & 2033
- Figure 49: Asia Pacific Risk-Based Monitoring Software Industry Revenue Share (%), by Country 2025 & 2033
- Figure 50: Asia Pacific Risk-Based Monitoring Software Industry Volume Share (%), by Country 2025 & 2033
- Figure 51: Rest of the World Risk-Based Monitoring Software Industry Revenue (Million), by Component 2025 & 2033
- Figure 52: Rest of the World Risk-Based Monitoring Software Industry Volume (Million), by Component 2025 & 2033
- Figure 53: Rest of the World Risk-Based Monitoring Software Industry Revenue Share (%), by Component 2025 & 2033
- Figure 54: Rest of the World Risk-Based Monitoring Software Industry Volume Share (%), by Component 2025 & 2033
- Figure 55: Rest of the World Risk-Based Monitoring Software Industry Revenue (Million), by Delivery Mode 2025 & 2033
- Figure 56: Rest of the World Risk-Based Monitoring Software Industry Volume (Million), by Delivery Mode 2025 & 2033
- Figure 57: Rest of the World Risk-Based Monitoring Software Industry Revenue Share (%), by Delivery Mode 2025 & 2033
- Figure 58: Rest of the World Risk-Based Monitoring Software Industry Volume Share (%), by Delivery Mode 2025 & 2033
- Figure 59: Rest of the World Risk-Based Monitoring Software Industry Revenue (Million), by End User 2025 & 2033
- Figure 60: Rest of the World Risk-Based Monitoring Software Industry Volume (Million), by End User 2025 & 2033
- Figure 61: Rest of the World Risk-Based Monitoring Software Industry Revenue Share (%), by End User 2025 & 2033
- Figure 62: Rest of the World Risk-Based Monitoring Software Industry Volume Share (%), by End User 2025 & 2033
- Figure 63: Rest of the World Risk-Based Monitoring Software Industry Revenue (Million), by Country 2025 & 2033
- Figure 64: Rest of the World Risk-Based Monitoring Software Industry Volume (Million), by Country 2025 & 2033
- Figure 65: Rest of the World Risk-Based Monitoring Software Industry Revenue Share (%), by Country 2025 & 2033
- Figure 66: Rest of the World Risk-Based Monitoring Software Industry Volume Share (%), by Country 2025 & 2033
List of Tables
- Table 1: Global Risk-Based Monitoring Software Industry Revenue Million Forecast, by Component 2020 & 2033
- Table 2: Global Risk-Based Monitoring Software Industry Volume Million Forecast, by Component 2020 & 2033
- Table 3: Global Risk-Based Monitoring Software Industry Revenue Million Forecast, by Delivery Mode 2020 & 2033
- Table 4: Global Risk-Based Monitoring Software Industry Volume Million Forecast, by Delivery Mode 2020 & 2033
- Table 5: Global Risk-Based Monitoring Software Industry Revenue Million Forecast, by End User 2020 & 2033
- Table 6: Global Risk-Based Monitoring Software Industry Volume Million Forecast, by End User 2020 & 2033
- Table 7: Global Risk-Based Monitoring Software Industry Revenue Million Forecast, by Region 2020 & 2033
- Table 8: Global Risk-Based Monitoring Software Industry Volume Million Forecast, by Region 2020 & 2033
- Table 9: Global Risk-Based Monitoring Software Industry Revenue Million Forecast, by Component 2020 & 2033
- Table 10: Global Risk-Based Monitoring Software Industry Volume Million Forecast, by Component 2020 & 2033
- Table 11: Global Risk-Based Monitoring Software Industry Revenue Million Forecast, by Delivery Mode 2020 & 2033
- Table 12: Global Risk-Based Monitoring Software Industry Volume Million Forecast, by Delivery Mode 2020 & 2033
- Table 13: Global Risk-Based Monitoring Software Industry Revenue Million Forecast, by End User 2020 & 2033
- Table 14: Global Risk-Based Monitoring Software Industry Volume Million Forecast, by End User 2020 & 2033
- Table 15: Global Risk-Based Monitoring Software Industry Revenue Million Forecast, by Country 2020 & 2033
- Table 16: Global Risk-Based Monitoring Software Industry Volume Million Forecast, by Country 2020 & 2033
- Table 17: United States Risk-Based Monitoring Software Industry Revenue (Million) Forecast, by Application 2020 & 2033
- Table 18: United States Risk-Based Monitoring Software Industry Volume (Million) Forecast, by Application 2020 & 2033
- Table 19: Canada Risk-Based Monitoring Software Industry Revenue (Million) Forecast, by Application 2020 & 2033
- Table 20: Canada Risk-Based Monitoring Software Industry Volume (Million) Forecast, by Application 2020 & 2033
- Table 21: Mexico Risk-Based Monitoring Software Industry Revenue (Million) Forecast, by Application 2020 & 2033
- Table 22: Mexico Risk-Based Monitoring Software Industry Volume (Million) Forecast, by Application 2020 & 2033
- Table 23: Global Risk-Based Monitoring Software Industry Revenue Million Forecast, by Component 2020 & 2033
- Table 24: Global Risk-Based Monitoring Software Industry Volume Million Forecast, by Component 2020 & 2033
- Table 25: Global Risk-Based Monitoring Software Industry Revenue Million Forecast, by Delivery Mode 2020 & 2033
- Table 26: Global Risk-Based Monitoring Software Industry Volume Million Forecast, by Delivery Mode 2020 & 2033
- Table 27: Global Risk-Based Monitoring Software Industry Revenue Million Forecast, by End User 2020 & 2033
- Table 28: Global Risk-Based Monitoring Software Industry Volume Million Forecast, by End User 2020 & 2033
- Table 29: Global Risk-Based Monitoring Software Industry Revenue Million Forecast, by Country 2020 & 2033
- Table 30: Global Risk-Based Monitoring Software Industry Volume Million Forecast, by Country 2020 & 2033
- Table 31: Germany Risk-Based Monitoring Software Industry Revenue (Million) Forecast, by Application 2020 & 2033
- Table 32: Germany Risk-Based Monitoring Software Industry Volume (Million) Forecast, by Application 2020 & 2033
- Table 33: United Kingdom Risk-Based Monitoring Software Industry Revenue (Million) Forecast, by Application 2020 & 2033
- Table 34: United Kingdom Risk-Based Monitoring Software Industry Volume (Million) Forecast, by Application 2020 & 2033
- Table 35: France Risk-Based Monitoring Software Industry Revenue (Million) Forecast, by Application 2020 & 2033
- Table 36: France Risk-Based Monitoring Software Industry Volume (Million) Forecast, by Application 2020 & 2033
- Table 37: Italy Risk-Based Monitoring Software Industry Revenue (Million) Forecast, by Application 2020 & 2033
- Table 38: Italy Risk-Based Monitoring Software Industry Volume (Million) Forecast, by Application 2020 & 2033
- Table 39: Spain Risk-Based Monitoring Software Industry Revenue (Million) Forecast, by Application 2020 & 2033
- Table 40: Spain Risk-Based Monitoring Software Industry Volume (Million) Forecast, by Application 2020 & 2033
- Table 41: Rest of Europe Risk-Based Monitoring Software Industry Revenue (Million) Forecast, by Application 2020 & 2033
- Table 42: Rest of Europe Risk-Based Monitoring Software Industry Volume (Million) Forecast, by Application 2020 & 2033
- Table 43: Global Risk-Based Monitoring Software Industry Revenue Million Forecast, by Component 2020 & 2033
- Table 44: Global Risk-Based Monitoring Software Industry Volume Million Forecast, by Component 2020 & 2033
- Table 45: Global Risk-Based Monitoring Software Industry Revenue Million Forecast, by Delivery Mode 2020 & 2033
- Table 46: Global Risk-Based Monitoring Software Industry Volume Million Forecast, by Delivery Mode 2020 & 2033
- Table 47: Global Risk-Based Monitoring Software Industry Revenue Million Forecast, by End User 2020 & 2033
- Table 48: Global Risk-Based Monitoring Software Industry Volume Million Forecast, by End User 2020 & 2033
- Table 49: Global Risk-Based Monitoring Software Industry Revenue Million Forecast, by Country 2020 & 2033
- Table 50: Global Risk-Based Monitoring Software Industry Volume Million Forecast, by Country 2020 & 2033
- Table 51: China Risk-Based Monitoring Software Industry Revenue (Million) Forecast, by Application 2020 & 2033
- Table 52: China Risk-Based Monitoring Software Industry Volume (Million) Forecast, by Application 2020 & 2033
- Table 53: Japan Risk-Based Monitoring Software Industry Revenue (Million) Forecast, by Application 2020 & 2033
- Table 54: Japan Risk-Based Monitoring Software Industry Volume (Million) Forecast, by Application 2020 & 2033
- Table 55: India Risk-Based Monitoring Software Industry Revenue (Million) Forecast, by Application 2020 & 2033
- Table 56: India Risk-Based Monitoring Software Industry Volume (Million) Forecast, by Application 2020 & 2033
- Table 57: Australia Risk-Based Monitoring Software Industry Revenue (Million) Forecast, by Application 2020 & 2033
- Table 58: Australia Risk-Based Monitoring Software Industry Volume (Million) Forecast, by Application 2020 & 2033
- Table 59: South Korea Risk-Based Monitoring Software Industry Revenue (Million) Forecast, by Application 2020 & 2033
- Table 60: South Korea Risk-Based Monitoring Software Industry Volume (Million) Forecast, by Application 2020 & 2033
- Table 61: Rest of Asia Pacific Risk-Based Monitoring Software Industry Revenue (Million) Forecast, by Application 2020 & 2033
- Table 62: Rest of Asia Pacific Risk-Based Monitoring Software Industry Volume (Million) Forecast, by Application 2020 & 2033
- Table 63: Global Risk-Based Monitoring Software Industry Revenue Million Forecast, by Component 2020 & 2033
- Table 64: Global Risk-Based Monitoring Software Industry Volume Million Forecast, by Component 2020 & 2033
- Table 65: Global Risk-Based Monitoring Software Industry Revenue Million Forecast, by Delivery Mode 2020 & 2033
- Table 66: Global Risk-Based Monitoring Software Industry Volume Million Forecast, by Delivery Mode 2020 & 2033
- Table 67: Global Risk-Based Monitoring Software Industry Revenue Million Forecast, by End User 2020 & 2033
- Table 68: Global Risk-Based Monitoring Software Industry Volume Million Forecast, by End User 2020 & 2033
- Table 69: Global Risk-Based Monitoring Software Industry Revenue Million Forecast, by Country 2020 & 2033
- Table 70: Global Risk-Based Monitoring Software Industry Volume Million Forecast, by Country 2020 & 2033
Frequently Asked Questions
1. What is the projected Compound Annual Growth Rate (CAGR) of the Risk-Based Monitoring Software Industry?
The projected CAGR is approximately 11.30%.
2. Which companies are prominent players in the Risk-Based Monitoring Software Industry?
Key companies in the market include Medidata Solutions Inc, Parexel International Corporation, IBM Corporation, Veeva Systems, DSG Inc, MedNet Solutions Inc, Signant Health, OpenClinica LLC, Oracle, Anju Software*List Not Exhaustive.
3. What are the main segments of the Risk-Based Monitoring Software Industry?
The market segments include Component, Delivery Mode, End User.
4. Can you provide details about the market size?
The market size is estimated to be USD 342 Million as of 2022.
5. What are some drivers contributing to market growth?
High Efficiency of Risk-Based Monitoring Software Coupled with Growing Government Funding and Support for Clinical Trials; Advancements in Technology.
6. What are the notable trends driving market growth?
The Service Segment is Expected to Hold a Significant Share in the Market During the Forecast Period.
7. Are there any restraints impacting market growth?
High Efficiency of Risk-Based Monitoring Software Coupled with Growing Government Funding and Support for Clinical Trials; Advancements in Technology.
8. Can you provide examples of recent developments in the market?
June 2024: Medidata unveiled its offering, the Medidata Clinical Data Studio. This innovative platform is designed to empower stakeholders, granting them enhanced control over data quality and, in turn, expediting the delivery of safer trials to patients. This Medidata Clinical Data Studio supports the principles of risk-based monitoring (RBM) by enhancing data quality control and accelerating trial timelines.
9. What pricing options are available for accessing the report?
Pricing options include single-user, multi-user, and enterprise licenses priced at USD 4750, USD 5250, and USD 8750 respectively.
10. Is the market size provided in terms of value or volume?
The market size is provided in terms of value, measured in Million and volume, measured in Million.
11. Are there any specific market keywords associated with the report?
Yes, the market keyword associated with the report is "Risk-Based Monitoring Software Industry," which aids in identifying and referencing the specific market segment covered.
12. How do I determine which pricing option suits my needs best?
The pricing options vary based on user requirements and access needs. Individual users may opt for single-user licenses, while businesses requiring broader access may choose multi-user or enterprise licenses for cost-effective access to the report.
13. Are there any additional resources or data provided in the Risk-Based Monitoring Software Industry report?
While the report offers comprehensive insights, it's advisable to review the specific contents or supplementary materials provided to ascertain if additional resources or data are available.
14. How can I stay updated on further developments or reports in the Risk-Based Monitoring Software Industry?
To stay informed about further developments, trends, and reports in the Risk-Based Monitoring Software Industry, consider subscribing to industry newsletters, following relevant companies and organizations, or regularly checking reputable industry news sources and publications.
Methodology
Step 1 - Identification of Relevant Samples Size from Population Database


Step 2 - Approaches for Defining Global Market Size (Value, Volume* & Price*)

Note*: In applicable scenarios
Step 3 - Data Sources
Primary Research
- Web Analytics
- Survey Reports
- Research Institute
- Latest Research Reports
- Opinion Leaders
Secondary Research
- Annual Reports
- White Paper
- Latest Press Release
- Industry Association
- Paid Database
- Investor Presentations

Step 4 - Data Triangulation
Involves using different sources of information in order to increase the validity of a study
These sources are likely to be stakeholders in a program - participants, other researchers, program staff, other community members, and so on.
Then we put all data in single framework & apply various statistical tools to find out the dynamic on the market.
During the analysis stage, feedback from the stakeholder groups would be compared to determine areas of agreement as well as areas of divergence