

Key Insights
The global Glycomics Market is projected for substantial growth, expected to reach approximately $2.12 billion by 2025, driven by a compelling Compound Annual Growth Rate (CAGR) of 13.85%. This expansion, anticipated from 2023 to 2033, is fueled by increasing demand for advanced diagnostics, especially in oncology and infectious disease monitoring, and the significant role of glycans in drug discovery and development. The market encompasses Instruments, Reagents & Kits, and Enzymes, serving vital applications in Drug Development, Diagnostics, and Other Sectors. Key industry innovators, including Thermo Fisher Scientific, Merck KGaA, and Agilent Technologies, are spearheading this market momentum.
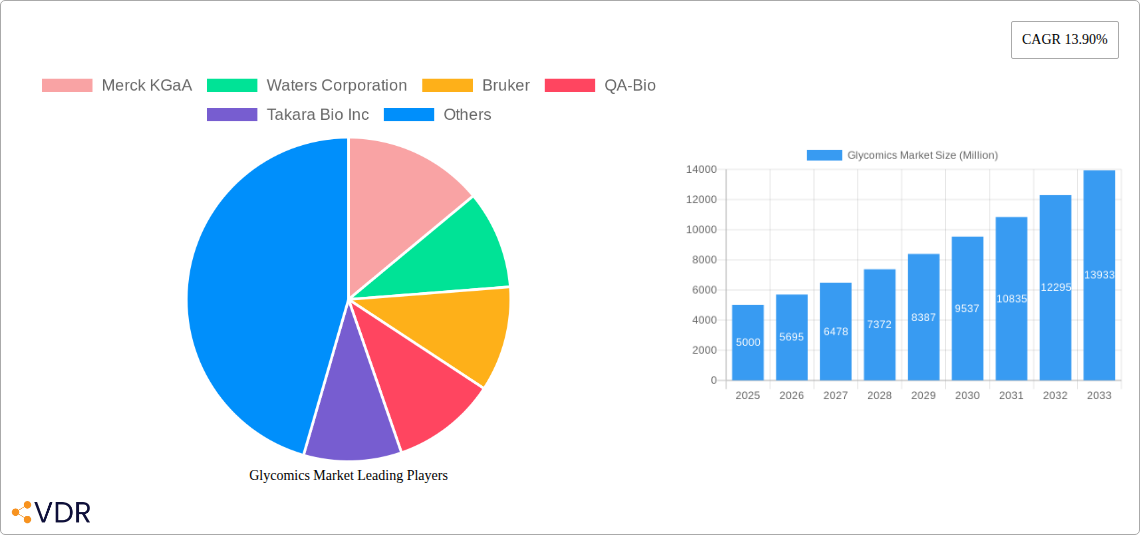
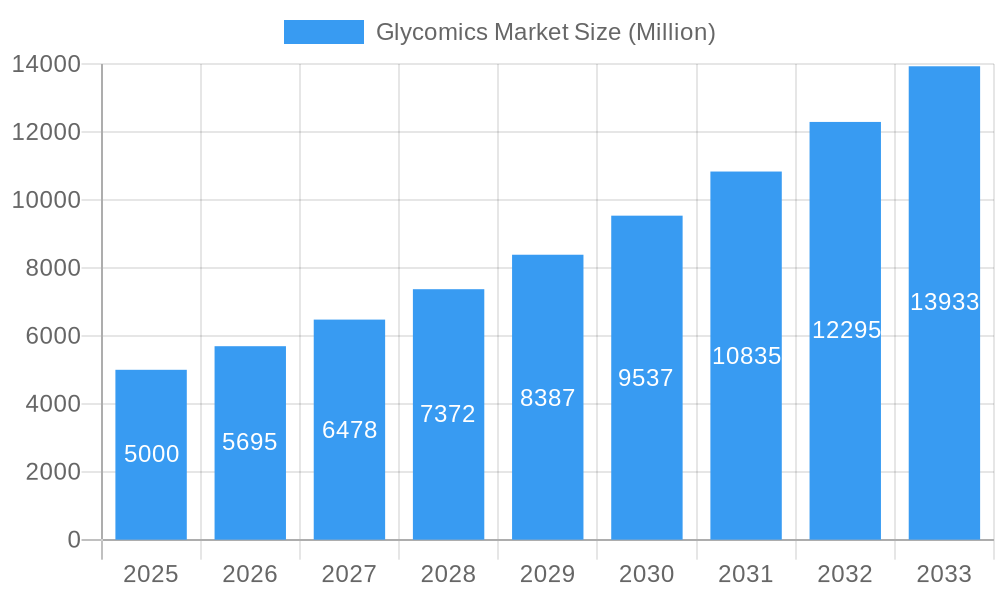
Glycomics Market Market Size (In Billion)
Emerging trends, such as the widespread adoption of high-throughput glycomics analysis and the drive towards personalized medicine through glycan profiling, further bolster the Glycomics Market. Innovations in mass spectrometry and analytical instrumentation are enhancing the detailed characterization of complex glycan structures, thereby broadening research and application scope. While potential restraints like the cost of advanced equipment and the requirement for specialized expertise exist, the profound opportunities in identifying novel therapeutic targets and improving diagnostic precision are set to sustain robust market performance across major regions including North America, Europe, and Asia Pacific, with the United States and China leading in market adoption.
Glycomics Market Company Market Share
This report delivers a comprehensive analysis of the global Glycomics Market, providing essential insights into its current state, historical performance, and future growth prospects. Covering the period from 2023 to 2033, with a base year of 2023 and an estimated year of 2025, this analysis is a critical resource for stakeholders navigating the evolving landscape of glycoscience research and its expanding applications. We delve into key market segments, leading geographical regions, innovative product offerings, and the strategic initiatives of prominent industry players.
Glycomics Market Market Dynamics & Structure
The Glycomics market is characterized by a moderately concentrated structure, driven by significant technological innovation and a growing understanding of the role of glycans in biological processes. Key drivers include advancements in mass spectrometry, glycan sequencing technologies, and the development of novel analytical tools, fostering innovation in areas such as drug discovery and diagnostics. Regulatory frameworks, while still evolving, are becoming increasingly supportive of glycomics-based research, particularly in the pharmaceutical and biotechnology sectors. The competitive landscape features established players like Merck KGaA, Thermo Fisher Scientific Inc., and Agilent Technologies Inc., alongside specialized companies such as QA-Bio and Takara Bio Inc., offering a diverse range of instruments, reagents, and services. End-user demographics are primarily composed of academic research institutions, pharmaceutical and biotechnology companies, and contract research organizations (CROs). Mergers and acquisitions (M&A) are a notable trend, with companies strategically acquiring complementary technologies or expanding their market reach. For instance, the historical period has seen several key acquisitions aimed at consolidating market share and broadening product portfolios. The market concentration is influenced by the high cost of specialized glycomics instrumentation and the need for skilled personnel. Barriers to innovation include the inherent complexity of glycan structures and the challenges associated with their comprehensive analysis and functional characterization.
- Market Concentration: Moderately concentrated with a mix of large, diversified companies and niche specialists.
- Technological Innovation: Driven by advancements in mass spectrometry, chromatography, and bioinformatics.
- Regulatory Frameworks: Evolving but increasingly supportive of glycomics applications in healthcare and biopharmaceuticals.
- Competitive Product Substitutes: Limited direct substitutes for comprehensive glycomics analysis, but advancements in other omics fields present indirect competition.
- End-User Demographics: Predominantly academic research, pharmaceutical R&D, biotechnology, and clinical diagnostics.
- M&A Trends: Active M&A landscape, focusing on technology acquisition and market expansion. Estimated M&A deal volume in the historical period was XX million units.
Glycomics Market Growth Trends & Insights
The Glycomics market is projected to witness substantial growth, fueled by an escalating demand for advanced diagnostic tools, the burgeoning field of personalized medicine, and the critical role of glycosylation in disease pathogenesis. The market size is expected to evolve from approximately $1,500 million in the base year 2025 to a projected $3,500 million by the end of the forecast period in 2033, representing a compound annual growth rate (CAGR) of XX%. Adoption rates for glycomics technologies are steadily increasing across pharmaceutical companies for drug development and characterization, as well as in academic research for fundamental biological discoveries. Technological disruptions, such as the development of higher-resolution mass spectrometers and advanced glycan library databases, are significantly enhancing analytical capabilities and accelerating research timelines. Consumer behavior shifts are also playing a crucial role, with an increasing emphasis on understanding the complex interplay of glycans in health and disease, driving demand for glycomics-based diagnostics and therapeutics.
The historical period (2019-2024) laid the groundwork for this accelerated growth, with consistent investments in research and development and a growing body of scientific literature highlighting the significance of glycomics. Market penetration, though still nascent in some diagnostic applications, is rapidly expanding, driven by improved cost-effectiveness and accessibility of glycomics platforms. The transition from basic research to applied clinical settings is a key trend, particularly in oncology, immunology, and infectious diseases, where aberrant glycosylation patterns are often indicative of disease states. The development of glycan-binding proteins (lectins) and their application in glycan profiling is further diversifying the market. The increasing prevalence of chronic diseases and the need for early and accurate diagnosis are major market stimulants. Furthermore, the biopharmaceutical industry's reliance on precise characterization of glycoproteins for drug efficacy and safety is a continuous driver of demand for advanced glycomics solutions. The integration of artificial intelligence and machine learning with glycomics data analysis is another significant technological advancement poised to unlock deeper insights and accelerate the discovery process.
Dominant Regions, Countries, or Segments in Glycomics Market
The Drug Development application segment is identified as the dominant force driving growth within the global Glycomics market. In 2025, this segment is estimated to capture a market share of approximately XX% of the total market value. The pharmaceutical and biotechnology industries are heavily investing in glycomics for a multitude of purposes, including the development of novel therapeutics, the characterization of biologics, and the identification of biomarkers for drug efficacy and toxicity. The complexity of glycosylation in biopharmaceuticals, such as monoclonal antibodies, necessitates sophisticated glycomics analysis to ensure product consistency and therapeutic effectiveness.
North America, particularly the United States, stands out as the leading dominant region, accounting for an estimated XX% of the global Glycomics market in 2025. This regional dominance is attributed to several key factors:
- Robust R&D Infrastructure: The presence of leading academic institutions, world-class research hospitals, and a well-established biotechnology and pharmaceutical industry fosters significant investment in glycomics research and development.
- High R&D Spending: Significant government funding and private sector investment in life sciences research, including proteomics and glycobiology, provide a fertile ground for the adoption and advancement of glycomics technologies.
- Leading Pharmaceutical and Biotechnology Companies: The concentration of major pharmaceutical players in North America, with their extensive drug development pipelines, creates a substantial demand for glycomics solutions for target identification, drug characterization, and biomarker discovery.
- Advanced Healthcare System: A sophisticated healthcare system with a focus on personalized medicine and early disease detection encourages the development and implementation of glycomics-based diagnostics.
- Technological Adoption: North America demonstrates a high propensity for adopting cutting-edge technologies, including advanced mass spectrometry platforms, high-throughput screening systems, and sophisticated data analysis software crucial for glycomics research.
Within the Product Type segment, Instruments are expected to maintain their leading position, driven by the continuous innovation in mass spectrometry, chromatography, and imaging technologies that are foundational to glycomics research. The increasing sophistication and miniaturization of these instruments, coupled with growing demand for high-throughput analysis, will continue to fuel their market dominance.
Glycomics Market Product Landscape
The glycomics product landscape is characterized by continuous innovation, focusing on enhancing analytical precision, throughput, and accessibility. Key product advancements include the development of novel mass spectrometry platforms with higher resolution and sensitivity, enabling the detailed characterization of complex glycan structures. Reagents and kits are evolving to support specific glycan analysis workflows, such as targeted glycan enrichment and enzymatic release. Enzymes tailored for specific glycosidic bond cleavages are crucial for deciphering glycan architectures. Unique selling propositions often lie in the ability of these products to provide comprehensive glycomic profiles, offering deep insights into biological processes and disease mechanisms. Technological advancements are also focused on integrating these instruments and consumables with user-friendly software for data interpretation and visualization, democratizing access to sophisticated glycomics analysis.
Key Drivers, Barriers & Challenges in Glycomics Market
Key Drivers:
- Advancements in Analytical Technologies: Innovations in mass spectrometry, chromatography, and glycan labeling techniques are expanding the scope and accuracy of glycomics analysis.
- Growing Understanding of Glycans in Disease: Increased scientific recognition of the critical role of glycans in various diseases, including cancer, infectious diseases, and autoimmune disorders, is driving demand for glycomics solutions in diagnostics and therapeutics.
- Demand for Biologics Characterization: The burgeoning biopharmaceutical industry's need for precise characterization of glycoproteins for drug development and quality control is a significant market accelerator.
- Personalized Medicine Initiatives: The drive towards personalized medicine, which often relies on understanding individual biological variations, is fueling interest in glycan profiling as a diagnostic and prognostic tool.
Key Barriers & Challenges:
- Complexity of Glycan Structures: The inherent structural diversity and complexity of glycans pose significant challenges for comprehensive and standardized analysis.
- High Cost of Instrumentation: Advanced glycomics instrumentation can be expensive, limiting accessibility for some research institutions and smaller companies.
- Need for Specialized Expertise: Interpreting complex glycomics data requires specialized bioinformatics skills and expertise, leading to a talent gap.
- Standardization Issues: The lack of universally standardized protocols and databases for glycan analysis can hinder comparability and reproducibility of results.
- Reimbursement Policies: Limited reimbursement for glycomics-based diagnostics in clinical settings can slow down market adoption.
Emerging Opportunities in Glycomics Market
Emerging opportunities in the Glycomics market lie in the development of rapid, point-of-care diagnostic tools for various diseases, leveraging glycan biomarkers. The expansion of glycomics applications into food science for quality control and allergen detection, and into agriculture for crop improvement, presents untapped markets. The increasing demand for individualized therapeutic approaches in oncology, based on a patient's specific glycan profile, offers a significant growth avenue. Furthermore, the development of glycan-based vaccines and therapeutic glycoproteins with enhanced efficacy and reduced immunogenicity are promising areas for innovation.
Growth Accelerators in the Glycomics Market Industry
The Glycomics market industry is propelled by continuous technological breakthroughs in analytical instrumentation, particularly in mass spectrometry and NMR spectroscopy, enabling deeper and more comprehensive glycan analysis. Strategic partnerships between instrument manufacturers, reagent providers, and research institutions are accelerating the development and validation of novel glycomics workflows. Market expansion strategies, including the increasing adoption of glycomics in emerging economies and the development of more cost-effective solutions, are also key growth accelerators. The growing emphasis on glycomics in drug discovery and development pipelines, especially for biologics, will continue to drive sustained investment and innovation.
Key Players Shaping the Glycomics Market Market
- Merck KGaA
- Waters Corporation
- Bruker
- QA-Bio
- Takara Bio Inc
- Agilent Technologies Inc
- New England Biolabs Inc
- Shimadzu Corporation
- Danaher (SCIEX)
- ThermoFisher Scientific Inc
Notable Milestones in Glycomics Market Sector
- 2019: Introduction of new high-resolution mass spectrometers enhancing glycan identification capabilities.
- 2020: Significant advancements in automated glycan sample preparation kits, improving throughput.
- 2021: Expansion of glycomics databases and AI-driven glycan analysis software.
- 2022: Launch of novel glycan-binding proteins for targeted glycan profiling.
- 2023: Increased investment in glycomics for cancer biomarker discovery and development of glycan-based cancer vaccines.
- 2024: Emergence of portable glycomics analysis devices for field applications.
In-Depth Glycomics Market Market Outlook
The Glycomics market is poised for robust future growth, driven by its expanding role in precision medicine, diagnostics, and the development of novel biotherapeutics. The increasing understanding of glycan biology in disease pathogenesis will continue to fuel demand for advanced analytical tools and expertise. Strategic collaborations between industry leaders and academic research centers, coupled with ongoing investments in R&D, will foster further innovation and market penetration. Emerging applications in areas like food safety and agricultural science present significant untapped potential. The market outlook is exceptionally positive, with substantial opportunities for companies that can offer comprehensive, integrated glycomics solutions and contribute to the standardization and clinical translation of glycomics technologies.
Glycomics Market Segmentation
-
1. Product Type
- 1.1. Instruments
- 1.2. Reagents and Kits
- 1.3. Enzymes
-
2. Application
- 2.1. Drug Development
- 2.2. Diagnostics
- 2.3. Other Applications
Glycomics Market Segmentation By Geography
-
1. North America
- 1.1. United States
- 1.2. Canada
- 1.3. Mexico
-
2. Europe
- 2.1. Germany
- 2.2. United Kingdom
- 2.3. France
- 2.4. Italy
- 2.5. Spain
- 2.6. Rest of Europe
-
3. Asia Pacific
- 3.1. China
- 3.2. Japan
- 3.3. India
- 3.4. Australia
- 3.5. South Korea
- 3.6. Rest of Asia Pacific
- 4. Rest of the World
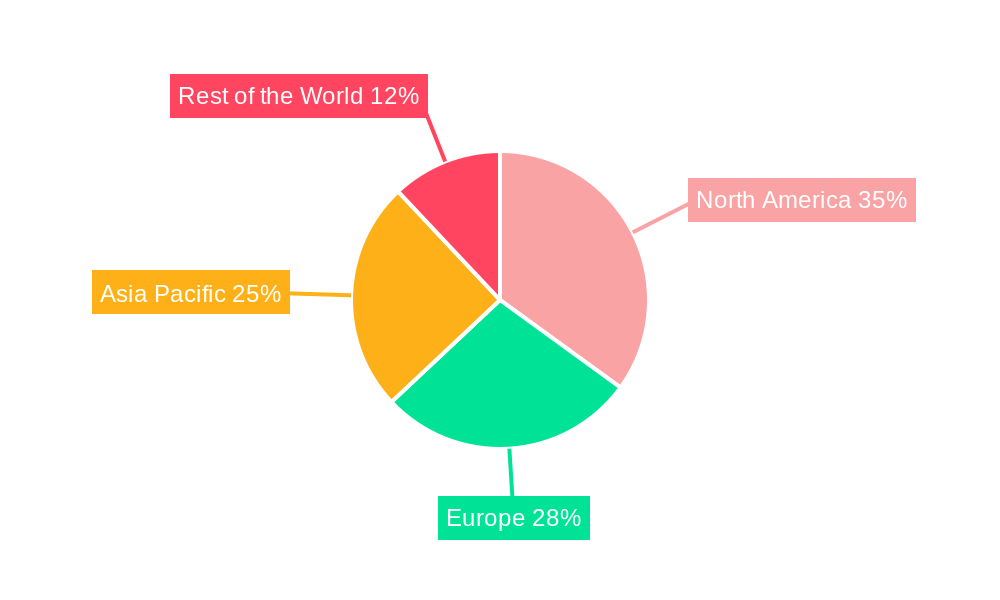
Glycomics Market Regional Market Share
Geographic Coverage of Glycomics Market
Glycomics Market REPORT HIGHLIGHTS
| Aspects | Details |
|---|---|
| Study Period | 2020-2034 |
| Base Year | 2025 |
| Estimated Year | 2026 |
| Forecast Period | 2026-2034 |
| Historical Period | 2020-2025 |
| Growth Rate | CAGR of 13.85% from 2020-2034 |
| Segmentation |
|
Table of Contents
- 1. Introduction
- 1.1. Research Scope
- 1.2. Market Segmentation
- 1.3. Research Objective
- 1.4. Definitions and Assumptions
- 2. Executive Summary
- 2.1. Market Snapshot
- 3. Market Dynamics
- 3.1. Market Drivers
- 3.2. Market Restrains
- 3.3. Market Trends
- 3.4. Market Opportunities
- 4. Market Factor Analysis
- 4.1. Porters Five Forces
- 4.1.1. Bargaining Power of Suppliers
- 4.1.2. Bargaining Power of Buyers
- 4.1.3. Threat of New Entrants
- 4.1.4. Threat of Substitutes
- 4.1.5. Competitive Rivalry
- 4.2. PESTEL analysis
- 4.3. BCG Analysis
- 4.3.1. Stars (High Growth, High Market Share)
- 4.3.2. Cash Cows (Low Growth, High Market Share)
- 4.3.3. Question Mark (High Growth, Low Market Share)
- 4.3.4. Dogs (Low Growth, Low Market Share)
- 4.4. Ansoff Matrix Analysis
- 4.5. Supply Chain Analysis
- 4.6. Regulatory Landscape
- 4.7. Current Market Potential and Opportunity Assessment (TAM–SAM–SOM Framework)
- 4.8. VDR Analyst Note
- 4.1. Porters Five Forces
- 5. Market Analysis, Insights and Forecast 2021-2033
- 5.1. Market Analysis, Insights and Forecast - by Product Type
- 5.1.1. Instruments
- 5.1.2. Reagents and Kits
- 5.1.3. Enzymes
- 5.2. Market Analysis, Insights and Forecast - by Application
- 5.2.1. Drug Development
- 5.2.2. Diagnostics
- 5.2.3. Other Applications
- 5.3. Market Analysis, Insights and Forecast - by Region
- 5.3.1. North America
- 5.3.2. Europe
- 5.3.3. Asia Pacific
- 5.3.4. Rest of the World
- 5.1. Market Analysis, Insights and Forecast - by Product Type
- 6. Global Glycomics Market Analysis, Insights and Forecast, 2021-2033
- 6.1. Market Analysis, Insights and Forecast - by Product Type
- 6.1.1. Instruments
- 6.1.2. Reagents and Kits
- 6.1.3. Enzymes
- 6.2. Market Analysis, Insights and Forecast - by Application
- 6.2.1. Drug Development
- 6.2.2. Diagnostics
- 6.2.3. Other Applications
- 6.1. Market Analysis, Insights and Forecast - by Product Type
- 7. North America Glycomics Market Analysis, Insights and Forecast, 2021-2033
- 7.1. Market Analysis, Insights and Forecast - by Product Type
- 7.1.1. Instruments
- 7.1.2. Reagents and Kits
- 7.1.3. Enzymes
- 7.2. Market Analysis, Insights and Forecast - by Application
- 7.2.1. Drug Development
- 7.2.2. Diagnostics
- 7.2.3. Other Applications
- 7.1. Market Analysis, Insights and Forecast - by Product Type
- 8. Europe Glycomics Market Analysis, Insights and Forecast, 2021-2033
- 8.1. Market Analysis, Insights and Forecast - by Product Type
- 8.1.1. Instruments
- 8.1.2. Reagents and Kits
- 8.1.3. Enzymes
- 8.2. Market Analysis, Insights and Forecast - by Application
- 8.2.1. Drug Development
- 8.2.2. Diagnostics
- 8.2.3. Other Applications
- 8.1. Market Analysis, Insights and Forecast - by Product Type
- 9. Asia Pacific Glycomics Market Analysis, Insights and Forecast, 2021-2033
- 9.1. Market Analysis, Insights and Forecast - by Product Type
- 9.1.1. Instruments
- 9.1.2. Reagents and Kits
- 9.1.3. Enzymes
- 9.2. Market Analysis, Insights and Forecast - by Application
- 9.2.1. Drug Development
- 9.2.2. Diagnostics
- 9.2.3. Other Applications
- 9.1. Market Analysis, Insights and Forecast - by Product Type
- 10. Rest of the World Glycomics Market Analysis, Insights and Forecast, 2021-2033
- 10.1. Market Analysis, Insights and Forecast - by Product Type
- 10.1.1. Instruments
- 10.1.2. Reagents and Kits
- 10.1.3. Enzymes
- 10.2. Market Analysis, Insights and Forecast - by Application
- 10.2.1. Drug Development
- 10.2.2. Diagnostics
- 10.2.3. Other Applications
- 10.1. Market Analysis, Insights and Forecast - by Product Type
- 11. Competitive Analysis
- 11.1. Company Profiles
- 11.1.1 Merck KGaA
- 11.1.1.1. Company Overview
- 11.1.1.2. Products
- 11.1.1.3. Company Financials
- 11.1.1.4. SWOT Analysis
- 11.1.2 Waters Corporation
- 11.1.2.1. Company Overview
- 11.1.2.2. Products
- 11.1.2.3. Company Financials
- 11.1.2.4. SWOT Analysis
- 11.1.3 Bruker
- 11.1.3.1. Company Overview
- 11.1.3.2. Products
- 11.1.3.3. Company Financials
- 11.1.3.4. SWOT Analysis
- 11.1.4 QA-Bio
- 11.1.4.1. Company Overview
- 11.1.4.2. Products
- 11.1.4.3. Company Financials
- 11.1.4.4. SWOT Analysis
- 11.1.5 Takara Bio Inc
- 11.1.5.1. Company Overview
- 11.1.5.2. Products
- 11.1.5.3. Company Financials
- 11.1.5.4. SWOT Analysis
- 11.1.6 Agilent Technologies Inc
- 11.1.6.1. Company Overview
- 11.1.6.2. Products
- 11.1.6.3. Company Financials
- 11.1.6.4. SWOT Analysis
- 11.1.7 New England Biolabs Inc
- 11.1.7.1. Company Overview
- 11.1.7.2. Products
- 11.1.7.3. Company Financials
- 11.1.7.4. SWOT Analysis
- 11.1.8 Shimadzu Corporation
- 11.1.8.1. Company Overview
- 11.1.8.2. Products
- 11.1.8.3. Company Financials
- 11.1.8.4. SWOT Analysis
- 11.1.9 Danaher (SCIEX)
- 11.1.9.1. Company Overview
- 11.1.9.2. Products
- 11.1.9.3. Company Financials
- 11.1.9.4. SWOT Analysis
- 11.1.10 ThermoFisher Scientific Inc
- 11.1.10.1. Company Overview
- 11.1.10.2. Products
- 11.1.10.3. Company Financials
- 11.1.10.4. SWOT Analysis
- 11.1.1 Merck KGaA
- 11.2. Market Entropy
- 11.2.1 Company's Key Areas Served
- 11.2.2 Recent Developments
- 11.3. Company Market Share Analysis 2025
- 11.3.1 Top 5 Companies Market Share Analysis
- 11.3.2 Top 3 Companies Market Share Analysis
- 11.4. List of Potential Customers
- 12. Research Methodology
List of Figures
- Figure 1: Global Glycomics Market Revenue Breakdown (billion, %) by Region 2025 & 2033
- Figure 2: Global Glycomics Market Volume Breakdown (K Unit, %) by Region 2025 & 2033
- Figure 3: North America Glycomics Market Revenue (billion), by Product Type 2025 & 2033
- Figure 4: North America Glycomics Market Volume (K Unit), by Product Type 2025 & 2033
- Figure 5: North America Glycomics Market Revenue Share (%), by Product Type 2025 & 2033
- Figure 6: North America Glycomics Market Volume Share (%), by Product Type 2025 & 2033
- Figure 7: North America Glycomics Market Revenue (billion), by Application 2025 & 2033
- Figure 8: North America Glycomics Market Volume (K Unit), by Application 2025 & 2033
- Figure 9: North America Glycomics Market Revenue Share (%), by Application 2025 & 2033
- Figure 10: North America Glycomics Market Volume Share (%), by Application 2025 & 2033
- Figure 11: North America Glycomics Market Revenue (billion), by Country 2025 & 2033
- Figure 12: North America Glycomics Market Volume (K Unit), by Country 2025 & 2033
- Figure 13: North America Glycomics Market Revenue Share (%), by Country 2025 & 2033
- Figure 14: North America Glycomics Market Volume Share (%), by Country 2025 & 2033
- Figure 15: Europe Glycomics Market Revenue (billion), by Product Type 2025 & 2033
- Figure 16: Europe Glycomics Market Volume (K Unit), by Product Type 2025 & 2033
- Figure 17: Europe Glycomics Market Revenue Share (%), by Product Type 2025 & 2033
- Figure 18: Europe Glycomics Market Volume Share (%), by Product Type 2025 & 2033
- Figure 19: Europe Glycomics Market Revenue (billion), by Application 2025 & 2033
- Figure 20: Europe Glycomics Market Volume (K Unit), by Application 2025 & 2033
- Figure 21: Europe Glycomics Market Revenue Share (%), by Application 2025 & 2033
- Figure 22: Europe Glycomics Market Volume Share (%), by Application 2025 & 2033
- Figure 23: Europe Glycomics Market Revenue (billion), by Country 2025 & 2033
- Figure 24: Europe Glycomics Market Volume (K Unit), by Country 2025 & 2033
- Figure 25: Europe Glycomics Market Revenue Share (%), by Country 2025 & 2033
- Figure 26: Europe Glycomics Market Volume Share (%), by Country 2025 & 2033
- Figure 27: Asia Pacific Glycomics Market Revenue (billion), by Product Type 2025 & 2033
- Figure 28: Asia Pacific Glycomics Market Volume (K Unit), by Product Type 2025 & 2033
- Figure 29: Asia Pacific Glycomics Market Revenue Share (%), by Product Type 2025 & 2033
- Figure 30: Asia Pacific Glycomics Market Volume Share (%), by Product Type 2025 & 2033
- Figure 31: Asia Pacific Glycomics Market Revenue (billion), by Application 2025 & 2033
- Figure 32: Asia Pacific Glycomics Market Volume (K Unit), by Application 2025 & 2033
- Figure 33: Asia Pacific Glycomics Market Revenue Share (%), by Application 2025 & 2033
- Figure 34: Asia Pacific Glycomics Market Volume Share (%), by Application 2025 & 2033
- Figure 35: Asia Pacific Glycomics Market Revenue (billion), by Country 2025 & 2033
- Figure 36: Asia Pacific Glycomics Market Volume (K Unit), by Country 2025 & 2033
- Figure 37: Asia Pacific Glycomics Market Revenue Share (%), by Country 2025 & 2033
- Figure 38: Asia Pacific Glycomics Market Volume Share (%), by Country 2025 & 2033
- Figure 39: Rest of the World Glycomics Market Revenue (billion), by Product Type 2025 & 2033
- Figure 40: Rest of the World Glycomics Market Volume (K Unit), by Product Type 2025 & 2033
- Figure 41: Rest of the World Glycomics Market Revenue Share (%), by Product Type 2025 & 2033
- Figure 42: Rest of the World Glycomics Market Volume Share (%), by Product Type 2025 & 2033
- Figure 43: Rest of the World Glycomics Market Revenue (billion), by Application 2025 & 2033
- Figure 44: Rest of the World Glycomics Market Volume (K Unit), by Application 2025 & 2033
- Figure 45: Rest of the World Glycomics Market Revenue Share (%), by Application 2025 & 2033
- Figure 46: Rest of the World Glycomics Market Volume Share (%), by Application 2025 & 2033
- Figure 47: Rest of the World Glycomics Market Revenue (billion), by Country 2025 & 2033
- Figure 48: Rest of the World Glycomics Market Volume (K Unit), by Country 2025 & 2033
- Figure 49: Rest of the World Glycomics Market Revenue Share (%), by Country 2025 & 2033
- Figure 50: Rest of the World Glycomics Market Volume Share (%), by Country 2025 & 2033
List of Tables
- Table 1: Global Glycomics Market Revenue billion Forecast, by Product Type 2020 & 2033
- Table 2: Global Glycomics Market Volume K Unit Forecast, by Product Type 2020 & 2033
- Table 3: Global Glycomics Market Revenue billion Forecast, by Application 2020 & 2033
- Table 4: Global Glycomics Market Volume K Unit Forecast, by Application 2020 & 2033
- Table 5: Global Glycomics Market Revenue billion Forecast, by Region 2020 & 2033
- Table 6: Global Glycomics Market Volume K Unit Forecast, by Region 2020 & 2033
- Table 7: Global Glycomics Market Revenue billion Forecast, by Product Type 2020 & 2033
- Table 8: Global Glycomics Market Volume K Unit Forecast, by Product Type 2020 & 2033
- Table 9: Global Glycomics Market Revenue billion Forecast, by Application 2020 & 2033
- Table 10: Global Glycomics Market Volume K Unit Forecast, by Application 2020 & 2033
- Table 11: Global Glycomics Market Revenue billion Forecast, by Country 2020 & 2033
- Table 12: Global Glycomics Market Volume K Unit Forecast, by Country 2020 & 2033
- Table 13: United States Glycomics Market Revenue (billion) Forecast, by Application 2020 & 2033
- Table 14: United States Glycomics Market Volume (K Unit) Forecast, by Application 2020 & 2033
- Table 15: Canada Glycomics Market Revenue (billion) Forecast, by Application 2020 & 2033
- Table 16: Canada Glycomics Market Volume (K Unit) Forecast, by Application 2020 & 2033
- Table 17: Mexico Glycomics Market Revenue (billion) Forecast, by Application 2020 & 2033
- Table 18: Mexico Glycomics Market Volume (K Unit) Forecast, by Application 2020 & 2033
- Table 19: Global Glycomics Market Revenue billion Forecast, by Product Type 2020 & 2033
- Table 20: Global Glycomics Market Volume K Unit Forecast, by Product Type 2020 & 2033
- Table 21: Global Glycomics Market Revenue billion Forecast, by Application 2020 & 2033
- Table 22: Global Glycomics Market Volume K Unit Forecast, by Application 2020 & 2033
- Table 23: Global Glycomics Market Revenue billion Forecast, by Country 2020 & 2033
- Table 24: Global Glycomics Market Volume K Unit Forecast, by Country 2020 & 2033
- Table 25: Germany Glycomics Market Revenue (billion) Forecast, by Application 2020 & 2033
- Table 26: Germany Glycomics Market Volume (K Unit) Forecast, by Application 2020 & 2033
- Table 27: United Kingdom Glycomics Market Revenue (billion) Forecast, by Application 2020 & 2033
- Table 28: United Kingdom Glycomics Market Volume (K Unit) Forecast, by Application 2020 & 2033
- Table 29: France Glycomics Market Revenue (billion) Forecast, by Application 2020 & 2033
- Table 30: France Glycomics Market Volume (K Unit) Forecast, by Application 2020 & 2033
- Table 31: Italy Glycomics Market Revenue (billion) Forecast, by Application 2020 & 2033
- Table 32: Italy Glycomics Market Volume (K Unit) Forecast, by Application 2020 & 2033
- Table 33: Spain Glycomics Market Revenue (billion) Forecast, by Application 2020 & 2033
- Table 34: Spain Glycomics Market Volume (K Unit) Forecast, by Application 2020 & 2033
- Table 35: Rest of Europe Glycomics Market Revenue (billion) Forecast, by Application 2020 & 2033
- Table 36: Rest of Europe Glycomics Market Volume (K Unit) Forecast, by Application 2020 & 2033
- Table 37: Global Glycomics Market Revenue billion Forecast, by Product Type 2020 & 2033
- Table 38: Global Glycomics Market Volume K Unit Forecast, by Product Type 2020 & 2033
- Table 39: Global Glycomics Market Revenue billion Forecast, by Application 2020 & 2033
- Table 40: Global Glycomics Market Volume K Unit Forecast, by Application 2020 & 2033
- Table 41: Global Glycomics Market Revenue billion Forecast, by Country 2020 & 2033
- Table 42: Global Glycomics Market Volume K Unit Forecast, by Country 2020 & 2033
- Table 43: China Glycomics Market Revenue (billion) Forecast, by Application 2020 & 2033
- Table 44: China Glycomics Market Volume (K Unit) Forecast, by Application 2020 & 2033
- Table 45: Japan Glycomics Market Revenue (billion) Forecast, by Application 2020 & 2033
- Table 46: Japan Glycomics Market Volume (K Unit) Forecast, by Application 2020 & 2033
- Table 47: India Glycomics Market Revenue (billion) Forecast, by Application 2020 & 2033
- Table 48: India Glycomics Market Volume (K Unit) Forecast, by Application 2020 & 2033
- Table 49: Australia Glycomics Market Revenue (billion) Forecast, by Application 2020 & 2033
- Table 50: Australia Glycomics Market Volume (K Unit) Forecast, by Application 2020 & 2033
- Table 51: South Korea Glycomics Market Revenue (billion) Forecast, by Application 2020 & 2033
- Table 52: South Korea Glycomics Market Volume (K Unit) Forecast, by Application 2020 & 2033
- Table 53: Rest of Asia Pacific Glycomics Market Revenue (billion) Forecast, by Application 2020 & 2033
- Table 54: Rest of Asia Pacific Glycomics Market Volume (K Unit) Forecast, by Application 2020 & 2033
- Table 55: Global Glycomics Market Revenue billion Forecast, by Product Type 2020 & 2033
- Table 56: Global Glycomics Market Volume K Unit Forecast, by Product Type 2020 & 2033
- Table 57: Global Glycomics Market Revenue billion Forecast, by Application 2020 & 2033
- Table 58: Global Glycomics Market Volume K Unit Forecast, by Application 2020 & 2033
- Table 59: Global Glycomics Market Revenue billion Forecast, by Country 2020 & 2033
- Table 60: Global Glycomics Market Volume K Unit Forecast, by Country 2020 & 2033
Frequently Asked Questions
1. What is the projected Compound Annual Growth Rate (CAGR) of the Glycomics Market?
The projected CAGR is approximately 13.85%.
2. Which companies are prominent players in the Glycomics Market?
Key companies in the market include Merck KGaA, Waters Corporation, Bruker, QA-Bio, Takara Bio Inc, Agilent Technologies Inc, New England Biolabs Inc, Shimadzu Corporation, Danaher (SCIEX), ThermoFisher Scientific Inc.
3. What are the main segments of the Glycomics Market?
The market segments include Product Type, Application.
4. Can you provide details about the market size?
The market size is estimated to be USD 2.12 billion as of 2022.
5. What are some drivers contributing to market growth?
; Increasing Research and Development Activities in Glycomics; Technological Advancements in Products.
6. What are the notable trends driving market growth?
Drug Discovery and Development Segment is Expected to Hold a Major Market Share in the Glycomics Market.
7. Are there any restraints impacting market growth?
; Complexity of Glycomics Coupled With The High Cost Involved in the Process.
8. Can you provide examples of recent developments in the market?
N/A
9. What pricing options are available for accessing the report?
Pricing options include single-user, multi-user, and enterprise licenses priced at USD 4750, USD 5250, and USD 8750 respectively.
10. Is the market size provided in terms of value or volume?
The market size is provided in terms of value, measured in billion and volume, measured in K Unit.
11. Are there any specific market keywords associated with the report?
Yes, the market keyword associated with the report is "Glycomics Market," which aids in identifying and referencing the specific market segment covered.
12. How do I determine which pricing option suits my needs best?
The pricing options vary based on user requirements and access needs. Individual users may opt for single-user licenses, while businesses requiring broader access may choose multi-user or enterprise licenses for cost-effective access to the report.
13. Are there any additional resources or data provided in the Glycomics Market report?
While the report offers comprehensive insights, it's advisable to review the specific contents or supplementary materials provided to ascertain if additional resources or data are available.
14. How can I stay updated on further developments or reports in the Glycomics Market?
To stay informed about further developments, trends, and reports in the Glycomics Market, consider subscribing to industry newsletters, following relevant companies and organizations, or regularly checking reputable industry news sources and publications.
Methodology
Step 1 - Identification of Relevant Samples Size from Population Database


Step 2 - Approaches for Defining Global Market Size (Value, Volume* & Price*)

Note*: In applicable scenarios
Step 3 - Data Sources
Primary Research
- Web Analytics
- Survey Reports
- Research Institute
- Latest Research Reports
- Opinion Leaders
Secondary Research
- Annual Reports
- White Paper
- Latest Press Release
- Industry Association
- Paid Database
- Investor Presentations

Step 4 - Data Triangulation
Involves using different sources of information in order to increase the validity of a study
These sources are likely to be stakeholders in a program - participants, other researchers, program staff, other community members, and so on.
Then we put all data in single framework & apply various statistical tools to find out the dynamic on the market.
During the analysis stage, feedback from the stakeholder groups would be compared to determine areas of agreement as well as areas of divergence