

Key Insights
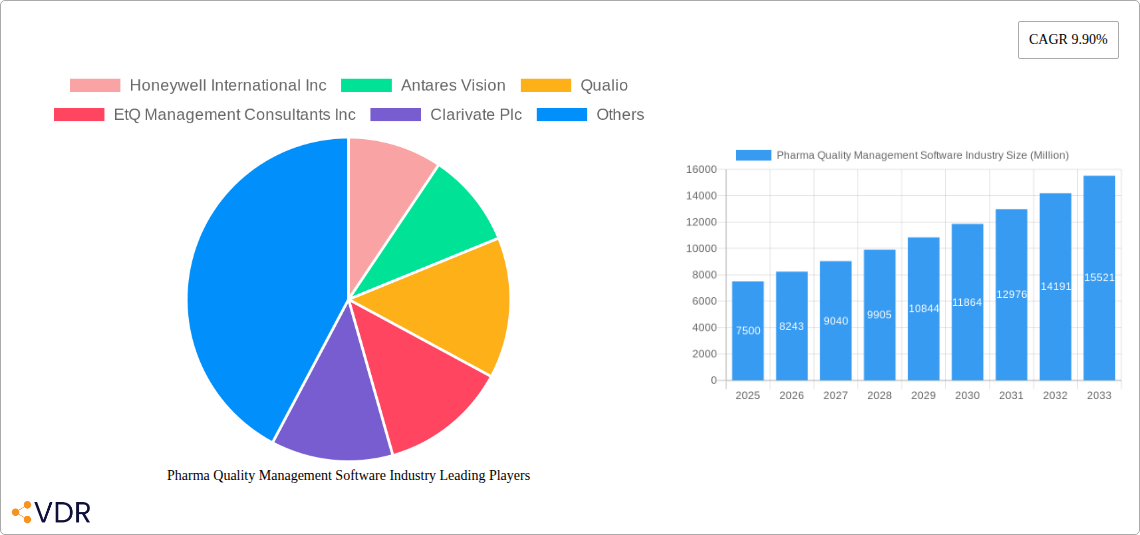
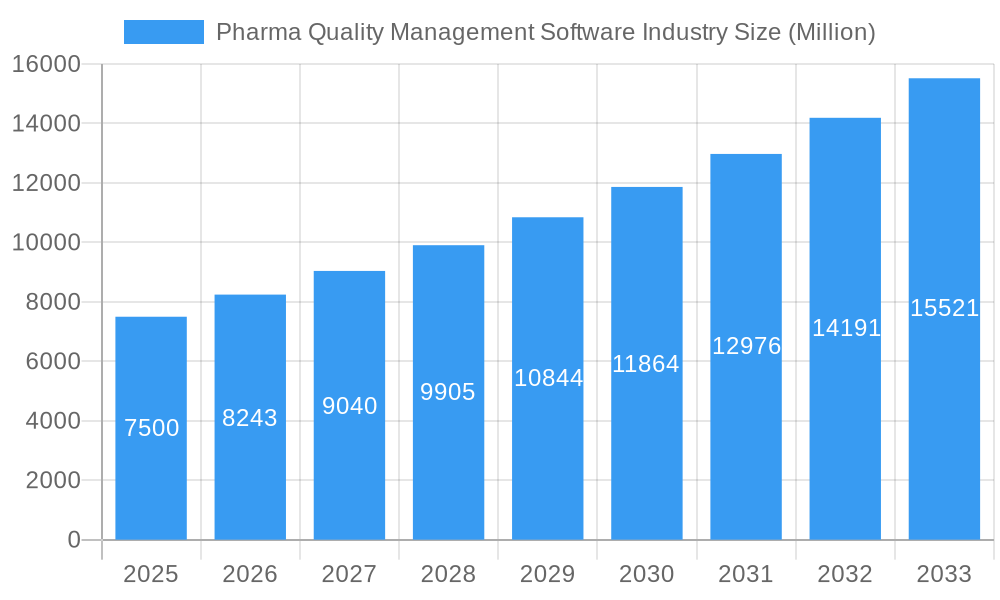
The global Pharmaceutical Quality Management Software (PQMS) market is projected for substantial growth, anticipating a market size of USD 7,500 million by 2025, driven by a robust Compound Annual Growth Rate (CAGR) of 11.62% between 2019 and 2033. This significant expansion highlights the indispensable role of QMS in pharmaceutical operations. Key growth catalysts include increasingly stringent global regulatory mandates (e.g., FDA, EMA) requiring comprehensive quality control and documentation. Escalating pharmaceutical supply chain complexity and a heightened focus on patient safety are compelling organizations to adopt advanced QMS for ensuring product integrity and regulatory adherence. Digital transformation within life sciences and the uptake of scalable, accessible cloud-based solutions further accelerate market development.
Pharma Quality Management Software Industry Market Size (In Billion)
The market landscape features several critical solution types, with Audit Management, Document Management, and Regulatory & Compliance Management being paramount for pharmaceutical entities. The adoption of On-Cloud deployment is rapidly increasing due to its cost-effectiveness, flexibility, and ease of integration, especially benefiting Small and Medium Enterprises (SMEs) seeking sophisticated QMS capabilities without extensive infrastructure investments. However, potential market restraints include the high initial costs associated with implementing complex, integrated systems and the requirement for specialized IT expertise. Leading industry players, including Honeywell International Inc., Antares Vision, Qualio, EtQ Management Consultants Inc., Clarivate Plc., and Veeva Systems Inc., are actively innovating and expanding their portfolios to meet evolving market demands. North America and Europe currently dominate market share.
Pharma Quality Management Software Industry Company Market Share
This comprehensive report analyzes the global Pharmaceutical Quality Management Software (PQMS) industry, examining market dynamics, growth trajectories, regional leadership, product offerings, key drivers, challenges, and emerging opportunities. Covering the period from 2019 to 2033, with a base and forecast year of 2025, this research provides critical intelligence for stakeholders navigating the intricate regulatory and technological advancements in pharmaceutical quality. The analysis includes granular segmentation by Solution Type (e.g., Audit Management, Document Management, Regulatory & Compliance Management), Deployment (On Cloud, On-premise), and Enterprise Size (Small and Medium Enterprise (SME), Large Enterprise). The report utilizes high-impact SEO keywords such as "pharmaceutical quality management software," "GxP compliance software," "life sciences QMS," "cloud-based pharma QMS," and "regulatory compliance solutions" for optimal industry professional engagement. All data is presented in millions, with 'xx' denoting unavailable or predicted values where applicable.
Pharma Quality Management Software Industry Market Dynamics & Structure
The Pharma Quality Management Software (PQMS) industry is characterized by a moderately concentrated market structure, driven by a blend of established players and emerging innovators. Technological innovation is a paramount driver, with companies continually enhancing their solutions to meet evolving GxP requirements and streamline complex pharmaceutical operations. Regulatory frameworks, such as FDA regulations, EMA guidelines, and ICH standards, act as both a catalyst for PQMS adoption and a significant barrier to entry, demanding robust compliance features. Competitive product substitutes, including manual processes and less integrated software solutions, are increasingly being phased out as the benefits of dedicated PQMS become evident. End-user demographics are shifting towards a greater reliance on digital solutions across all enterprise sizes, from SMEs to large enterprises, seeking efficiency and data integrity. Mergers and acquisitions (M&A) are a notable trend, as larger players acquire specialized companies to expand their product portfolios and market reach.
- Market Concentration: Dominated by a few key players but with growing influence from specialized vendors.
- Technological Innovation: Focus on AI, machine learning, and cloud-native architectures for enhanced data analytics and predictive quality.
- Regulatory Frameworks: Strict adherence to GxP, FDA, EMA, and ICH guidelines is non-negotiable, driving demand for certified solutions.
- Competitive Landscape: Increasing competition from cloud-based SaaS providers offering flexible and scalable solutions.
- End-User Demographics: Growing adoption across pharmaceutical manufacturing, research and development, and clinical trial management sectors.
- M&A Trends: Strategic acquisitions to consolidate market share and acquire innovative technologies.
Pharma Quality Management Software Industry Growth Trends & Insights
The Pharma Quality Management Software (PQMS) market is experiencing robust growth, propelled by the increasing stringency of global pharmaceutical regulations and the imperative for enhanced operational efficiency. The global market size for PQMS is projected to reach approximately $4,500 Million by 2025, with a projected CAGR of 12.5% during the forecast period of 2025–2033. This growth is underpinned by rising adoption rates across various segments, including Document Management, Audit Management, and Regulatory Compliance Management. Technological disruptions, such as the integration of artificial intelligence (AI) and machine learning (ML) for predictive analytics and automated quality checks, are significantly enhancing PQMS capabilities. Consumer behavior shifts, driven by a demand for greater transparency, data security, and faster drug development cycles, are further accelerating the adoption of sophisticated PQMS solutions. The market penetration of cloud-based PQMS is rapidly increasing, offering scalability, accessibility, and cost-effectiveness, particularly for SMEs. The growing complexity of drug development, coupled with the constant threat of product recalls and regulatory non-compliance, creates a continuous need for advanced quality management systems. The increasing outsourcing of pharmaceutical manufacturing and R&D activities also contributes to the demand for integrated PQMS solutions that can manage quality across a distributed supply chain. Furthermore, the rising focus on data integrity and the need to comply with evolving data privacy regulations are pushing pharmaceutical companies to invest in robust PQMS that ensure secure and accurate data handling. The digital transformation initiatives within the pharmaceutical industry are a major catalyst, encouraging the adoption of advanced software solutions that can automate processes, reduce manual errors, and provide real-time insights into quality performance.
Dominant Regions, Countries, or Segments in Pharma Quality Management Software Industry
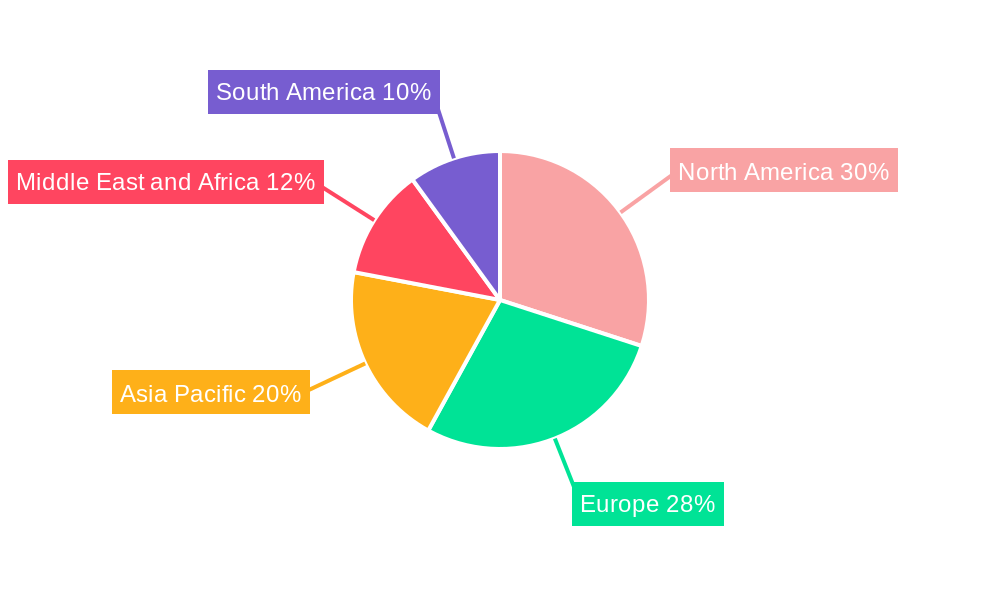
North America currently holds a dominant position in the Pharma Quality Management Software (PQMS) market, driven by a mature pharmaceutical industry, stringent regulatory oversight by the FDA, and a high concentration of life sciences companies. The United States, in particular, represents a significant market share due to its extensive R&D activities and robust manufacturing capabilities. Europe follows closely, with countries like Germany, the UK, and Switzerland exhibiting strong demand for PQMS solutions due to stringent EMA regulations and a well-established pharmaceutical manufacturing base.
Within the Solution Type segment, Regulatory and Compliance Management is a leading driver, as pharmaceutical companies prioritize adherence to global GxP guidelines. Document Management and Audit Management are also critical components, facilitating efficient record-keeping and internal/external audits. The Deployment segment sees On Cloud solutions rapidly gaining traction, offering scalability, accessibility, and cost-efficiency, especially for SMEs. However, On-premise solutions still hold a significant share, particularly for large enterprises with specific data security concerns. In terms of Enterprise Size, Large Enterprises have historically been the primary adopters, investing heavily in comprehensive PQMS. However, the growing accessibility and affordability of cloud-based solutions are fueling significant growth in the Small and Medium Enterprise (SME) segment, as these businesses increasingly recognize the importance of robust quality management for their growth and competitiveness.
- Key Drivers in North America: FDA regulations, high R&D investment, presence of major pharmaceutical players, strong demand for digital transformation.
- Dominance Factors in Europe: EMA directives, well-developed pharmaceutical manufacturing infrastructure, increasing focus on pharmacovigilance.
- Leading Solution Type: Regulatory and Compliance Management, driven by the need for global GxP adherence.
- Deployment Trends: Rapid adoption of On Cloud solutions due to flexibility and scalability.
- Enterprise Size Growth: Significant expansion in the SME segment driven by accessible cloud-based offerings.
Pharma Quality Management Software Industry Product Landscape
The PQMS product landscape is characterized by continuous innovation focused on enhancing user experience, data analytics, and integration capabilities. Modern PQMS solutions offer modular architectures, allowing companies to select and implement features that best suit their specific needs, ranging from robust audit trails and electronic signatures to automated workflow management and risk-based decision-making tools. Advanced features such as AI-powered anomaly detection in manufacturing processes, predictive quality analytics, and seamless integration with enterprise resource planning (ERP) and laboratory information management systems (LIMS) are becoming standard. The emphasis is on providing a unified platform for managing all quality-related activities, ensuring data integrity, and facilitating compliance with evolving regulatory requirements. Unique selling propositions often revolve around intuitive interfaces, comprehensive validation support, and flexible customization options to adapt to diverse pharmaceutical manufacturing environments.
Key Drivers, Barriers & Challenges in Pharma Quality Management Software Industry
The Pharma Quality Management Software (PQMS) market is primarily propelled by the relentless need for regulatory compliance, driven by stringent global health authority mandates like GxP. Operational efficiency and the pursuit of reduced manufacturing costs through process optimization are also significant drivers. The increasing complexity of the pharmaceutical supply chain and the growing emphasis on data integrity further necessitate advanced PQMS solutions.
Key challenges include the high cost of implementation and validation, which can be a barrier for smaller organizations. Resistance to change from employees accustomed to traditional methods and the complexity of integrating PQMS with existing legacy systems are also significant hurdles. Cybersecurity threats and ensuring data privacy in a digital environment present ongoing challenges, alongside the ever-present risk of evolving regulatory landscapes requiring continuous system updates.
Emerging Opportunities in Pharma Quality Management Software Industry
Emerging opportunities lie in the increasing demand for AI-powered PQMS solutions that offer predictive analytics for quality control and proactive risk mitigation. The growing focus on patient-centric drug development is creating a need for PQMS that can better manage clinical trial quality and patient data. Furthermore, the expansion of the biologics and personalized medicine sectors presents new avenues for specialized PQMS functionalities. The untapped potential within emerging markets in Asia and Latin America, coupled with the increasing adoption of digital health technologies, offers significant growth prospects for PQMS providers. The trend towards sustainable pharmaceutical manufacturing also presents an opportunity for PQMS to track and manage environmental quality parameters.
Growth Accelerators in the Pharma Quality Management Software Industry Industry
Several growth accelerators are propelling the PQMS industry forward. The increasing emphasis on digital transformation within the pharmaceutical sector is a primary catalyst, encouraging the adoption of integrated software solutions. Strategic partnerships between PQMS vendors and other technology providers, such as those offering AI or IoT solutions, are fostering innovation and expanding market reach. Government initiatives promoting drug safety and quality standards also contribute to market growth. Moreover, the ongoing evolution of cloud computing offers more scalable and affordable solutions, driving adoption across a wider range of pharmaceutical companies. The continuous rise in global pharmaceutical R&D spending also directly translates to increased demand for robust quality management systems.
Key Players Shaping the Pharma Quality Management Software Industry Market
- Honeywell International Inc.
- Antares Vision
- Qualio
- EtQ Management Consultants Inc.
- Clarivate Plc
- AssurX Inc.
- Veeva Systems Inc.
- AXSource
- IQVIA
- Ideagen PLC
- ComplianceQuest
- Dassault Systemes
Notable Milestones in Pharma Quality Management Software Industry Sector
- January 2023: Palantir Technologies Inc. launched a fit-for-purpose Quality Management System to help its life sciences customers using the Foundry platform meet GxP requirements.
- December 2022: FILTEC, a provider of in-line inspection solutions, launched a new Remote Vision Inspection (RVI) system, a compact and flexible machine vision solution for inspection.
- August 2022: The National Pharmaceutical Pricing Authority (NPPA) launched Integrated Pharmaceutical Database Management System 2.0 and Pharma Sahi Daam 2.0 apps for enhancing ease of business.
In-Depth Pharma Quality Management Software Industry Market Outlook
The future outlook for the Pharma Quality Management Software (PQMS) industry is exceptionally promising, driven by an unwavering commitment to patient safety and regulatory adherence. Growth accelerators such as the pervasive adoption of cloud technologies, the integration of advanced AI for predictive quality, and the increasing demand for integrated supply chain quality management will continue to shape market expansion. Strategic collaborations and a focus on addressing the unique quality needs of emerging therapeutic areas like biologics and gene therapies will unlock further potential. The ongoing digital transformation of the pharmaceutical sector will ensure that PQMS remains an indispensable tool for ensuring compliance, driving efficiency, and ultimately contributing to the development and delivery of safe and effective medicines globally.
Pharma Quality Management Software Industry Segmentation
-
1. Solution Type
- 1.1. Correcti
- 1.2. Audit Management
- 1.3. Document Management
- 1.4. Change Management
- 1.5. Training Management
- 1.6. Complaints Management
- 1.7. Regulatory and Compliance Management
- 1.8. Non-Conformances Handling
- 1.9. Supplier Quality Management
- 1.10. Inspection Management
- 1.11. Other solution Types
-
2. Deployment
- 2.1. On Cloud
- 2.2. On-premise
-
3. Enterprize Size
- 3.1. Small and Medium Enterprise (SME)
- 3.2. Large Enterprise
Pharma Quality Management Software Industry Segmentation By Geography
-
1. North America
- 1.1. United States
- 1.2. Canada
- 1.3. Mexico
-
2. Europe
- 2.1. Germany
- 2.2. United Kingdom
- 2.3. France
- 2.4. Italy
- 2.5. Spain
- 2.6. Rest of Europe
-
3. Asia Pacific
- 3.1. China
- 3.2. Japan
- 3.3. India
- 3.4. Australia
- 3.5. South Korea
- 3.6. Rest of Asia Pacific
-
4. Middle East and Africa
- 4.1. GCC
- 4.2. South Africa
- 4.3. Rest of Middle East and Africa
-
5. South America
- 5.1. Brazil
- 5.2. Argentina
- 5.3. Rest of South America
Pharma Quality Management Software Industry Regional Market Share
Geographic Coverage of Pharma Quality Management Software Industry
Pharma Quality Management Software Industry REPORT HIGHLIGHTS
| Aspects | Details |
|---|---|
| Study Period | 2020-2034 |
| Base Year | 2025 |
| Estimated Year | 2026 |
| Forecast Period | 2026-2034 |
| Historical Period | 2020-2025 |
| Growth Rate | CAGR of 11.62% from 2020-2034 |
| Segmentation |
|
Table of Contents
- 1. Introduction
- 1.1. Research Scope
- 1.2. Market Segmentation
- 1.3. Research Objective
- 1.4. Definitions and Assumptions
- 2. Executive Summary
- 2.1. Market Snapshot
- 3. Market Dynamics
- 3.1. Market Drivers
- 3.2. Market Restrains
- 3.3. Market Trends
- 3.4. Market Opportunities
- 4. Market Factor Analysis
- 4.1. Porters Five Forces
- 4.1.1. Bargaining Power of Suppliers
- 4.1.2. Bargaining Power of Buyers
- 4.1.3. Threat of New Entrants
- 4.1.4. Threat of Substitutes
- 4.1.5. Competitive Rivalry
- 4.2. PESTEL analysis
- 4.3. BCG Analysis
- 4.3.1. Stars (High Growth, High Market Share)
- 4.3.2. Cash Cows (Low Growth, High Market Share)
- 4.3.3. Question Mark (High Growth, Low Market Share)
- 4.3.4. Dogs (Low Growth, Low Market Share)
- 4.4. Ansoff Matrix Analysis
- 4.5. Supply Chain Analysis
- 4.6. Regulatory Landscape
- 4.7. Current Market Potential and Opportunity Assessment (TAM–SAM–SOM Framework)
- 4.8. VDR Analyst Note
- 4.1. Porters Five Forces
- 5. Market Analysis, Insights and Forecast 2021-2033
- 5.1. Market Analysis, Insights and Forecast - by Solution Type
- 5.1.1. Correcti
- 5.1.2. Audit Management
- 5.1.3. Document Management
- 5.1.4. Change Management
- 5.1.5. Training Management
- 5.1.6. Complaints Management
- 5.1.7. Regulatory and Compliance Management
- 5.1.8. Non-Conformances Handling
- 5.1.9. Supplier Quality Management
- 5.1.10. Inspection Management
- 5.1.11. Other solution Types
- 5.2. Market Analysis, Insights and Forecast - by Deployment
- 5.2.1. On Cloud
- 5.2.2. On-premise
- 5.3. Market Analysis, Insights and Forecast - by Enterprize Size
- 5.3.1. Small and Medium Enterprise (SME)
- 5.3.2. Large Enterprise
- 5.4. Market Analysis, Insights and Forecast - by Region
- 5.4.1. North America
- 5.4.2. Europe
- 5.4.3. Asia Pacific
- 5.4.4. Middle East and Africa
- 5.4.5. South America
- 5.1. Market Analysis, Insights and Forecast - by Solution Type
- 6. Global Pharma Quality Management Software Industry Analysis, Insights and Forecast, 2021-2033
- 6.1. Market Analysis, Insights and Forecast - by Solution Type
- 6.1.1. Correcti
- 6.1.2. Audit Management
- 6.1.3. Document Management
- 6.1.4. Change Management
- 6.1.5. Training Management
- 6.1.6. Complaints Management
- 6.1.7. Regulatory and Compliance Management
- 6.1.8. Non-Conformances Handling
- 6.1.9. Supplier Quality Management
- 6.1.10. Inspection Management
- 6.1.11. Other solution Types
- 6.2. Market Analysis, Insights and Forecast - by Deployment
- 6.2.1. On Cloud
- 6.2.2. On-premise
- 6.3. Market Analysis, Insights and Forecast - by Enterprize Size
- 6.3.1. Small and Medium Enterprise (SME)
- 6.3.2. Large Enterprise
- 6.1. Market Analysis, Insights and Forecast - by Solution Type
- 7. North America Pharma Quality Management Software Industry Analysis, Insights and Forecast, 2021-2033
- 7.1. Market Analysis, Insights and Forecast - by Solution Type
- 7.1.1. Correcti
- 7.1.2. Audit Management
- 7.1.3. Document Management
- 7.1.4. Change Management
- 7.1.5. Training Management
- 7.1.6. Complaints Management
- 7.1.7. Regulatory and Compliance Management
- 7.1.8. Non-Conformances Handling
- 7.1.9. Supplier Quality Management
- 7.1.10. Inspection Management
- 7.1.11. Other solution Types
- 7.2. Market Analysis, Insights and Forecast - by Deployment
- 7.2.1. On Cloud
- 7.2.2. On-premise
- 7.3. Market Analysis, Insights and Forecast - by Enterprize Size
- 7.3.1. Small and Medium Enterprise (SME)
- 7.3.2. Large Enterprise
- 7.1. Market Analysis, Insights and Forecast - by Solution Type
- 8. Europe Pharma Quality Management Software Industry Analysis, Insights and Forecast, 2021-2033
- 8.1. Market Analysis, Insights and Forecast - by Solution Type
- 8.1.1. Correcti
- 8.1.2. Audit Management
- 8.1.3. Document Management
- 8.1.4. Change Management
- 8.1.5. Training Management
- 8.1.6. Complaints Management
- 8.1.7. Regulatory and Compliance Management
- 8.1.8. Non-Conformances Handling
- 8.1.9. Supplier Quality Management
- 8.1.10. Inspection Management
- 8.1.11. Other solution Types
- 8.2. Market Analysis, Insights and Forecast - by Deployment
- 8.2.1. On Cloud
- 8.2.2. On-premise
- 8.3. Market Analysis, Insights and Forecast - by Enterprize Size
- 8.3.1. Small and Medium Enterprise (SME)
- 8.3.2. Large Enterprise
- 8.1. Market Analysis, Insights and Forecast - by Solution Type
- 9. Asia Pacific Pharma Quality Management Software Industry Analysis, Insights and Forecast, 2021-2033
- 9.1. Market Analysis, Insights and Forecast - by Solution Type
- 9.1.1. Correcti
- 9.1.2. Audit Management
- 9.1.3. Document Management
- 9.1.4. Change Management
- 9.1.5. Training Management
- 9.1.6. Complaints Management
- 9.1.7. Regulatory and Compliance Management
- 9.1.8. Non-Conformances Handling
- 9.1.9. Supplier Quality Management
- 9.1.10. Inspection Management
- 9.1.11. Other solution Types
- 9.2. Market Analysis, Insights and Forecast - by Deployment
- 9.2.1. On Cloud
- 9.2.2. On-premise
- 9.3. Market Analysis, Insights and Forecast - by Enterprize Size
- 9.3.1. Small and Medium Enterprise (SME)
- 9.3.2. Large Enterprise
- 9.1. Market Analysis, Insights and Forecast - by Solution Type
- 10. Middle East and Africa Pharma Quality Management Software Industry Analysis, Insights and Forecast, 2021-2033
- 10.1. Market Analysis, Insights and Forecast - by Solution Type
- 10.1.1. Correcti
- 10.1.2. Audit Management
- 10.1.3. Document Management
- 10.1.4. Change Management
- 10.1.5. Training Management
- 10.1.6. Complaints Management
- 10.1.7. Regulatory and Compliance Management
- 10.1.8. Non-Conformances Handling
- 10.1.9. Supplier Quality Management
- 10.1.10. Inspection Management
- 10.1.11. Other solution Types
- 10.2. Market Analysis, Insights and Forecast - by Deployment
- 10.2.1. On Cloud
- 10.2.2. On-premise
- 10.3. Market Analysis, Insights and Forecast - by Enterprize Size
- 10.3.1. Small and Medium Enterprise (SME)
- 10.3.2. Large Enterprise
- 10.1. Market Analysis, Insights and Forecast - by Solution Type
- 11. South America Pharma Quality Management Software Industry Analysis, Insights and Forecast, 2021-2033
- 11.1. Market Analysis, Insights and Forecast - by Solution Type
- 11.1.1. Correcti
- 11.1.2. Audit Management
- 11.1.3. Document Management
- 11.1.4. Change Management
- 11.1.5. Training Management
- 11.1.6. Complaints Management
- 11.1.7. Regulatory and Compliance Management
- 11.1.8. Non-Conformances Handling
- 11.1.9. Supplier Quality Management
- 11.1.10. Inspection Management
- 11.1.11. Other solution Types
- 11.2. Market Analysis, Insights and Forecast - by Deployment
- 11.2.1. On Cloud
- 11.2.2. On-premise
- 11.3. Market Analysis, Insights and Forecast - by Enterprize Size
- 11.3.1. Small and Medium Enterprise (SME)
- 11.3.2. Large Enterprise
- 11.1. Market Analysis, Insights and Forecast - by Solution Type
- 12. Competitive Analysis
- 12.1. Company Profiles
- 12.1.1 Honeywell International Inc
- 12.1.1.1. Company Overview
- 12.1.1.2. Products
- 12.1.1.3. Company Financials
- 12.1.1.4. SWOT Analysis
- 12.1.2 Antares Vision
- 12.1.2.1. Company Overview
- 12.1.2.2. Products
- 12.1.2.3. Company Financials
- 12.1.2.4. SWOT Analysis
- 12.1.3 Qualio
- 12.1.3.1. Company Overview
- 12.1.3.2. Products
- 12.1.3.3. Company Financials
- 12.1.3.4. SWOT Analysis
- 12.1.4 EtQ Management Consultants Inc
- 12.1.4.1. Company Overview
- 12.1.4.2. Products
- 12.1.4.3. Company Financials
- 12.1.4.4. SWOT Analysis
- 12.1.5 Clarivate Plc
- 12.1.5.1. Company Overview
- 12.1.5.2. Products
- 12.1.5.3. Company Financials
- 12.1.5.4. SWOT Analysis
- 12.1.6 AssurX Inc
- 12.1.6.1. Company Overview
- 12.1.6.2. Products
- 12.1.6.3. Company Financials
- 12.1.6.4. SWOT Analysis
- 12.1.7 Veeva Systems Inc
- 12.1.7.1. Company Overview
- 12.1.7.2. Products
- 12.1.7.3. Company Financials
- 12.1.7.4. SWOT Analysis
- 12.1.8 AXSource
- 12.1.8.1. Company Overview
- 12.1.8.2. Products
- 12.1.8.3. Company Financials
- 12.1.8.4. SWOT Analysis
- 12.1.9 IQVIA
- 12.1.9.1. Company Overview
- 12.1.9.2. Products
- 12.1.9.3. Company Financials
- 12.1.9.4. SWOT Analysis
- 12.1.10 Ideagen PLC
- 12.1.10.1. Company Overview
- 12.1.10.2. Products
- 12.1.10.3. Company Financials
- 12.1.10.4. SWOT Analysis
- 12.1.11 ComplianceQuest
- 12.1.11.1. Company Overview
- 12.1.11.2. Products
- 12.1.11.3. Company Financials
- 12.1.11.4. SWOT Analysis
- 12.1.12 Dassault Systemes
- 12.1.12.1. Company Overview
- 12.1.12.2. Products
- 12.1.12.3. Company Financials
- 12.1.12.4. SWOT Analysis
- 12.1.1 Honeywell International Inc
- 12.2. Market Entropy
- 12.2.1 Company's Key Areas Served
- 12.2.2 Recent Developments
- 12.3. Company Market Share Analysis 2025
- 12.3.1 Top 5 Companies Market Share Analysis
- 12.3.2 Top 3 Companies Market Share Analysis
- 12.4. List of Potential Customers
- 13. Research Methodology
List of Figures
- Figure 1: Global Pharma Quality Management Software Industry Revenue Breakdown (billion, %) by Region 2025 & 2033
- Figure 2: Global Pharma Quality Management Software Industry Volume Breakdown (K Unit, %) by Region 2025 & 2033
- Figure 3: North America Pharma Quality Management Software Industry Revenue (billion), by Solution Type 2025 & 2033
- Figure 4: North America Pharma Quality Management Software Industry Volume (K Unit), by Solution Type 2025 & 2033
- Figure 5: North America Pharma Quality Management Software Industry Revenue Share (%), by Solution Type 2025 & 2033
- Figure 6: North America Pharma Quality Management Software Industry Volume Share (%), by Solution Type 2025 & 2033
- Figure 7: North America Pharma Quality Management Software Industry Revenue (billion), by Deployment 2025 & 2033
- Figure 8: North America Pharma Quality Management Software Industry Volume (K Unit), by Deployment 2025 & 2033
- Figure 9: North America Pharma Quality Management Software Industry Revenue Share (%), by Deployment 2025 & 2033
- Figure 10: North America Pharma Quality Management Software Industry Volume Share (%), by Deployment 2025 & 2033
- Figure 11: North America Pharma Quality Management Software Industry Revenue (billion), by Enterprize Size 2025 & 2033
- Figure 12: North America Pharma Quality Management Software Industry Volume (K Unit), by Enterprize Size 2025 & 2033
- Figure 13: North America Pharma Quality Management Software Industry Revenue Share (%), by Enterprize Size 2025 & 2033
- Figure 14: North America Pharma Quality Management Software Industry Volume Share (%), by Enterprize Size 2025 & 2033
- Figure 15: North America Pharma Quality Management Software Industry Revenue (billion), by Country 2025 & 2033
- Figure 16: North America Pharma Quality Management Software Industry Volume (K Unit), by Country 2025 & 2033
- Figure 17: North America Pharma Quality Management Software Industry Revenue Share (%), by Country 2025 & 2033
- Figure 18: North America Pharma Quality Management Software Industry Volume Share (%), by Country 2025 & 2033
- Figure 19: Europe Pharma Quality Management Software Industry Revenue (billion), by Solution Type 2025 & 2033
- Figure 20: Europe Pharma Quality Management Software Industry Volume (K Unit), by Solution Type 2025 & 2033
- Figure 21: Europe Pharma Quality Management Software Industry Revenue Share (%), by Solution Type 2025 & 2033
- Figure 22: Europe Pharma Quality Management Software Industry Volume Share (%), by Solution Type 2025 & 2033
- Figure 23: Europe Pharma Quality Management Software Industry Revenue (billion), by Deployment 2025 & 2033
- Figure 24: Europe Pharma Quality Management Software Industry Volume (K Unit), by Deployment 2025 & 2033
- Figure 25: Europe Pharma Quality Management Software Industry Revenue Share (%), by Deployment 2025 & 2033
- Figure 26: Europe Pharma Quality Management Software Industry Volume Share (%), by Deployment 2025 & 2033
- Figure 27: Europe Pharma Quality Management Software Industry Revenue (billion), by Enterprize Size 2025 & 2033
- Figure 28: Europe Pharma Quality Management Software Industry Volume (K Unit), by Enterprize Size 2025 & 2033
- Figure 29: Europe Pharma Quality Management Software Industry Revenue Share (%), by Enterprize Size 2025 & 2033
- Figure 30: Europe Pharma Quality Management Software Industry Volume Share (%), by Enterprize Size 2025 & 2033
- Figure 31: Europe Pharma Quality Management Software Industry Revenue (billion), by Country 2025 & 2033
- Figure 32: Europe Pharma Quality Management Software Industry Volume (K Unit), by Country 2025 & 2033
- Figure 33: Europe Pharma Quality Management Software Industry Revenue Share (%), by Country 2025 & 2033
- Figure 34: Europe Pharma Quality Management Software Industry Volume Share (%), by Country 2025 & 2033
- Figure 35: Asia Pacific Pharma Quality Management Software Industry Revenue (billion), by Solution Type 2025 & 2033
- Figure 36: Asia Pacific Pharma Quality Management Software Industry Volume (K Unit), by Solution Type 2025 & 2033
- Figure 37: Asia Pacific Pharma Quality Management Software Industry Revenue Share (%), by Solution Type 2025 & 2033
- Figure 38: Asia Pacific Pharma Quality Management Software Industry Volume Share (%), by Solution Type 2025 & 2033
- Figure 39: Asia Pacific Pharma Quality Management Software Industry Revenue (billion), by Deployment 2025 & 2033
- Figure 40: Asia Pacific Pharma Quality Management Software Industry Volume (K Unit), by Deployment 2025 & 2033
- Figure 41: Asia Pacific Pharma Quality Management Software Industry Revenue Share (%), by Deployment 2025 & 2033
- Figure 42: Asia Pacific Pharma Quality Management Software Industry Volume Share (%), by Deployment 2025 & 2033
- Figure 43: Asia Pacific Pharma Quality Management Software Industry Revenue (billion), by Enterprize Size 2025 & 2033
- Figure 44: Asia Pacific Pharma Quality Management Software Industry Volume (K Unit), by Enterprize Size 2025 & 2033
- Figure 45: Asia Pacific Pharma Quality Management Software Industry Revenue Share (%), by Enterprize Size 2025 & 2033
- Figure 46: Asia Pacific Pharma Quality Management Software Industry Volume Share (%), by Enterprize Size 2025 & 2033
- Figure 47: Asia Pacific Pharma Quality Management Software Industry Revenue (billion), by Country 2025 & 2033
- Figure 48: Asia Pacific Pharma Quality Management Software Industry Volume (K Unit), by Country 2025 & 2033
- Figure 49: Asia Pacific Pharma Quality Management Software Industry Revenue Share (%), by Country 2025 & 2033
- Figure 50: Asia Pacific Pharma Quality Management Software Industry Volume Share (%), by Country 2025 & 2033
- Figure 51: Middle East and Africa Pharma Quality Management Software Industry Revenue (billion), by Solution Type 2025 & 2033
- Figure 52: Middle East and Africa Pharma Quality Management Software Industry Volume (K Unit), by Solution Type 2025 & 2033
- Figure 53: Middle East and Africa Pharma Quality Management Software Industry Revenue Share (%), by Solution Type 2025 & 2033
- Figure 54: Middle East and Africa Pharma Quality Management Software Industry Volume Share (%), by Solution Type 2025 & 2033
- Figure 55: Middle East and Africa Pharma Quality Management Software Industry Revenue (billion), by Deployment 2025 & 2033
- Figure 56: Middle East and Africa Pharma Quality Management Software Industry Volume (K Unit), by Deployment 2025 & 2033
- Figure 57: Middle East and Africa Pharma Quality Management Software Industry Revenue Share (%), by Deployment 2025 & 2033
- Figure 58: Middle East and Africa Pharma Quality Management Software Industry Volume Share (%), by Deployment 2025 & 2033
- Figure 59: Middle East and Africa Pharma Quality Management Software Industry Revenue (billion), by Enterprize Size 2025 & 2033
- Figure 60: Middle East and Africa Pharma Quality Management Software Industry Volume (K Unit), by Enterprize Size 2025 & 2033
- Figure 61: Middle East and Africa Pharma Quality Management Software Industry Revenue Share (%), by Enterprize Size 2025 & 2033
- Figure 62: Middle East and Africa Pharma Quality Management Software Industry Volume Share (%), by Enterprize Size 2025 & 2033
- Figure 63: Middle East and Africa Pharma Quality Management Software Industry Revenue (billion), by Country 2025 & 2033
- Figure 64: Middle East and Africa Pharma Quality Management Software Industry Volume (K Unit), by Country 2025 & 2033
- Figure 65: Middle East and Africa Pharma Quality Management Software Industry Revenue Share (%), by Country 2025 & 2033
- Figure 66: Middle East and Africa Pharma Quality Management Software Industry Volume Share (%), by Country 2025 & 2033
- Figure 67: South America Pharma Quality Management Software Industry Revenue (billion), by Solution Type 2025 & 2033
- Figure 68: South America Pharma Quality Management Software Industry Volume (K Unit), by Solution Type 2025 & 2033
- Figure 69: South America Pharma Quality Management Software Industry Revenue Share (%), by Solution Type 2025 & 2033
- Figure 70: South America Pharma Quality Management Software Industry Volume Share (%), by Solution Type 2025 & 2033
- Figure 71: South America Pharma Quality Management Software Industry Revenue (billion), by Deployment 2025 & 2033
- Figure 72: South America Pharma Quality Management Software Industry Volume (K Unit), by Deployment 2025 & 2033
- Figure 73: South America Pharma Quality Management Software Industry Revenue Share (%), by Deployment 2025 & 2033
- Figure 74: South America Pharma Quality Management Software Industry Volume Share (%), by Deployment 2025 & 2033
- Figure 75: South America Pharma Quality Management Software Industry Revenue (billion), by Enterprize Size 2025 & 2033
- Figure 76: South America Pharma Quality Management Software Industry Volume (K Unit), by Enterprize Size 2025 & 2033
- Figure 77: South America Pharma Quality Management Software Industry Revenue Share (%), by Enterprize Size 2025 & 2033
- Figure 78: South America Pharma Quality Management Software Industry Volume Share (%), by Enterprize Size 2025 & 2033
- Figure 79: South America Pharma Quality Management Software Industry Revenue (billion), by Country 2025 & 2033
- Figure 80: South America Pharma Quality Management Software Industry Volume (K Unit), by Country 2025 & 2033
- Figure 81: South America Pharma Quality Management Software Industry Revenue Share (%), by Country 2025 & 2033
- Figure 82: South America Pharma Quality Management Software Industry Volume Share (%), by Country 2025 & 2033
List of Tables
- Table 1: Global Pharma Quality Management Software Industry Revenue billion Forecast, by Solution Type 2020 & 2033
- Table 2: Global Pharma Quality Management Software Industry Volume K Unit Forecast, by Solution Type 2020 & 2033
- Table 3: Global Pharma Quality Management Software Industry Revenue billion Forecast, by Deployment 2020 & 2033
- Table 4: Global Pharma Quality Management Software Industry Volume K Unit Forecast, by Deployment 2020 & 2033
- Table 5: Global Pharma Quality Management Software Industry Revenue billion Forecast, by Enterprize Size 2020 & 2033
- Table 6: Global Pharma Quality Management Software Industry Volume K Unit Forecast, by Enterprize Size 2020 & 2033
- Table 7: Global Pharma Quality Management Software Industry Revenue billion Forecast, by Region 2020 & 2033
- Table 8: Global Pharma Quality Management Software Industry Volume K Unit Forecast, by Region 2020 & 2033
- Table 9: Global Pharma Quality Management Software Industry Revenue billion Forecast, by Solution Type 2020 & 2033
- Table 10: Global Pharma Quality Management Software Industry Volume K Unit Forecast, by Solution Type 2020 & 2033
- Table 11: Global Pharma Quality Management Software Industry Revenue billion Forecast, by Deployment 2020 & 2033
- Table 12: Global Pharma Quality Management Software Industry Volume K Unit Forecast, by Deployment 2020 & 2033
- Table 13: Global Pharma Quality Management Software Industry Revenue billion Forecast, by Enterprize Size 2020 & 2033
- Table 14: Global Pharma Quality Management Software Industry Volume K Unit Forecast, by Enterprize Size 2020 & 2033
- Table 15: Global Pharma Quality Management Software Industry Revenue billion Forecast, by Country 2020 & 2033
- Table 16: Global Pharma Quality Management Software Industry Volume K Unit Forecast, by Country 2020 & 2033
- Table 17: United States Pharma Quality Management Software Industry Revenue (billion) Forecast, by Application 2020 & 2033
- Table 18: United States Pharma Quality Management Software Industry Volume (K Unit) Forecast, by Application 2020 & 2033
- Table 19: Canada Pharma Quality Management Software Industry Revenue (billion) Forecast, by Application 2020 & 2033
- Table 20: Canada Pharma Quality Management Software Industry Volume (K Unit) Forecast, by Application 2020 & 2033
- Table 21: Mexico Pharma Quality Management Software Industry Revenue (billion) Forecast, by Application 2020 & 2033
- Table 22: Mexico Pharma Quality Management Software Industry Volume (K Unit) Forecast, by Application 2020 & 2033
- Table 23: Global Pharma Quality Management Software Industry Revenue billion Forecast, by Solution Type 2020 & 2033
- Table 24: Global Pharma Quality Management Software Industry Volume K Unit Forecast, by Solution Type 2020 & 2033
- Table 25: Global Pharma Quality Management Software Industry Revenue billion Forecast, by Deployment 2020 & 2033
- Table 26: Global Pharma Quality Management Software Industry Volume K Unit Forecast, by Deployment 2020 & 2033
- Table 27: Global Pharma Quality Management Software Industry Revenue billion Forecast, by Enterprize Size 2020 & 2033
- Table 28: Global Pharma Quality Management Software Industry Volume K Unit Forecast, by Enterprize Size 2020 & 2033
- Table 29: Global Pharma Quality Management Software Industry Revenue billion Forecast, by Country 2020 & 2033
- Table 30: Global Pharma Quality Management Software Industry Volume K Unit Forecast, by Country 2020 & 2033
- Table 31: Germany Pharma Quality Management Software Industry Revenue (billion) Forecast, by Application 2020 & 2033
- Table 32: Germany Pharma Quality Management Software Industry Volume (K Unit) Forecast, by Application 2020 & 2033
- Table 33: United Kingdom Pharma Quality Management Software Industry Revenue (billion) Forecast, by Application 2020 & 2033
- Table 34: United Kingdom Pharma Quality Management Software Industry Volume (K Unit) Forecast, by Application 2020 & 2033
- Table 35: France Pharma Quality Management Software Industry Revenue (billion) Forecast, by Application 2020 & 2033
- Table 36: France Pharma Quality Management Software Industry Volume (K Unit) Forecast, by Application 2020 & 2033
- Table 37: Italy Pharma Quality Management Software Industry Revenue (billion) Forecast, by Application 2020 & 2033
- Table 38: Italy Pharma Quality Management Software Industry Volume (K Unit) Forecast, by Application 2020 & 2033
- Table 39: Spain Pharma Quality Management Software Industry Revenue (billion) Forecast, by Application 2020 & 2033
- Table 40: Spain Pharma Quality Management Software Industry Volume (K Unit) Forecast, by Application 2020 & 2033
- Table 41: Rest of Europe Pharma Quality Management Software Industry Revenue (billion) Forecast, by Application 2020 & 2033
- Table 42: Rest of Europe Pharma Quality Management Software Industry Volume (K Unit) Forecast, by Application 2020 & 2033
- Table 43: Global Pharma Quality Management Software Industry Revenue billion Forecast, by Solution Type 2020 & 2033
- Table 44: Global Pharma Quality Management Software Industry Volume K Unit Forecast, by Solution Type 2020 & 2033
- Table 45: Global Pharma Quality Management Software Industry Revenue billion Forecast, by Deployment 2020 & 2033
- Table 46: Global Pharma Quality Management Software Industry Volume K Unit Forecast, by Deployment 2020 & 2033
- Table 47: Global Pharma Quality Management Software Industry Revenue billion Forecast, by Enterprize Size 2020 & 2033
- Table 48: Global Pharma Quality Management Software Industry Volume K Unit Forecast, by Enterprize Size 2020 & 2033
- Table 49: Global Pharma Quality Management Software Industry Revenue billion Forecast, by Country 2020 & 2033
- Table 50: Global Pharma Quality Management Software Industry Volume K Unit Forecast, by Country 2020 & 2033
- Table 51: China Pharma Quality Management Software Industry Revenue (billion) Forecast, by Application 2020 & 2033
- Table 52: China Pharma Quality Management Software Industry Volume (K Unit) Forecast, by Application 2020 & 2033
- Table 53: Japan Pharma Quality Management Software Industry Revenue (billion) Forecast, by Application 2020 & 2033
- Table 54: Japan Pharma Quality Management Software Industry Volume (K Unit) Forecast, by Application 2020 & 2033
- Table 55: India Pharma Quality Management Software Industry Revenue (billion) Forecast, by Application 2020 & 2033
- Table 56: India Pharma Quality Management Software Industry Volume (K Unit) Forecast, by Application 2020 & 2033
- Table 57: Australia Pharma Quality Management Software Industry Revenue (billion) Forecast, by Application 2020 & 2033
- Table 58: Australia Pharma Quality Management Software Industry Volume (K Unit) Forecast, by Application 2020 & 2033
- Table 59: South Korea Pharma Quality Management Software Industry Revenue (billion) Forecast, by Application 2020 & 2033
- Table 60: South Korea Pharma Quality Management Software Industry Volume (K Unit) Forecast, by Application 2020 & 2033
- Table 61: Rest of Asia Pacific Pharma Quality Management Software Industry Revenue (billion) Forecast, by Application 2020 & 2033
- Table 62: Rest of Asia Pacific Pharma Quality Management Software Industry Volume (K Unit) Forecast, by Application 2020 & 2033
- Table 63: Global Pharma Quality Management Software Industry Revenue billion Forecast, by Solution Type 2020 & 2033
- Table 64: Global Pharma Quality Management Software Industry Volume K Unit Forecast, by Solution Type 2020 & 2033
- Table 65: Global Pharma Quality Management Software Industry Revenue billion Forecast, by Deployment 2020 & 2033
- Table 66: Global Pharma Quality Management Software Industry Volume K Unit Forecast, by Deployment 2020 & 2033
- Table 67: Global Pharma Quality Management Software Industry Revenue billion Forecast, by Enterprize Size 2020 & 2033
- Table 68: Global Pharma Quality Management Software Industry Volume K Unit Forecast, by Enterprize Size 2020 & 2033
- Table 69: Global Pharma Quality Management Software Industry Revenue billion Forecast, by Country 2020 & 2033
- Table 70: Global Pharma Quality Management Software Industry Volume K Unit Forecast, by Country 2020 & 2033
- Table 71: GCC Pharma Quality Management Software Industry Revenue (billion) Forecast, by Application 2020 & 2033
- Table 72: GCC Pharma Quality Management Software Industry Volume (K Unit) Forecast, by Application 2020 & 2033
- Table 73: South Africa Pharma Quality Management Software Industry Revenue (billion) Forecast, by Application 2020 & 2033
- Table 74: South Africa Pharma Quality Management Software Industry Volume (K Unit) Forecast, by Application 2020 & 2033
- Table 75: Rest of Middle East and Africa Pharma Quality Management Software Industry Revenue (billion) Forecast, by Application 2020 & 2033
- Table 76: Rest of Middle East and Africa Pharma Quality Management Software Industry Volume (K Unit) Forecast, by Application 2020 & 2033
- Table 77: Global Pharma Quality Management Software Industry Revenue billion Forecast, by Solution Type 2020 & 2033
- Table 78: Global Pharma Quality Management Software Industry Volume K Unit Forecast, by Solution Type 2020 & 2033
- Table 79: Global Pharma Quality Management Software Industry Revenue billion Forecast, by Deployment 2020 & 2033
- Table 80: Global Pharma Quality Management Software Industry Volume K Unit Forecast, by Deployment 2020 & 2033
- Table 81: Global Pharma Quality Management Software Industry Revenue billion Forecast, by Enterprize Size 2020 & 2033
- Table 82: Global Pharma Quality Management Software Industry Volume K Unit Forecast, by Enterprize Size 2020 & 2033
- Table 83: Global Pharma Quality Management Software Industry Revenue billion Forecast, by Country 2020 & 2033
- Table 84: Global Pharma Quality Management Software Industry Volume K Unit Forecast, by Country 2020 & 2033
- Table 85: Brazil Pharma Quality Management Software Industry Revenue (billion) Forecast, by Application 2020 & 2033
- Table 86: Brazil Pharma Quality Management Software Industry Volume (K Unit) Forecast, by Application 2020 & 2033
- Table 87: Argentina Pharma Quality Management Software Industry Revenue (billion) Forecast, by Application 2020 & 2033
- Table 88: Argentina Pharma Quality Management Software Industry Volume (K Unit) Forecast, by Application 2020 & 2033
- Table 89: Rest of South America Pharma Quality Management Software Industry Revenue (billion) Forecast, by Application 2020 & 2033
- Table 90: Rest of South America Pharma Quality Management Software Industry Volume (K Unit) Forecast, by Application 2020 & 2033
Frequently Asked Questions
1. What is the projected Compound Annual Growth Rate (CAGR) of the Pharma Quality Management Software Industry?
The projected CAGR is approximately 11.62%.
2. Which companies are prominent players in the Pharma Quality Management Software Industry?
Key companies in the market include Honeywell International Inc, Antares Vision, Qualio, EtQ Management Consultants Inc, Clarivate Plc, AssurX Inc, Veeva Systems Inc, AXSource, IQVIA, Ideagen PLC, ComplianceQuest, Dassault Systemes.
3. What are the main segments of the Pharma Quality Management Software Industry?
The market segments include Solution Type, Deployment, Enterprize Size.
4. Can you provide details about the market size?
The market size is estimated to be USD 3.32 billion as of 2022.
5. What are some drivers contributing to market growth?
Increasing Cost of Drugs Manufacturing; Growing Technology Adoption in Pharmaceutical Industry.
6. What are the notable trends driving market growth?
Regulatory and Compliance Management Segment is Expected to Hold Significant Market Share Over the Forecast Period.
7. Are there any restraints impacting market growth?
Security Concerns Pertaining to On-Cloud Deployment; Lack of Regulations for Pharmaceutical Quality Management Software.
8. Can you provide examples of recent developments in the market?
January 2023: Palantir Technologies Inc. launched a fit-for-purpose Quality Management System to help its life sciences customers using the Foundry platform meet GxP requirements.
9. What pricing options are available for accessing the report?
Pricing options include single-user, multi-user, and enterprise licenses priced at USD 4750, USD 5250, and USD 8750 respectively.
10. Is the market size provided in terms of value or volume?
The market size is provided in terms of value, measured in billion and volume, measured in K Unit.
11. Are there any specific market keywords associated with the report?
Yes, the market keyword associated with the report is "Pharma Quality Management Software Industry," which aids in identifying and referencing the specific market segment covered.
12. How do I determine which pricing option suits my needs best?
The pricing options vary based on user requirements and access needs. Individual users may opt for single-user licenses, while businesses requiring broader access may choose multi-user or enterprise licenses for cost-effective access to the report.
13. Are there any additional resources or data provided in the Pharma Quality Management Software Industry report?
While the report offers comprehensive insights, it's advisable to review the specific contents or supplementary materials provided to ascertain if additional resources or data are available.
14. How can I stay updated on further developments or reports in the Pharma Quality Management Software Industry?
To stay informed about further developments, trends, and reports in the Pharma Quality Management Software Industry, consider subscribing to industry newsletters, following relevant companies and organizations, or regularly checking reputable industry news sources and publications.
Methodology
Step 1 - Identification of Relevant Samples Size from Population Database


Step 2 - Approaches for Defining Global Market Size (Value, Volume* & Price*)

Note*: In applicable scenarios
Step 3 - Data Sources
Primary Research
- Web Analytics
- Survey Reports
- Research Institute
- Latest Research Reports
- Opinion Leaders
Secondary Research
- Annual Reports
- White Paper
- Latest Press Release
- Industry Association
- Paid Database
- Investor Presentations

Step 4 - Data Triangulation
Involves using different sources of information in order to increase the validity of a study
These sources are likely to be stakeholders in a program - participants, other researchers, program staff, other community members, and so on.
Then we put all data in single framework & apply various statistical tools to find out the dynamic on the market.
During the analysis stage, feedback from the stakeholder groups would be compared to determine areas of agreement as well as areas of divergence