

Key Insights
The global Cerebral Vascular Stent market is projected to reach $1.5 billion by 2025, exhibiting a Compound Annual Growth Rate (CAGR) of 7%. This growth is driven by the rising incidence of cerebrovascular diseases, including intracranial stenosis and brain aneurysms, attributed to an aging population and lifestyle factors. Technological advancements in minimally invasive stent procedures are enhancing patient outcomes and recovery times, thereby accelerating market adoption. Increased demand for neurovascular interventions in healthcare facilities and growing global healthcare expenditure are further supporting market expansion. Innovations in stent designs, such as self-expanding and balloon-expanding models, are addressing diverse anatomical challenges and improving therapeutic effectiveness.
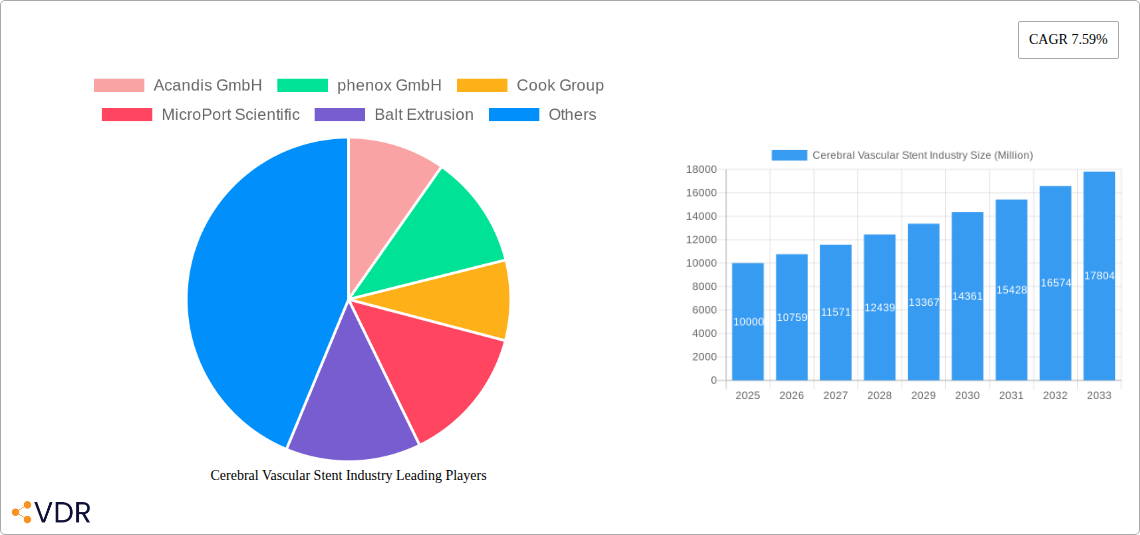
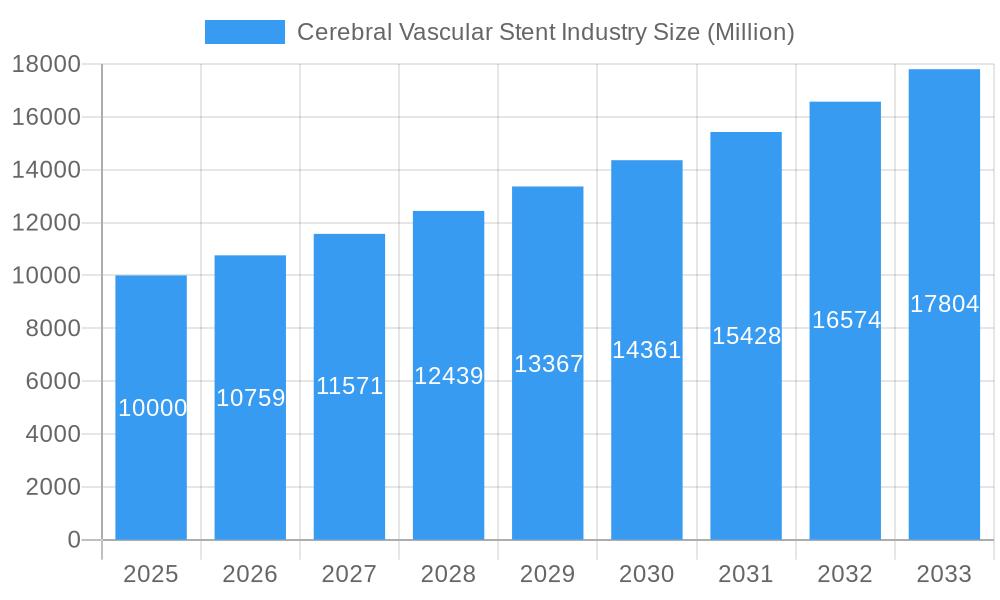
Cerebral Vascular Stent Industry Market Size (In Billion)
Key market trends include the growing use of stent-assisted coil embolization for complex aneurysms, offering a less invasive alternative to surgical clipping. Emerging markets, especially in the Asia Pacific, show significant potential due to improved healthcare infrastructure and increased patient awareness. Restraints include the high cost of advanced stent technologies and the requirement for specialized neurosurgeon training. Regulatory and reimbursement challenges also present complexities. However, strategic collaborations among leading companies such as Medtronic, Boston Scientific, and Stryker are driving innovation and market expansion. The ongoing development of novel biomaterials and drug-eluting stent technologies is expected to further improve treatment efficacy and patient safety, reinforcing the market's positive growth outlook.
Cerebral Vascular Stent Industry Company Market Share
Cerebral Vascular Stent Industry Market Analysis: Unveiling Growth & Innovation (2019-2033)
This comprehensive report delves into the dynamic Cerebral Vascular Stent Industry, providing an in-depth analysis of market dynamics, growth trends, regional dominance, product landscape, and key players. With a study period spanning 2019–2033 and a base year of 2025, this report equips industry professionals with actionable insights into the parent market of neurovascular devices and the child market of cerebral vascular stents. We forecast significant expansion driven by technological advancements, increasing incidence of cerebrovascular diseases, and a growing preference for minimally invasive endovascular procedures. All values are presented in Million units for clear quantitative understanding.
Cerebral Vascular Stent Industry Market Dynamics & Structure
The Cerebral Vascular Stent Industry exhibits a moderately concentrated market structure, characterized by a blend of established global players and emerging innovators. Technological innovation remains a primary driver, with companies continuously investing in research and development to create more effective, safer, and patient-friendly stent designs. The regulatory framework, while rigorous, ensures product quality and patient safety, influencing market entry and product approval timelines. Competitive product substitutes, primarily open surgical interventions and other endovascular devices, exert pressure but are increasingly being displaced by the superior minimally invasive nature of stenting. End-user demographics are shifting towards an aging global population with a higher prevalence of stroke risk factors, consequently increasing the demand for cerebral vascular stenting. Merger and acquisition (M&A) trends are observed as larger companies seek to expand their portfolios and gain market share through strategic acquisitions of innovative smaller firms.
- Market Concentration: Dominated by a few key players, but with a growing number of specialized companies.
- Technological Innovation: Focus on anti-thrombogenic coatings, advanced delivery systems, and improved deliverability.
- Regulatory Landscape: FDA and CE marking are critical for market access; evolving guidelines for novel devices.
- Competitive Landscape: Competition from open surgery, angioplasty balloons, and alternative endovascular therapies.
- End-User Trends: Increasing demand from an aging population and rising awareness of stroke prevention and treatment.
- M&A Activity: Strategic acquisitions aimed at expanding product offerings and market reach.
Cerebral Vascular Stent Industry Growth Trends & Insights
The Cerebral Vascular Stent Industry is poised for robust growth, driven by a confluence of factors including the increasing global burden of cerebrovascular diseases, such as intracranial stenosis and brain aneurysms, and a significant shift towards minimally invasive endovascular treatments. Patient preference for reduced recovery times, lower complication rates, and improved cosmetic outcomes further fuels adoption. Technological disruptions, such as the development of novel stent materials, advanced anti-thrombogenic coatings, and improved device deliverability, are expanding the therapeutic window and addressing previously unmet clinical needs. Consumer behavior is evolving, with greater patient and physician awareness regarding the benefits of endovascular interventions over traditional surgical approaches. The market size is projected to witness a healthy Compound Annual Growth Rate (CAGR) over the forecast period, reflecting these positive trends. Market penetration is expected to deepen as reimbursement policies become more favorable and healthcare infrastructure expands in emerging economies.
- Market Size Evolution: Significant expansion driven by increasing incidence of stroke and aneurysm.
- Adoption Rates: Rapid adoption of endovascular procedures due to favorable clinical outcomes and patient preference.
- Technological Disruptions: Innovations in stent design, coatings, and delivery systems are enhancing efficacy and safety.
- Consumer Behavior Shifts: Growing demand for minimally invasive treatments and improved patient outcomes.
- CAGR Projections: Expected to witness a substantial CAGR from 2025 to 2033.
- Market Penetration: Increasing penetration in both developed and emerging healthcare markets.
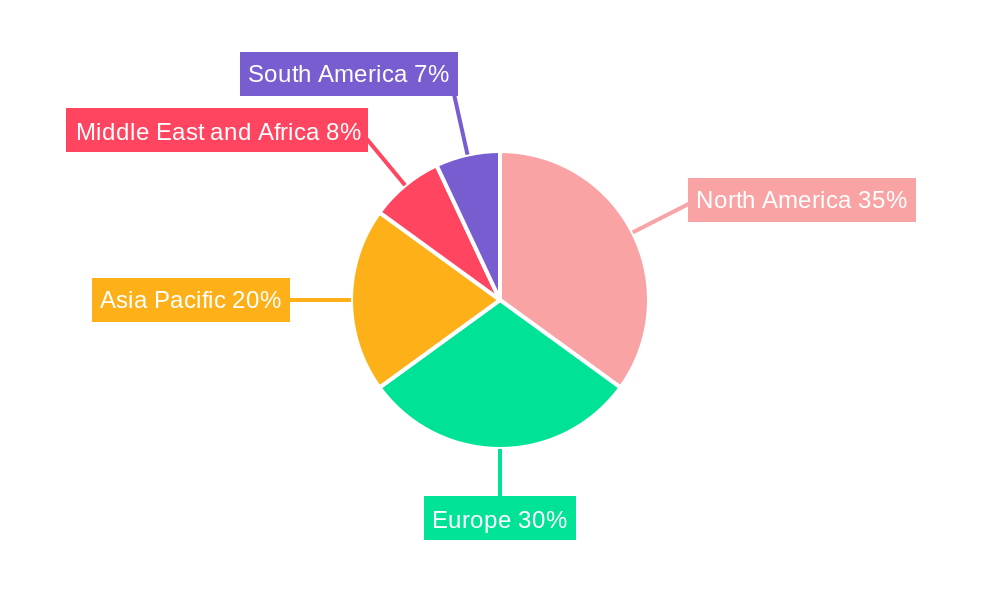
Dominant Regions, Countries, or Segments in Cerebral Vascular Stent Industry
The Intracranial Stenosis application segment is emerging as a dominant driver within the Cerebral Vascular Stent Industry. This is primarily due to the escalating prevalence of atherosclerotic disease affecting the intracranial arteries, leading to a higher incidence of ischemic strokes. North America, particularly the United States, currently leads in market share, attributed to its advanced healthcare infrastructure, high per capita expenditure on healthcare, a well-established reimbursement system for endovascular procedures, and a high concentration of leading medical device manufacturers and research institutions. The country’s proactive approach to stroke management and early diagnosis further bolsters demand for cerebral vascular stents.
- Dominant Application: Intracranial Stenosis, driven by rising stroke incidence.
- Leading Region: North America, spearheaded by the United States.
- Key Growth Factors in North America:
- Advanced healthcare infrastructure and high adoption of new technologies.
- Favorable reimbursement policies for endovascular procedures.
- Significant investment in R&D by leading medical device companies.
- High awareness and early diagnosis of cerebrovascular diseases.
- Dominant Stent Type: Self-expanding stents are gaining prominence due to their ease of deployment and ability to conform to tortuous anatomy, crucial for intracranial applications.
- Dominant End-User: Hospitals remain the primary end-users, performing the majority of complex neurovascular interventions. However, Ambulatory Surgery Centers (ASCs) are showing increasing adoption for less complex procedures.
- Market Share Dynamics: North America commands a substantial market share, followed by Europe, with Asia-Pacific demonstrating the fastest growth potential.
- Economic & Policy Drivers: Favorable government initiatives for stroke prevention and treatment, coupled with a growing emphasis on neurological health.
Cerebral Vascular Stent Industry Product Landscape
The Cerebral Vascular Stent Industry's product landscape is characterized by continuous innovation focused on enhancing stent performance and patient safety. Key product categories include self-expanding stents, known for their predictable radial force and ease of use in complex anatomies, and balloon-expanding stents, offering precise placement for specific stenotic lesions. Stent-assisted coil embolization represents a critical technique for treating brain aneurysms, providing a scaffold to retain embolic coils. Companies are heavily investing in advanced materials, such as nitinol alloys, and incorporating sophisticated anti-thrombogenic coatings to minimize the risk of device-related thrombosis. The unique selling propositions revolve around improved deliverability, enhanced navigability through tortuous vessels, and reduced procedural complications, ultimately leading to better patient outcomes.
Key Drivers, Barriers & Challenges in Cerebral Vascular Stent Industry
Key Drivers: The Cerebral Vascular Stent Industry is propelled by several key drivers. The increasing global prevalence of cerebrovascular diseases, including intracranial stenosis and brain aneurysms, directly translates to a higher demand for effective treatment solutions. Technological advancements in stent design, such as improved deliverability, enhanced trackability, and the development of advanced anti-thrombogenic coatings, are expanding the applicability of endovascular procedures. Furthermore, the growing preference for minimally invasive interventions over open surgery, owing to reduced patient trauma, faster recovery times, and better cosmetic outcomes, is a significant growth accelerator. Favorable reimbursement policies in developed nations and expanding healthcare access in emerging markets also contribute positively.
Barriers & Challenges: Despite the positive outlook, the industry faces several barriers and challenges. Stringent regulatory approval processes, requiring extensive clinical trials and demonstrating safety and efficacy, can prolong time-to-market and increase development costs. High research and development expenses associated with creating novel stent technologies pose a significant hurdle for smaller companies. The risk of device-related complications, such as thrombosis, restenosis, and stroke, although decreasing with technological advancements, remains a critical concern and requires ongoing vigilance. Competitive pricing pressures from both established players and generic manufacturers can impact profit margins. Supply chain disruptions, as witnessed during global health crises, can also affect production and availability. Finally, the need for specialized training for neurosurgeons and interventional neurologists to perform complex endovascular procedures can limit widespread adoption in certain regions.
Emerging Opportunities in Cerebral Vascular Stent Industry
Emerging opportunities within the Cerebral Vascular Stent Industry lie in several promising areas. The untapped potential of emerging economies in Asia-Pacific and Latin America, with their rapidly growing healthcare sectors and increasing disposable incomes, presents significant expansion avenues. The development of next-generation stents with enhanced bio-compatibility and reduced thrombogenicity, potentially incorporating drug-eluting technologies or advanced imaging capabilities, offers a pathway for product differentiation and improved patient care. Furthermore, exploring innovative applications for existing stent technologies in treating other vascular pathologies beyond the intracranial space could broaden market reach. Evolving consumer preferences for personalized medicine and patient-specific treatment plans may also lead to opportunities for customized stent solutions.
Growth Accelerators in the Cerebral Vascular Stent Industry Industry
Several catalysts are poised to accelerate long-term growth within the Cerebral Vascular Stent Industry. Technological breakthroughs, particularly in the realm of material science and nanotechnology, enabling the development of thinner, more flexible, and more biocompatible stents, will be crucial. Strategic partnerships between medical device manufacturers and academic research institutions are fostering innovation and accelerating the translation of novel technologies from lab to market. Market expansion strategies, including entering underserved geographical regions and targeting specific patient populations with tailored treatment approaches, will drive volume growth. The increasing focus on preventative stroke care and the early detection of vascular abnormalities will also create a sustained demand for advanced treatment modalities like cerebral vascular stenting.
Key Players Shaping the Cerebral Vascular Stent Industry Market
- Acandis GmbH
- phenox GmbH
- Cook Group
- MicroPort Scientific
- Balt Extrusion
- Terumo Corporation
- Johnson & Johnson Services Inc
- Medtronic Plc
- MicroPort Scientific Corporation
- Stryker Corporation
- Boston Scientific Corporation
- Penumbra Inc
Notable Milestones in Cerebral Vascular Stent Industry Sector
- September 2022: Wallaby/phenox launched a pEGASUS HPC stent with an anti-thrombogenic HPC coating technology, indicated for patients with intracranial aneurysms as well as stenoses in intracranial atherosclerotic disease (ICAD) patients, at the ESMINT 2022 congress in France.
- June 2022: Medtronic launched CE-marked fourth-generation flow diverter, Pipeline Vantage with Shield Technology for endovascular treatment for a brain aneurysm.
In-Depth Cerebral Vascular Stent Industry Market Outlook
The Cerebral Vascular Stent Industry is projected to experience sustained growth fueled by ongoing technological innovation and an increasing global demand for advanced neurovascular treatments. The continuous evolution of stent designs, incorporating superior materials and anti-thrombogenic coatings, promises to further enhance procedural safety and efficacy, thereby expanding the addressable market. Strategic collaborations between key players and research institutions will act as critical growth accelerators, bringing novel solutions to market more rapidly. As healthcare systems worldwide continue to prioritize minimally invasive procedures and invest in advanced medical technologies, the Cerebral Vascular Stent Industry is well-positioned to capitalize on these favorable trends, offering significant opportunities for market expansion and improved patient outcomes in the years to come.
Cerebral Vascular Stent Industry Segmentation
-
1. Type
- 1.1. Self-expanding Stents
- 1.2. Balloon Expanding Stents
- 1.3. Stent-assisted Coil Embolization
-
2. Application
- 2.1. Intracranial Stenosis
- 2.2. Brain Aneurysm
-
3. End-User
- 3.1. Hospitals
- 3.2. Ambulatory Surgery Centers
- 3.3. Others
Cerebral Vascular Stent Industry Segmentation By Geography
-
1. North America
- 1.1. United States
- 1.2. Canada
- 1.3. Mexico
-
2. Europe
- 2.1. Germany
- 2.2. United Kingdom
- 2.3. France
- 2.4. Italy
- 2.5. Spain
- 2.6. Rest of Europe
-
3. Asia Pacific
- 3.1. China
- 3.2. Japan
- 3.3. India
- 3.4. Australia
- 3.5. South Korea
- 3.6. Rest of Asia Pacific
-
4. Middle East and Africa
- 4.1. GCC
- 4.2. South Africa
- 4.3. Rest of Middle East and Africa
-
5. South America
- 5.1. Brazil
- 5.2. Argentina
- 5.3. Rest of South America
Cerebral Vascular Stent Industry Regional Market Share
Geographic Coverage of Cerebral Vascular Stent Industry
Cerebral Vascular Stent Industry REPORT HIGHLIGHTS
| Aspects | Details |
|---|---|
| Study Period | 2020-2034 |
| Base Year | 2025 |
| Estimated Year | 2026 |
| Forecast Period | 2026-2034 |
| Historical Period | 2020-2025 |
| Growth Rate | CAGR of 7% from 2020-2034 |
| Segmentation |
|
Table of Contents
- 1. Introduction
- 1.1. Research Scope
- 1.2. Market Segmentation
- 1.3. Research Objective
- 1.4. Definitions and Assumptions
- 2. Executive Summary
- 2.1. Market Snapshot
- 3. Market Dynamics
- 3.1. Market Drivers
- 3.2. Market Restrains
- 3.3. Market Trends
- 3.4. Market Opportunities
- 4. Market Factor Analysis
- 4.1. Porters Five Forces
- 4.1.1. Bargaining Power of Suppliers
- 4.1.2. Bargaining Power of Buyers
- 4.1.3. Threat of New Entrants
- 4.1.4. Threat of Substitutes
- 4.1.5. Competitive Rivalry
- 4.2. PESTEL analysis
- 4.3. BCG Analysis
- 4.3.1. Stars (High Growth, High Market Share)
- 4.3.2. Cash Cows (Low Growth, High Market Share)
- 4.3.3. Question Mark (High Growth, Low Market Share)
- 4.3.4. Dogs (Low Growth, Low Market Share)
- 4.4. Ansoff Matrix Analysis
- 4.5. Supply Chain Analysis
- 4.6. Regulatory Landscape
- 4.7. Current Market Potential and Opportunity Assessment (TAM–SAM–SOM Framework)
- 4.8. VDR Analyst Note
- 4.1. Porters Five Forces
- 5. Market Analysis, Insights and Forecast 2021-2033
- 5.1. Market Analysis, Insights and Forecast - by Type
- 5.1.1. Self-expanding Stents
- 5.1.2. Balloon Expanding Stents
- 5.1.3. Stent-assisted Coil Embolization
- 5.2. Market Analysis, Insights and Forecast - by Application
- 5.2.1. Intracranial Stenosis
- 5.2.2. Brain Aneurysm
- 5.3. Market Analysis, Insights and Forecast - by End-User
- 5.3.1. Hospitals
- 5.3.2. Ambulatory Surgery Centers
- 5.3.3. Others
- 5.4. Market Analysis, Insights and Forecast - by Region
- 5.4.1. North America
- 5.4.2. Europe
- 5.4.3. Asia Pacific
- 5.4.4. Middle East and Africa
- 5.4.5. South America
- 5.1. Market Analysis, Insights and Forecast - by Type
- 6. Global Cerebral Vascular Stent Industry Analysis, Insights and Forecast, 2021-2033
- 6.1. Market Analysis, Insights and Forecast - by Type
- 6.1.1. Self-expanding Stents
- 6.1.2. Balloon Expanding Stents
- 6.1.3. Stent-assisted Coil Embolization
- 6.2. Market Analysis, Insights and Forecast - by Application
- 6.2.1. Intracranial Stenosis
- 6.2.2. Brain Aneurysm
- 6.3. Market Analysis, Insights and Forecast - by End-User
- 6.3.1. Hospitals
- 6.3.2. Ambulatory Surgery Centers
- 6.3.3. Others
- 6.1. Market Analysis, Insights and Forecast - by Type
- 7. North America Cerebral Vascular Stent Industry Analysis, Insights and Forecast, 2021-2033
- 7.1. Market Analysis, Insights and Forecast - by Type
- 7.1.1. Self-expanding Stents
- 7.1.2. Balloon Expanding Stents
- 7.1.3. Stent-assisted Coil Embolization
- 7.2. Market Analysis, Insights and Forecast - by Application
- 7.2.1. Intracranial Stenosis
- 7.2.2. Brain Aneurysm
- 7.3. Market Analysis, Insights and Forecast - by End-User
- 7.3.1. Hospitals
- 7.3.2. Ambulatory Surgery Centers
- 7.3.3. Others
- 7.1. Market Analysis, Insights and Forecast - by Type
- 8. Europe Cerebral Vascular Stent Industry Analysis, Insights and Forecast, 2021-2033
- 8.1. Market Analysis, Insights and Forecast - by Type
- 8.1.1. Self-expanding Stents
- 8.1.2. Balloon Expanding Stents
- 8.1.3. Stent-assisted Coil Embolization
- 8.2. Market Analysis, Insights and Forecast - by Application
- 8.2.1. Intracranial Stenosis
- 8.2.2. Brain Aneurysm
- 8.3. Market Analysis, Insights and Forecast - by End-User
- 8.3.1. Hospitals
- 8.3.2. Ambulatory Surgery Centers
- 8.3.3. Others
- 8.1. Market Analysis, Insights and Forecast - by Type
- 9. Asia Pacific Cerebral Vascular Stent Industry Analysis, Insights and Forecast, 2021-2033
- 9.1. Market Analysis, Insights and Forecast - by Type
- 9.1.1. Self-expanding Stents
- 9.1.2. Balloon Expanding Stents
- 9.1.3. Stent-assisted Coil Embolization
- 9.2. Market Analysis, Insights and Forecast - by Application
- 9.2.1. Intracranial Stenosis
- 9.2.2. Brain Aneurysm
- 9.3. Market Analysis, Insights and Forecast - by End-User
- 9.3.1. Hospitals
- 9.3.2. Ambulatory Surgery Centers
- 9.3.3. Others
- 9.1. Market Analysis, Insights and Forecast - by Type
- 10. Middle East and Africa Cerebral Vascular Stent Industry Analysis, Insights and Forecast, 2021-2033
- 10.1. Market Analysis, Insights and Forecast - by Type
- 10.1.1. Self-expanding Stents
- 10.1.2. Balloon Expanding Stents
- 10.1.3. Stent-assisted Coil Embolization
- 10.2. Market Analysis, Insights and Forecast - by Application
- 10.2.1. Intracranial Stenosis
- 10.2.2. Brain Aneurysm
- 10.3. Market Analysis, Insights and Forecast - by End-User
- 10.3.1. Hospitals
- 10.3.2. Ambulatory Surgery Centers
- 10.3.3. Others
- 10.1. Market Analysis, Insights and Forecast - by Type
- 11. South America Cerebral Vascular Stent Industry Analysis, Insights and Forecast, 2021-2033
- 11.1. Market Analysis, Insights and Forecast - by Type
- 11.1.1. Self-expanding Stents
- 11.1.2. Balloon Expanding Stents
- 11.1.3. Stent-assisted Coil Embolization
- 11.2. Market Analysis, Insights and Forecast - by Application
- 11.2.1. Intracranial Stenosis
- 11.2.2. Brain Aneurysm
- 11.3. Market Analysis, Insights and Forecast - by End-User
- 11.3.1. Hospitals
- 11.3.2. Ambulatory Surgery Centers
- 11.3.3. Others
- 11.1. Market Analysis, Insights and Forecast - by Type
- 12. Competitive Analysis
- 12.1. Company Profiles
- 12.1.1 Acandis GmbH
- 12.1.1.1. Company Overview
- 12.1.1.2. Products
- 12.1.1.3. Company Financials
- 12.1.1.4. SWOT Analysis
- 12.1.2 phenox GmbH
- 12.1.2.1. Company Overview
- 12.1.2.2. Products
- 12.1.2.3. Company Financials
- 12.1.2.4. SWOT Analysis
- 12.1.3 Cook Group
- 12.1.3.1. Company Overview
- 12.1.3.2. Products
- 12.1.3.3. Company Financials
- 12.1.3.4. SWOT Analysis
- 12.1.4 MicroPort Scientific
- 12.1.4.1. Company Overview
- 12.1.4.2. Products
- 12.1.4.3. Company Financials
- 12.1.4.4. SWOT Analysis
- 12.1.5 Balt Extrusion
- 12.1.5.1. Company Overview
- 12.1.5.2. Products
- 12.1.5.3. Company Financials
- 12.1.5.4. SWOT Analysis
- 12.1.6 Terumo Corporation
- 12.1.6.1. Company Overview
- 12.1.6.2. Products
- 12.1.6.3. Company Financials
- 12.1.6.4. SWOT Analysis
- 12.1.7 Johnson & Johnson Services Inc
- 12.1.7.1. Company Overview
- 12.1.7.2. Products
- 12.1.7.3. Company Financials
- 12.1.7.4. SWOT Analysis
- 12.1.8 Medtronic Plc
- 12.1.8.1. Company Overview
- 12.1.8.2. Products
- 12.1.8.3. Company Financials
- 12.1.8.4. SWOT Analysis
- 12.1.9 MicroPort Scientific Corporation
- 12.1.9.1. Company Overview
- 12.1.9.2. Products
- 12.1.9.3. Company Financials
- 12.1.9.4. SWOT Analysis
- 12.1.10 Stryker Corporation
- 12.1.10.1. Company Overview
- 12.1.10.2. Products
- 12.1.10.3. Company Financials
- 12.1.10.4. SWOT Analysis
- 12.1.11 Boston Scientific Corporation
- 12.1.11.1. Company Overview
- 12.1.11.2. Products
- 12.1.11.3. Company Financials
- 12.1.11.4. SWOT Analysis
- 12.1.12 Penumbra Inc
- 12.1.12.1. Company Overview
- 12.1.12.2. Products
- 12.1.12.3. Company Financials
- 12.1.12.4. SWOT Analysis
- 12.1.1 Acandis GmbH
- 12.2. Market Entropy
- 12.2.1 Company's Key Areas Served
- 12.2.2 Recent Developments
- 12.3. Company Market Share Analysis 2025
- 12.3.1 Top 5 Companies Market Share Analysis
- 12.3.2 Top 3 Companies Market Share Analysis
- 12.4. List of Potential Customers
- 13. Research Methodology
List of Figures
- Figure 1: Global Cerebral Vascular Stent Industry Revenue Breakdown (billion, %) by Region 2025 & 2033
- Figure 2: Global Cerebral Vascular Stent Industry Volume Breakdown (K Unit, %) by Region 2025 & 2033
- Figure 3: North America Cerebral Vascular Stent Industry Revenue (billion), by Type 2025 & 2033
- Figure 4: North America Cerebral Vascular Stent Industry Volume (K Unit), by Type 2025 & 2033
- Figure 5: North America Cerebral Vascular Stent Industry Revenue Share (%), by Type 2025 & 2033
- Figure 6: North America Cerebral Vascular Stent Industry Volume Share (%), by Type 2025 & 2033
- Figure 7: North America Cerebral Vascular Stent Industry Revenue (billion), by Application 2025 & 2033
- Figure 8: North America Cerebral Vascular Stent Industry Volume (K Unit), by Application 2025 & 2033
- Figure 9: North America Cerebral Vascular Stent Industry Revenue Share (%), by Application 2025 & 2033
- Figure 10: North America Cerebral Vascular Stent Industry Volume Share (%), by Application 2025 & 2033
- Figure 11: North America Cerebral Vascular Stent Industry Revenue (billion), by End-User 2025 & 2033
- Figure 12: North America Cerebral Vascular Stent Industry Volume (K Unit), by End-User 2025 & 2033
- Figure 13: North America Cerebral Vascular Stent Industry Revenue Share (%), by End-User 2025 & 2033
- Figure 14: North America Cerebral Vascular Stent Industry Volume Share (%), by End-User 2025 & 2033
- Figure 15: North America Cerebral Vascular Stent Industry Revenue (billion), by Country 2025 & 2033
- Figure 16: North America Cerebral Vascular Stent Industry Volume (K Unit), by Country 2025 & 2033
- Figure 17: North America Cerebral Vascular Stent Industry Revenue Share (%), by Country 2025 & 2033
- Figure 18: North America Cerebral Vascular Stent Industry Volume Share (%), by Country 2025 & 2033
- Figure 19: Europe Cerebral Vascular Stent Industry Revenue (billion), by Type 2025 & 2033
- Figure 20: Europe Cerebral Vascular Stent Industry Volume (K Unit), by Type 2025 & 2033
- Figure 21: Europe Cerebral Vascular Stent Industry Revenue Share (%), by Type 2025 & 2033
- Figure 22: Europe Cerebral Vascular Stent Industry Volume Share (%), by Type 2025 & 2033
- Figure 23: Europe Cerebral Vascular Stent Industry Revenue (billion), by Application 2025 & 2033
- Figure 24: Europe Cerebral Vascular Stent Industry Volume (K Unit), by Application 2025 & 2033
- Figure 25: Europe Cerebral Vascular Stent Industry Revenue Share (%), by Application 2025 & 2033
- Figure 26: Europe Cerebral Vascular Stent Industry Volume Share (%), by Application 2025 & 2033
- Figure 27: Europe Cerebral Vascular Stent Industry Revenue (billion), by End-User 2025 & 2033
- Figure 28: Europe Cerebral Vascular Stent Industry Volume (K Unit), by End-User 2025 & 2033
- Figure 29: Europe Cerebral Vascular Stent Industry Revenue Share (%), by End-User 2025 & 2033
- Figure 30: Europe Cerebral Vascular Stent Industry Volume Share (%), by End-User 2025 & 2033
- Figure 31: Europe Cerebral Vascular Stent Industry Revenue (billion), by Country 2025 & 2033
- Figure 32: Europe Cerebral Vascular Stent Industry Volume (K Unit), by Country 2025 & 2033
- Figure 33: Europe Cerebral Vascular Stent Industry Revenue Share (%), by Country 2025 & 2033
- Figure 34: Europe Cerebral Vascular Stent Industry Volume Share (%), by Country 2025 & 2033
- Figure 35: Asia Pacific Cerebral Vascular Stent Industry Revenue (billion), by Type 2025 & 2033
- Figure 36: Asia Pacific Cerebral Vascular Stent Industry Volume (K Unit), by Type 2025 & 2033
- Figure 37: Asia Pacific Cerebral Vascular Stent Industry Revenue Share (%), by Type 2025 & 2033
- Figure 38: Asia Pacific Cerebral Vascular Stent Industry Volume Share (%), by Type 2025 & 2033
- Figure 39: Asia Pacific Cerebral Vascular Stent Industry Revenue (billion), by Application 2025 & 2033
- Figure 40: Asia Pacific Cerebral Vascular Stent Industry Volume (K Unit), by Application 2025 & 2033
- Figure 41: Asia Pacific Cerebral Vascular Stent Industry Revenue Share (%), by Application 2025 & 2033
- Figure 42: Asia Pacific Cerebral Vascular Stent Industry Volume Share (%), by Application 2025 & 2033
- Figure 43: Asia Pacific Cerebral Vascular Stent Industry Revenue (billion), by End-User 2025 & 2033
- Figure 44: Asia Pacific Cerebral Vascular Stent Industry Volume (K Unit), by End-User 2025 & 2033
- Figure 45: Asia Pacific Cerebral Vascular Stent Industry Revenue Share (%), by End-User 2025 & 2033
- Figure 46: Asia Pacific Cerebral Vascular Stent Industry Volume Share (%), by End-User 2025 & 2033
- Figure 47: Asia Pacific Cerebral Vascular Stent Industry Revenue (billion), by Country 2025 & 2033
- Figure 48: Asia Pacific Cerebral Vascular Stent Industry Volume (K Unit), by Country 2025 & 2033
- Figure 49: Asia Pacific Cerebral Vascular Stent Industry Revenue Share (%), by Country 2025 & 2033
- Figure 50: Asia Pacific Cerebral Vascular Stent Industry Volume Share (%), by Country 2025 & 2033
- Figure 51: Middle East and Africa Cerebral Vascular Stent Industry Revenue (billion), by Type 2025 & 2033
- Figure 52: Middle East and Africa Cerebral Vascular Stent Industry Volume (K Unit), by Type 2025 & 2033
- Figure 53: Middle East and Africa Cerebral Vascular Stent Industry Revenue Share (%), by Type 2025 & 2033
- Figure 54: Middle East and Africa Cerebral Vascular Stent Industry Volume Share (%), by Type 2025 & 2033
- Figure 55: Middle East and Africa Cerebral Vascular Stent Industry Revenue (billion), by Application 2025 & 2033
- Figure 56: Middle East and Africa Cerebral Vascular Stent Industry Volume (K Unit), by Application 2025 & 2033
- Figure 57: Middle East and Africa Cerebral Vascular Stent Industry Revenue Share (%), by Application 2025 & 2033
- Figure 58: Middle East and Africa Cerebral Vascular Stent Industry Volume Share (%), by Application 2025 & 2033
- Figure 59: Middle East and Africa Cerebral Vascular Stent Industry Revenue (billion), by End-User 2025 & 2033
- Figure 60: Middle East and Africa Cerebral Vascular Stent Industry Volume (K Unit), by End-User 2025 & 2033
- Figure 61: Middle East and Africa Cerebral Vascular Stent Industry Revenue Share (%), by End-User 2025 & 2033
- Figure 62: Middle East and Africa Cerebral Vascular Stent Industry Volume Share (%), by End-User 2025 & 2033
- Figure 63: Middle East and Africa Cerebral Vascular Stent Industry Revenue (billion), by Country 2025 & 2033
- Figure 64: Middle East and Africa Cerebral Vascular Stent Industry Volume (K Unit), by Country 2025 & 2033
- Figure 65: Middle East and Africa Cerebral Vascular Stent Industry Revenue Share (%), by Country 2025 & 2033
- Figure 66: Middle East and Africa Cerebral Vascular Stent Industry Volume Share (%), by Country 2025 & 2033
- Figure 67: South America Cerebral Vascular Stent Industry Revenue (billion), by Type 2025 & 2033
- Figure 68: South America Cerebral Vascular Stent Industry Volume (K Unit), by Type 2025 & 2033
- Figure 69: South America Cerebral Vascular Stent Industry Revenue Share (%), by Type 2025 & 2033
- Figure 70: South America Cerebral Vascular Stent Industry Volume Share (%), by Type 2025 & 2033
- Figure 71: South America Cerebral Vascular Stent Industry Revenue (billion), by Application 2025 & 2033
- Figure 72: South America Cerebral Vascular Stent Industry Volume (K Unit), by Application 2025 & 2033
- Figure 73: South America Cerebral Vascular Stent Industry Revenue Share (%), by Application 2025 & 2033
- Figure 74: South America Cerebral Vascular Stent Industry Volume Share (%), by Application 2025 & 2033
- Figure 75: South America Cerebral Vascular Stent Industry Revenue (billion), by End-User 2025 & 2033
- Figure 76: South America Cerebral Vascular Stent Industry Volume (K Unit), by End-User 2025 & 2033
- Figure 77: South America Cerebral Vascular Stent Industry Revenue Share (%), by End-User 2025 & 2033
- Figure 78: South America Cerebral Vascular Stent Industry Volume Share (%), by End-User 2025 & 2033
- Figure 79: South America Cerebral Vascular Stent Industry Revenue (billion), by Country 2025 & 2033
- Figure 80: South America Cerebral Vascular Stent Industry Volume (K Unit), by Country 2025 & 2033
- Figure 81: South America Cerebral Vascular Stent Industry Revenue Share (%), by Country 2025 & 2033
- Figure 82: South America Cerebral Vascular Stent Industry Volume Share (%), by Country 2025 & 2033
List of Tables
- Table 1: Global Cerebral Vascular Stent Industry Revenue billion Forecast, by Type 2020 & 2033
- Table 2: Global Cerebral Vascular Stent Industry Volume K Unit Forecast, by Type 2020 & 2033
- Table 3: Global Cerebral Vascular Stent Industry Revenue billion Forecast, by Application 2020 & 2033
- Table 4: Global Cerebral Vascular Stent Industry Volume K Unit Forecast, by Application 2020 & 2033
- Table 5: Global Cerebral Vascular Stent Industry Revenue billion Forecast, by End-User 2020 & 2033
- Table 6: Global Cerebral Vascular Stent Industry Volume K Unit Forecast, by End-User 2020 & 2033
- Table 7: Global Cerebral Vascular Stent Industry Revenue billion Forecast, by Region 2020 & 2033
- Table 8: Global Cerebral Vascular Stent Industry Volume K Unit Forecast, by Region 2020 & 2033
- Table 9: Global Cerebral Vascular Stent Industry Revenue billion Forecast, by Type 2020 & 2033
- Table 10: Global Cerebral Vascular Stent Industry Volume K Unit Forecast, by Type 2020 & 2033
- Table 11: Global Cerebral Vascular Stent Industry Revenue billion Forecast, by Application 2020 & 2033
- Table 12: Global Cerebral Vascular Stent Industry Volume K Unit Forecast, by Application 2020 & 2033
- Table 13: Global Cerebral Vascular Stent Industry Revenue billion Forecast, by End-User 2020 & 2033
- Table 14: Global Cerebral Vascular Stent Industry Volume K Unit Forecast, by End-User 2020 & 2033
- Table 15: Global Cerebral Vascular Stent Industry Revenue billion Forecast, by Country 2020 & 2033
- Table 16: Global Cerebral Vascular Stent Industry Volume K Unit Forecast, by Country 2020 & 2033
- Table 17: United States Cerebral Vascular Stent Industry Revenue (billion) Forecast, by Application 2020 & 2033
- Table 18: United States Cerebral Vascular Stent Industry Volume (K Unit) Forecast, by Application 2020 & 2033
- Table 19: Canada Cerebral Vascular Stent Industry Revenue (billion) Forecast, by Application 2020 & 2033
- Table 20: Canada Cerebral Vascular Stent Industry Volume (K Unit) Forecast, by Application 2020 & 2033
- Table 21: Mexico Cerebral Vascular Stent Industry Revenue (billion) Forecast, by Application 2020 & 2033
- Table 22: Mexico Cerebral Vascular Stent Industry Volume (K Unit) Forecast, by Application 2020 & 2033
- Table 23: Global Cerebral Vascular Stent Industry Revenue billion Forecast, by Type 2020 & 2033
- Table 24: Global Cerebral Vascular Stent Industry Volume K Unit Forecast, by Type 2020 & 2033
- Table 25: Global Cerebral Vascular Stent Industry Revenue billion Forecast, by Application 2020 & 2033
- Table 26: Global Cerebral Vascular Stent Industry Volume K Unit Forecast, by Application 2020 & 2033
- Table 27: Global Cerebral Vascular Stent Industry Revenue billion Forecast, by End-User 2020 & 2033
- Table 28: Global Cerebral Vascular Stent Industry Volume K Unit Forecast, by End-User 2020 & 2033
- Table 29: Global Cerebral Vascular Stent Industry Revenue billion Forecast, by Country 2020 & 2033
- Table 30: Global Cerebral Vascular Stent Industry Volume K Unit Forecast, by Country 2020 & 2033
- Table 31: Germany Cerebral Vascular Stent Industry Revenue (billion) Forecast, by Application 2020 & 2033
- Table 32: Germany Cerebral Vascular Stent Industry Volume (K Unit) Forecast, by Application 2020 & 2033
- Table 33: United Kingdom Cerebral Vascular Stent Industry Revenue (billion) Forecast, by Application 2020 & 2033
- Table 34: United Kingdom Cerebral Vascular Stent Industry Volume (K Unit) Forecast, by Application 2020 & 2033
- Table 35: France Cerebral Vascular Stent Industry Revenue (billion) Forecast, by Application 2020 & 2033
- Table 36: France Cerebral Vascular Stent Industry Volume (K Unit) Forecast, by Application 2020 & 2033
- Table 37: Italy Cerebral Vascular Stent Industry Revenue (billion) Forecast, by Application 2020 & 2033
- Table 38: Italy Cerebral Vascular Stent Industry Volume (K Unit) Forecast, by Application 2020 & 2033
- Table 39: Spain Cerebral Vascular Stent Industry Revenue (billion) Forecast, by Application 2020 & 2033
- Table 40: Spain Cerebral Vascular Stent Industry Volume (K Unit) Forecast, by Application 2020 & 2033
- Table 41: Rest of Europe Cerebral Vascular Stent Industry Revenue (billion) Forecast, by Application 2020 & 2033
- Table 42: Rest of Europe Cerebral Vascular Stent Industry Volume (K Unit) Forecast, by Application 2020 & 2033
- Table 43: Global Cerebral Vascular Stent Industry Revenue billion Forecast, by Type 2020 & 2033
- Table 44: Global Cerebral Vascular Stent Industry Volume K Unit Forecast, by Type 2020 & 2033
- Table 45: Global Cerebral Vascular Stent Industry Revenue billion Forecast, by Application 2020 & 2033
- Table 46: Global Cerebral Vascular Stent Industry Volume K Unit Forecast, by Application 2020 & 2033
- Table 47: Global Cerebral Vascular Stent Industry Revenue billion Forecast, by End-User 2020 & 2033
- Table 48: Global Cerebral Vascular Stent Industry Volume K Unit Forecast, by End-User 2020 & 2033
- Table 49: Global Cerebral Vascular Stent Industry Revenue billion Forecast, by Country 2020 & 2033
- Table 50: Global Cerebral Vascular Stent Industry Volume K Unit Forecast, by Country 2020 & 2033
- Table 51: China Cerebral Vascular Stent Industry Revenue (billion) Forecast, by Application 2020 & 2033
- Table 52: China Cerebral Vascular Stent Industry Volume (K Unit) Forecast, by Application 2020 & 2033
- Table 53: Japan Cerebral Vascular Stent Industry Revenue (billion) Forecast, by Application 2020 & 2033
- Table 54: Japan Cerebral Vascular Stent Industry Volume (K Unit) Forecast, by Application 2020 & 2033
- Table 55: India Cerebral Vascular Stent Industry Revenue (billion) Forecast, by Application 2020 & 2033
- Table 56: India Cerebral Vascular Stent Industry Volume (K Unit) Forecast, by Application 2020 & 2033
- Table 57: Australia Cerebral Vascular Stent Industry Revenue (billion) Forecast, by Application 2020 & 2033
- Table 58: Australia Cerebral Vascular Stent Industry Volume (K Unit) Forecast, by Application 2020 & 2033
- Table 59: South Korea Cerebral Vascular Stent Industry Revenue (billion) Forecast, by Application 2020 & 2033
- Table 60: South Korea Cerebral Vascular Stent Industry Volume (K Unit) Forecast, by Application 2020 & 2033
- Table 61: Rest of Asia Pacific Cerebral Vascular Stent Industry Revenue (billion) Forecast, by Application 2020 & 2033
- Table 62: Rest of Asia Pacific Cerebral Vascular Stent Industry Volume (K Unit) Forecast, by Application 2020 & 2033
- Table 63: Global Cerebral Vascular Stent Industry Revenue billion Forecast, by Type 2020 & 2033
- Table 64: Global Cerebral Vascular Stent Industry Volume K Unit Forecast, by Type 2020 & 2033
- Table 65: Global Cerebral Vascular Stent Industry Revenue billion Forecast, by Application 2020 & 2033
- Table 66: Global Cerebral Vascular Stent Industry Volume K Unit Forecast, by Application 2020 & 2033
- Table 67: Global Cerebral Vascular Stent Industry Revenue billion Forecast, by End-User 2020 & 2033
- Table 68: Global Cerebral Vascular Stent Industry Volume K Unit Forecast, by End-User 2020 & 2033
- Table 69: Global Cerebral Vascular Stent Industry Revenue billion Forecast, by Country 2020 & 2033
- Table 70: Global Cerebral Vascular Stent Industry Volume K Unit Forecast, by Country 2020 & 2033
- Table 71: GCC Cerebral Vascular Stent Industry Revenue (billion) Forecast, by Application 2020 & 2033
- Table 72: GCC Cerebral Vascular Stent Industry Volume (K Unit) Forecast, by Application 2020 & 2033
- Table 73: South Africa Cerebral Vascular Stent Industry Revenue (billion) Forecast, by Application 2020 & 2033
- Table 74: South Africa Cerebral Vascular Stent Industry Volume (K Unit) Forecast, by Application 2020 & 2033
- Table 75: Rest of Middle East and Africa Cerebral Vascular Stent Industry Revenue (billion) Forecast, by Application 2020 & 2033
- Table 76: Rest of Middle East and Africa Cerebral Vascular Stent Industry Volume (K Unit) Forecast, by Application 2020 & 2033
- Table 77: Global Cerebral Vascular Stent Industry Revenue billion Forecast, by Type 2020 & 2033
- Table 78: Global Cerebral Vascular Stent Industry Volume K Unit Forecast, by Type 2020 & 2033
- Table 79: Global Cerebral Vascular Stent Industry Revenue billion Forecast, by Application 2020 & 2033
- Table 80: Global Cerebral Vascular Stent Industry Volume K Unit Forecast, by Application 2020 & 2033
- Table 81: Global Cerebral Vascular Stent Industry Revenue billion Forecast, by End-User 2020 & 2033
- Table 82: Global Cerebral Vascular Stent Industry Volume K Unit Forecast, by End-User 2020 & 2033
- Table 83: Global Cerebral Vascular Stent Industry Revenue billion Forecast, by Country 2020 & 2033
- Table 84: Global Cerebral Vascular Stent Industry Volume K Unit Forecast, by Country 2020 & 2033
- Table 85: Brazil Cerebral Vascular Stent Industry Revenue (billion) Forecast, by Application 2020 & 2033
- Table 86: Brazil Cerebral Vascular Stent Industry Volume (K Unit) Forecast, by Application 2020 & 2033
- Table 87: Argentina Cerebral Vascular Stent Industry Revenue (billion) Forecast, by Application 2020 & 2033
- Table 88: Argentina Cerebral Vascular Stent Industry Volume (K Unit) Forecast, by Application 2020 & 2033
- Table 89: Rest of South America Cerebral Vascular Stent Industry Revenue (billion) Forecast, by Application 2020 & 2033
- Table 90: Rest of South America Cerebral Vascular Stent Industry Volume (K Unit) Forecast, by Application 2020 & 2033
Frequently Asked Questions
1. What is the projected Compound Annual Growth Rate (CAGR) of the Cerebral Vascular Stent Industry?
The projected CAGR is approximately 7%.
2. Which companies are prominent players in the Cerebral Vascular Stent Industry?
Key companies in the market include Acandis GmbH, phenox GmbH, Cook Group, MicroPort Scientific, Balt Extrusion, Terumo Corporation, Johnson & Johnson Services Inc, Medtronic Plc, MicroPort Scientific Corporation, Stryker Corporation, Boston Scientific Corporation, Penumbra Inc.
3. What are the main segments of the Cerebral Vascular Stent Industry?
The market segments include Type, Application, End-User.
4. Can you provide details about the market size?
The market size is estimated to be USD 1.5 billion as of 2022.
5. What are some drivers contributing to market growth?
Increasing Demand for Minimally Invasive Intracranial Surgeries; Rising Prevalence of Stroke and Increasing Geriatric population.
6. What are the notable trends driving market growth?
Brain Aneurysm Segment Expects to Register a Highest CAGR Over the Forecast Period.
7. Are there any restraints impacting market growth?
Lack of Skilled Professional for Operating using Intracranial Stents; Cerebrovascular Complications Related to Intracranial Stenting.
8. Can you provide examples of recent developments in the market?
In September 2022, Wallaby/phenox launched a pEGASUS HPC stent with an anti-thrombogenic HPC coating technology, indicated for patients with intracranial aneurysms as well as stenoses in intracranial atherosclerotic disease (ICAD) patients, at the ESMINT 2022 congress in France.
9. What pricing options are available for accessing the report?
Pricing options include single-user, multi-user, and enterprise licenses priced at USD 4750, USD 5250, and USD 8750 respectively.
10. Is the market size provided in terms of value or volume?
The market size is provided in terms of value, measured in billion and volume, measured in K Unit.
11. Are there any specific market keywords associated with the report?
Yes, the market keyword associated with the report is "Cerebral Vascular Stent Industry," which aids in identifying and referencing the specific market segment covered.
12. How do I determine which pricing option suits my needs best?
The pricing options vary based on user requirements and access needs. Individual users may opt for single-user licenses, while businesses requiring broader access may choose multi-user or enterprise licenses for cost-effective access to the report.
13. Are there any additional resources or data provided in the Cerebral Vascular Stent Industry report?
While the report offers comprehensive insights, it's advisable to review the specific contents or supplementary materials provided to ascertain if additional resources or data are available.
14. How can I stay updated on further developments or reports in the Cerebral Vascular Stent Industry?
To stay informed about further developments, trends, and reports in the Cerebral Vascular Stent Industry, consider subscribing to industry newsletters, following relevant companies and organizations, or regularly checking reputable industry news sources and publications.
Methodology
Step 1 - Identification of Relevant Samples Size from Population Database


Step 2 - Approaches for Defining Global Market Size (Value, Volume* & Price*)

Note*: In applicable scenarios
Step 3 - Data Sources
Primary Research
- Web Analytics
- Survey Reports
- Research Institute
- Latest Research Reports
- Opinion Leaders
Secondary Research
- Annual Reports
- White Paper
- Latest Press Release
- Industry Association
- Paid Database
- Investor Presentations

Step 4 - Data Triangulation
Involves using different sources of information in order to increase the validity of a study
These sources are likely to be stakeholders in a program - participants, other researchers, program staff, other community members, and so on.
Then we put all data in single framework & apply various statistical tools to find out the dynamic on the market.
During the analysis stage, feedback from the stakeholder groups would be compared to determine areas of agreement as well as areas of divergence