

Key Insights
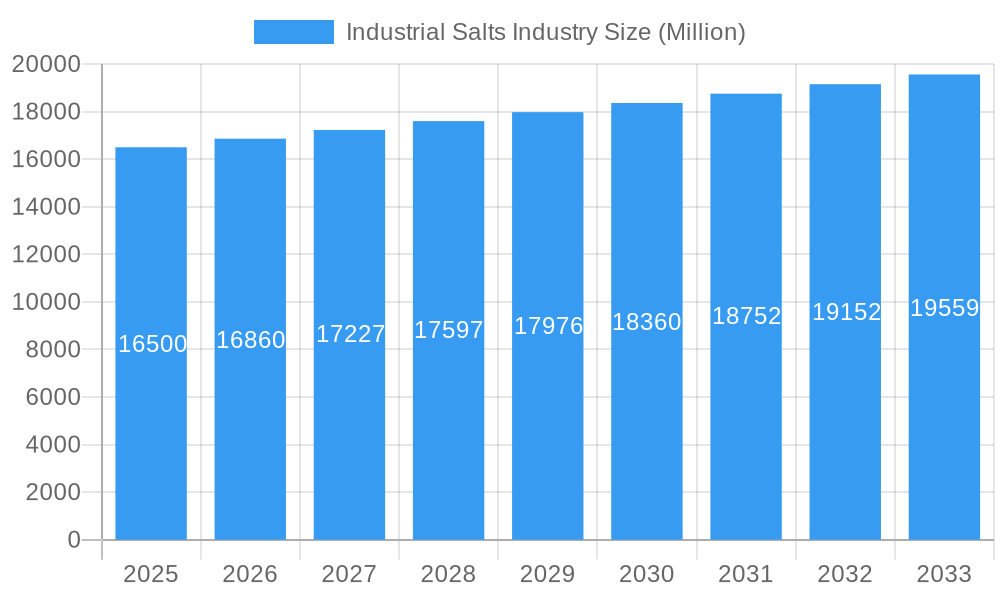
The global Industrial Salts market is projected for robust expansion, forecasting a market size of 238.55 million by the base year 2025, with a Compound Annual Growth Rate (CAGR) of 2.2% through 2033. Key growth drivers include escalating demand from the chemical processing sector, where industrial salts are crucial feedstocks for essential chemicals. Growing requirements for water treatment and consistent demand from de-icing and agricultural applications further propel market growth. Emerging economies, particularly in Asia Pacific, present significant expansion opportunities due to rapid industrialization.
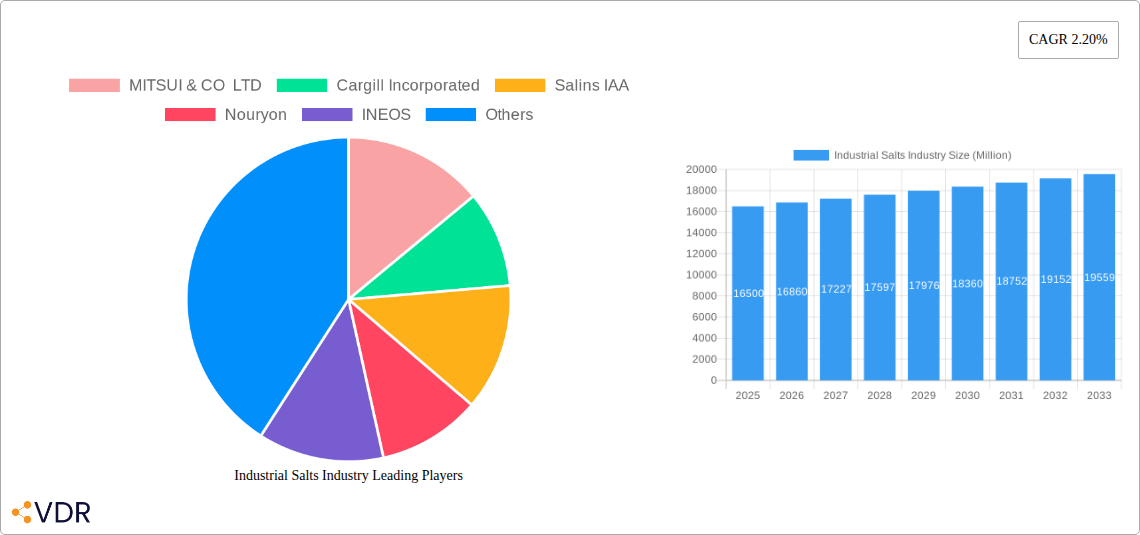
Industrial Salts Industry Market Size (In Million)
The market utilizes diverse extraction methods from rock salt and natural brine. Leading entities like MITSUI & CO LTD, Cargill Incorporated, and Nouryon are focused on production capacity enhancement and supply chain optimization. Potential restraints include raw material price volatility, environmental regulations, and logistical challenges. However, technological innovations in extraction and purification, alongside new applications in the oil and gas sector, are expected to mitigate these challenges. The forecast period (2025-2033) indicates a sustained upward trend, highlighting the vital role of industrial salts across critical global industries.
Industrial Salts Industry Company Market Share
Industrial Salts Industry Report: Market Size, Trends, and Forecast (2019-2033)
This comprehensive report provides an in-depth analysis of the global industrial salts market, offering critical insights into its dynamics, growth trajectory, and future potential. Covering the historical period from 2019-2024, a base year of 2025, and a robust forecast period extending to 2033, this report is an essential resource for industry professionals seeking to understand market concentration, technological advancements, regulatory influences, and competitive landscapes. With a focus on both parent and child markets, this report delivers a holistic view of the industrial salts sector, essential for strategic decision-making and investment planning. All values are presented in Million units for clarity and actionable insights.
Industrial Salts Industry Market Dynamics & Structure
The industrial salts market exhibits a moderately concentrated structure, with key players like MITSUI & CO LTD, Cargill Incorporated, and K+S Aktiengesellschaft holding significant market shares. Technological innovation is primarily driven by advancements in extraction and purification processes, aiming for higher purity and specialized salt grades for diverse applications. Regulatory frameworks, particularly concerning environmental impact and product safety, play a crucial role in shaping manufacturing practices and market access. Competitive product substitutes are limited for many core industrial salt applications, but niche markets may see competition from alternative chemicals. End-user demographics are broad, spanning chemical manufacturing, water treatment facilities, municipalities for de-icing, agricultural cooperatives, food processing companies, and the oil and gas sector. Mergers and acquisitions (M&A) are a notable trend, with companies seeking to expand their production capacity, geographical reach, and product portfolios. For instance, the intended acquisition of Archean Group's industrial salt unit by Tata Chemicals Ltd in January 2021 underscores this consolidation drive. Barriers to innovation can include high capital investment for advanced extraction technologies and the stringent quality control required for certain industrial applications.
- Market Concentration: Moderate, with a few dominant global players.
- Technological Drivers: Enhanced purity, energy-efficient extraction, and specialized product development.
- Regulatory Influence: Environmental regulations, product safety standards, and international trade policies.
- Competitive Substitutes: Limited for core applications, but emerging alternatives in specific niches.
- End-User Base: Diverse, including chemical processing, water treatment, agriculture, food, and energy sectors.
- M&A Activity: Strategic acquisitions and partnerships aimed at market expansion and capacity building.
Industrial Salts Industry Growth Trends & Insights
The industrial salts market is poised for steady growth, driven by increasing demand across its diverse application spectrum. The market size is projected to expand from an estimated $XX Million in 2025 to $XX Million by 2033, exhibiting a Compound Annual Growth Rate (CAGR) of XX% during the forecast period. Adoption rates for specialized industrial salt grades are rising as industries seek enhanced performance and efficiency in their processes. Technological disruptions, such as advancements in brine extraction and solar evaporation techniques, are improving production efficiency and reducing environmental footprints. Consumer behavior shifts are indirectly influencing the market through increased demand for purified water, processed foods, and sustainable agricultural practices, all of which rely on industrial salts. Market penetration is deepening across developing economies as industrialization accelerates.
- Market Size Evolution: Projected growth from an estimated $XX Million in 2025 to $XX Million by 2033.
- CAGR: XX% during the forecast period (2025–2033).
- Adoption Rates: Increasing for specialized and high-purity industrial salts.
- Technological Disruptions: Innovations in extraction, purification, and sustainable production methods.
- Consumer Behavior Shifts: Indirect influence through demand for related end-products and services.
- Market Penetration: Expanding into emerging economies and new application areas.
Dominant Regions, Countries, or Segments in Industrial Salts Industry
The Chemical Processing application segment is a significant driver of growth and dominance within the global industrial salts market. This segment's expansive use of various salt types as feedstock, catalysts, and processing agents in the production of numerous chemicals, including chlorine, caustic soda, and soda ash, underpins its substantial market share. Regions with robust chemical manufacturing bases, such as North America and Europe, along with the rapidly industrializing Asia Pacific, are leading the demand for industrial salts in this application. The reliance on industrial salts for essential chemical production ensures a consistent and growing demand.
- Dominant Application Segment: Chemical Processing, accounting for a significant portion of market demand.
- Key Drivers for Chemical Processing: Use as feedstock and processing agents in the production of essential chemicals.
- Leading Regions: North America, Europe, and Asia Pacific, driven by their strong chemical manufacturing industries.
- Market Share: The Chemical Processing segment holds a substantial market share, estimated at XX% in 2025.
- Growth Potential: Continued industrial expansion and increasing demand for chemical derivatives will sustain growth.
- Dominant Source: While various sources are utilized, Natural Brine often offers cost-effective and high-purity salt for chemical processes when available in abundant quantities.
- Dominant Manufacturing Process: Solar Evaporation remains a cost-effective and widely adopted method, particularly in regions with favorable climatic conditions, contributing significantly to the supply for chemical processing. However, Vacuum Evaporation is increasingly employed for higher purity requirements.
- Country-Specific Dominance: Countries with extensive chemical industries and access to salt resources, such as the United States, China, and Germany, are key players in consumption.
Industrial Salts Industry Product Landscape
The industrial salts market offers a diverse product landscape, ranging from basic rock salt and natural brine-derived salts to highly purified vacuum-evaporated grades. Key product innovations focus on enhancing purity, particle size control, and specific chemical compositions to meet the stringent requirements of specialized applications. For instance, advancements in purification technologies are yielding ultra-pure salts essential for electronics manufacturing and pharmaceutical intermediates. Unique selling propositions include tailor-made salt blends for specific industrial processes, improved handling characteristics, and environmentally friendly production methods. Technological advancements are continuously refining the production of salts for de-icing, water treatment, and agricultural nutrient applications, ensuring optimal performance and efficiency.
Key Drivers, Barriers & Challenges in Industrial Salts Industry
The industrial salts market is propelled by several key drivers, including the growing global demand for chemicals, increasing urbanization leading to higher de-icing salt requirements, and the expanding need for water treatment solutions. The agricultural sector's reliance on salt for animal feed and soil enrichment also contributes significantly.
- Key Drivers:
- Robust growth in the chemical industry.
- Increasing infrastructure development and de-icing needs.
- Rising demand for purified water and wastewater treatment.
- Expansion of the food processing sector.
However, the industry faces significant barriers and challenges. Fluctuations in energy prices can impact production costs, particularly for vacuum evaporation. Stringent environmental regulations regarding mining and water discharge can increase operational expenses. Supply chain disruptions, geopolitical factors, and the logistical challenges of transporting bulk commodities also pose considerable restraints.
- Barriers & Challenges:
- Volatile energy prices impacting production costs.
- Strict environmental regulations and compliance costs.
- Supply chain vulnerabilities and logistical complexities.
- Geopolitical instability affecting global trade.
- Intense competition leading to price pressures.
Emerging Opportunities in Industrial Salts Industry
Emerging opportunities in the industrial salts market are largely centered on the development of higher-value, specialty salt products and the expansion into untapped geographical markets. The increasing focus on sustainable agriculture and the demand for specialty fertilizers present a significant growth avenue. Furthermore, advancements in membrane technologies and the growing demand for high-purity salts in the electronics and pharmaceutical industries offer substantial untapped potential. The development of eco-friendly salt production methods, such as enhanced solar evaporation techniques with reduced water footprint, also presents a promising opportunity.
- Specialty Salt Products: Growing demand for high-purity and customized salt grades.
- Untapped Markets: Expansion into developing economies with nascent industrial sectors.
- Sustainable Agriculture: Opportunities in specialty fertilizers and soil conditioners.
- Eco-Friendly Production: Innovation in sustainable extraction and purification processes.
Growth Accelerators in the Industrial Salts Industry Industry
Several catalysts are accelerating the long-term growth of the industrial salts industry. Technological breakthroughs in mineral extraction and purification are enabling more efficient and cost-effective production of high-purity salts. Strategic partnerships between salt producers and major industrial consumers, such as chemical manufacturers and municipalities, are ensuring stable demand and fostering innovation. Market expansion strategies, including the development of new export markets and the diversification of product applications, are further fueling growth. The increasing adoption of advanced automation and digital technologies in salt production facilities is also contributing to improved operational efficiency and output.
Key Players Shaping the Industrial Salts Industry Market
- MITSUI & CO LTD
- Cargill Incorporated
- Salins IAA
- Nouryon
- INEOS
- Tata Chemicals Ltd
- Archean Group
- Donald Brown Group
- Rio Tinto
- Delmon Group of Companies
- K+S Aktiengesellschaft
- Morton Salt Inc
- Exportadora de Sal de CV
- Compass Minerals
- Dominion Salt Limited
Notable Milestones in Industrial Salts Industry Sector
- January 2021: Tata Chemicals Ltd intended to acquire the industrial salt unit with an annual production capacity of 3 million tons of Archean Group, a move expected to significantly enhance the company's business and market position.
- June 2018: Ajax Equipment supplied a new salt handling system to optimize salt tablet production at the Runcorn facility of INEOS. This system, comprising two screw conveyors and a screw feeder, enhanced efficiency for INEOS Salt, which produces up to 500 kilotons of salt annually for food, water softening, animal feed, industrial, chemical, and de-icing applications.
In-Depth Industrial Salts Industry Market Outlook
The future outlook for the industrial salts market is characterized by sustained growth driven by a confluence of factors. The increasing global demand for essential chemicals will continue to underpin the growth of the chemical processing segment. Furthermore, the rising urbanization and the imperative for robust infrastructure will maintain a strong demand for de-icing salts. The continuous need for clean water resources worldwide will fuel the expansion of the water treatment application. Emerging economies are expected to represent significant growth opportunities as their industrial sectors mature and expand. Strategic investments in advanced extraction and purification technologies, coupled with a growing emphasis on sustainability and eco-friendly production methods, will shape the competitive landscape. The market is poised for continued innovation, with a focus on developing higher-value, specialized salt products to cater to evolving industry needs.
Industrial Salts Industry Segmentation
-
1. Source
- 1.1. Rock Salt
- 1.2. Natural Brine
-
2. Manufacturing Process
- 2.1. Solar Evaporation
- 2.2. Vacuum Evaporation
- 2.3. Conventional Mining
-
3. Application
- 3.1. Chemical Processing
- 3.2. Water Treatment
- 3.3. De-icing
- 3.4. Agriculture
- 3.5. Food Processing
- 3.6. Oil and Gas
- 3.7. Other Applications
Industrial Salts Industry Segmentation By Geography
-
1. Asia Pacific
- 1.1. China
- 1.2. India
- 1.3. Japan
- 1.4. South Korea
- 1.5. Rest of Asia Pacific
-
2. North America
- 2.1. United States
- 2.2. Canada
- 2.3. Mexico
-
3. Europe
- 3.1. Germany
- 3.2. United Kingdom
- 3.3. France
- 3.4. Italy
- 3.5. Rest of Europe
-
4. South America
- 4.1. Brazil
- 4.2. Argentina
- 4.3. Rest of South America
-
5. Middle East and Africa
- 5.1. Saudi Arabia
- 5.2. South Africa
- 5.3. Rest of Middle East and Africa
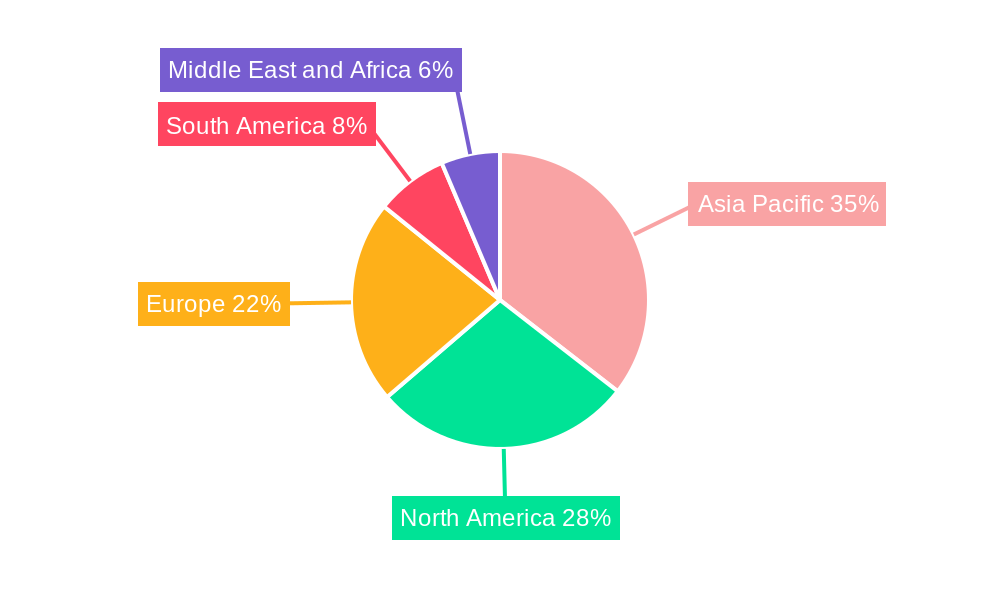
Industrial Salts Industry Regional Market Share
Geographic Coverage of Industrial Salts Industry
Industrial Salts Industry REPORT HIGHLIGHTS
| Aspects | Details |
|---|---|
| Study Period | 2020-2034 |
| Base Year | 2025 |
| Estimated Year | 2026 |
| Forecast Period | 2026-2034 |
| Historical Period | 2020-2025 |
| Growth Rate | CAGR of 2.2% from 2020-2034 |
| Segmentation |
|
Table of Contents
- 1. Introduction
- 1.1. Research Scope
- 1.2. Market Segmentation
- 1.3. Research Objective
- 1.4. Definitions and Assumptions
- 2. Executive Summary
- 2.1. Market Snapshot
- 3. Market Dynamics
- 3.1. Market Drivers
- 3.2. Market Restrains
- 3.3. Market Trends
- 3.4. Market Opportunities
- 4. Market Factor Analysis
- 4.1. Porters Five Forces
- 4.1.1. Bargaining Power of Suppliers
- 4.1.2. Bargaining Power of Buyers
- 4.1.3. Threat of New Entrants
- 4.1.4. Threat of Substitutes
- 4.1.5. Competitive Rivalry
- 4.2. PESTEL analysis
- 4.3. BCG Analysis
- 4.3.1. Stars (High Growth, High Market Share)
- 4.3.2. Cash Cows (Low Growth, High Market Share)
- 4.3.3. Question Mark (High Growth, Low Market Share)
- 4.3.4. Dogs (Low Growth, Low Market Share)
- 4.4. Ansoff Matrix Analysis
- 4.5. Supply Chain Analysis
- 4.6. Regulatory Landscape
- 4.7. Current Market Potential and Opportunity Assessment (TAM–SAM–SOM Framework)
- 4.8. VDR Analyst Note
- 4.1. Porters Five Forces
- 5. Market Analysis, Insights and Forecast 2021-2033
- 5.1. Market Analysis, Insights and Forecast - by Source
- 5.1.1. Rock Salt
- 5.1.2. Natural Brine
- 5.2. Market Analysis, Insights and Forecast - by Manufacturing Process
- 5.2.1. Solar Evaporation
- 5.2.2. Vacuum Evaporation
- 5.2.3. Conventional Mining
- 5.3. Market Analysis, Insights and Forecast - by Application
- 5.3.1. Chemical Processing
- 5.3.2. Water Treatment
- 5.3.3. De-icing
- 5.3.4. Agriculture
- 5.3.5. Food Processing
- 5.3.6. Oil and Gas
- 5.3.7. Other Applications
- 5.4. Market Analysis, Insights and Forecast - by Region
- 5.4.1. Asia Pacific
- 5.4.2. North America
- 5.4.3. Europe
- 5.4.4. South America
- 5.4.5. Middle East and Africa
- 5.1. Market Analysis, Insights and Forecast - by Source
- 6. Global Industrial Salts Industry Analysis, Insights and Forecast, 2021-2033
- 6.1. Market Analysis, Insights and Forecast - by Source
- 6.1.1. Rock Salt
- 6.1.2. Natural Brine
- 6.2. Market Analysis, Insights and Forecast - by Manufacturing Process
- 6.2.1. Solar Evaporation
- 6.2.2. Vacuum Evaporation
- 6.2.3. Conventional Mining
- 6.3. Market Analysis, Insights and Forecast - by Application
- 6.3.1. Chemical Processing
- 6.3.2. Water Treatment
- 6.3.3. De-icing
- 6.3.4. Agriculture
- 6.3.5. Food Processing
- 6.3.6. Oil and Gas
- 6.3.7. Other Applications
- 6.1. Market Analysis, Insights and Forecast - by Source
- 7. Asia Pacific Industrial Salts Industry Analysis, Insights and Forecast, 2021-2033
- 7.1. Market Analysis, Insights and Forecast - by Source
- 7.1.1. Rock Salt
- 7.1.2. Natural Brine
- 7.2. Market Analysis, Insights and Forecast - by Manufacturing Process
- 7.2.1. Solar Evaporation
- 7.2.2. Vacuum Evaporation
- 7.2.3. Conventional Mining
- 7.3. Market Analysis, Insights and Forecast - by Application
- 7.3.1. Chemical Processing
- 7.3.2. Water Treatment
- 7.3.3. De-icing
- 7.3.4. Agriculture
- 7.3.5. Food Processing
- 7.3.6. Oil and Gas
- 7.3.7. Other Applications
- 7.1. Market Analysis, Insights and Forecast - by Source
- 8. North America Industrial Salts Industry Analysis, Insights and Forecast, 2021-2033
- 8.1. Market Analysis, Insights and Forecast - by Source
- 8.1.1. Rock Salt
- 8.1.2. Natural Brine
- 8.2. Market Analysis, Insights and Forecast - by Manufacturing Process
- 8.2.1. Solar Evaporation
- 8.2.2. Vacuum Evaporation
- 8.2.3. Conventional Mining
- 8.3. Market Analysis, Insights and Forecast - by Application
- 8.3.1. Chemical Processing
- 8.3.2. Water Treatment
- 8.3.3. De-icing
- 8.3.4. Agriculture
- 8.3.5. Food Processing
- 8.3.6. Oil and Gas
- 8.3.7. Other Applications
- 8.1. Market Analysis, Insights and Forecast - by Source
- 9. Europe Industrial Salts Industry Analysis, Insights and Forecast, 2021-2033
- 9.1. Market Analysis, Insights and Forecast - by Source
- 9.1.1. Rock Salt
- 9.1.2. Natural Brine
- 9.2. Market Analysis, Insights and Forecast - by Manufacturing Process
- 9.2.1. Solar Evaporation
- 9.2.2. Vacuum Evaporation
- 9.2.3. Conventional Mining
- 9.3. Market Analysis, Insights and Forecast - by Application
- 9.3.1. Chemical Processing
- 9.3.2. Water Treatment
- 9.3.3. De-icing
- 9.3.4. Agriculture
- 9.3.5. Food Processing
- 9.3.6. Oil and Gas
- 9.3.7. Other Applications
- 9.1. Market Analysis, Insights and Forecast - by Source
- 10. South America Industrial Salts Industry Analysis, Insights and Forecast, 2021-2033
- 10.1. Market Analysis, Insights and Forecast - by Source
- 10.1.1. Rock Salt
- 10.1.2. Natural Brine
- 10.2. Market Analysis, Insights and Forecast - by Manufacturing Process
- 10.2.1. Solar Evaporation
- 10.2.2. Vacuum Evaporation
- 10.2.3. Conventional Mining
- 10.3. Market Analysis, Insights and Forecast - by Application
- 10.3.1. Chemical Processing
- 10.3.2. Water Treatment
- 10.3.3. De-icing
- 10.3.4. Agriculture
- 10.3.5. Food Processing
- 10.3.6. Oil and Gas
- 10.3.7. Other Applications
- 10.1. Market Analysis, Insights and Forecast - by Source
- 11. Middle East and Africa Industrial Salts Industry Analysis, Insights and Forecast, 2021-2033
- 11.1. Market Analysis, Insights and Forecast - by Source
- 11.1.1. Rock Salt
- 11.1.2. Natural Brine
- 11.2. Market Analysis, Insights and Forecast - by Manufacturing Process
- 11.2.1. Solar Evaporation
- 11.2.2. Vacuum Evaporation
- 11.2.3. Conventional Mining
- 11.3. Market Analysis, Insights and Forecast - by Application
- 11.3.1. Chemical Processing
- 11.3.2. Water Treatment
- 11.3.3. De-icing
- 11.3.4. Agriculture
- 11.3.5. Food Processing
- 11.3.6. Oil and Gas
- 11.3.7. Other Applications
- 11.1. Market Analysis, Insights and Forecast - by Source
- 12. Competitive Analysis
- 12.1. Company Profiles
- 12.1.1 MITSUI & CO LTD
- 12.1.1.1. Company Overview
- 12.1.1.2. Products
- 12.1.1.3. Company Financials
- 12.1.1.4. SWOT Analysis
- 12.1.2 Cargill Incorporated
- 12.1.2.1. Company Overview
- 12.1.2.2. Products
- 12.1.2.3. Company Financials
- 12.1.2.4. SWOT Analysis
- 12.1.3 Salins IAA
- 12.1.3.1. Company Overview
- 12.1.3.2. Products
- 12.1.3.3. Company Financials
- 12.1.3.4. SWOT Analysis
- 12.1.4 Nouryon
- 12.1.4.1. Company Overview
- 12.1.4.2. Products
- 12.1.4.3. Company Financials
- 12.1.4.4. SWOT Analysis
- 12.1.5 INEOS
- 12.1.5.1. Company Overview
- 12.1.5.2. Products
- 12.1.5.3. Company Financials
- 12.1.5.4. SWOT Analysis
- 12.1.6 Tata Chemicals Ltd
- 12.1.6.1. Company Overview
- 12.1.6.2. Products
- 12.1.6.3. Company Financials
- 12.1.6.4. SWOT Analysis
- 12.1.7 Archean Group
- 12.1.7.1. Company Overview
- 12.1.7.2. Products
- 12.1.7.3. Company Financials
- 12.1.7.4. SWOT Analysis
- 12.1.8 Donald Brown Group
- 12.1.8.1. Company Overview
- 12.1.8.2. Products
- 12.1.8.3. Company Financials
- 12.1.8.4. SWOT Analysis
- 12.1.9 Rio Tinto
- 12.1.9.1. Company Overview
- 12.1.9.2. Products
- 12.1.9.3. Company Financials
- 12.1.9.4. SWOT Analysis
- 12.1.10 Delmon Group of Companies
- 12.1.10.1. Company Overview
- 12.1.10.2. Products
- 12.1.10.3. Company Financials
- 12.1.10.4. SWOT Analysis
- 12.1.11 K+S Aktiengesellschaft
- 12.1.11.1. Company Overview
- 12.1.11.2. Products
- 12.1.11.3. Company Financials
- 12.1.11.4. SWOT Analysis
- 12.1.12 Morton Salt Inc
- 12.1.12.1. Company Overview
- 12.1.12.2. Products
- 12.1.12.3. Company Financials
- 12.1.12.4. SWOT Analysis
- 12.1.13 Exportadora de Sal de CV
- 12.1.13.1. Company Overview
- 12.1.13.2. Products
- 12.1.13.3. Company Financials
- 12.1.13.4. SWOT Analysis
- 12.1.14 Compass Minerals
- 12.1.14.1. Company Overview
- 12.1.14.2. Products
- 12.1.14.3. Company Financials
- 12.1.14.4. SWOT Analysis
- 12.1.15 Dominion Salt Limited
- 12.1.15.1. Company Overview
- 12.1.15.2. Products
- 12.1.15.3. Company Financials
- 12.1.15.4. SWOT Analysis
- 12.1.1 MITSUI & CO LTD
- 12.2. Market Entropy
- 12.2.1 Company's Key Areas Served
- 12.2.2 Recent Developments
- 12.3. Company Market Share Analysis 2025
- 12.3.1 Top 5 Companies Market Share Analysis
- 12.3.2 Top 3 Companies Market Share Analysis
- 12.4. List of Potential Customers
- 13. Research Methodology
List of Figures
- Figure 1: Global Industrial Salts Industry Revenue Breakdown (million, %) by Region 2025 & 2033
- Figure 2: Global Industrial Salts Industry Volume Breakdown (K Tons, %) by Region 2025 & 2033
- Figure 3: Asia Pacific Industrial Salts Industry Revenue (million), by Source 2025 & 2033
- Figure 4: Asia Pacific Industrial Salts Industry Volume (K Tons), by Source 2025 & 2033
- Figure 5: Asia Pacific Industrial Salts Industry Revenue Share (%), by Source 2025 & 2033
- Figure 6: Asia Pacific Industrial Salts Industry Volume Share (%), by Source 2025 & 2033
- Figure 7: Asia Pacific Industrial Salts Industry Revenue (million), by Manufacturing Process 2025 & 2033
- Figure 8: Asia Pacific Industrial Salts Industry Volume (K Tons), by Manufacturing Process 2025 & 2033
- Figure 9: Asia Pacific Industrial Salts Industry Revenue Share (%), by Manufacturing Process 2025 & 2033
- Figure 10: Asia Pacific Industrial Salts Industry Volume Share (%), by Manufacturing Process 2025 & 2033
- Figure 11: Asia Pacific Industrial Salts Industry Revenue (million), by Application 2025 & 2033
- Figure 12: Asia Pacific Industrial Salts Industry Volume (K Tons), by Application 2025 & 2033
- Figure 13: Asia Pacific Industrial Salts Industry Revenue Share (%), by Application 2025 & 2033
- Figure 14: Asia Pacific Industrial Salts Industry Volume Share (%), by Application 2025 & 2033
- Figure 15: Asia Pacific Industrial Salts Industry Revenue (million), by Country 2025 & 2033
- Figure 16: Asia Pacific Industrial Salts Industry Volume (K Tons), by Country 2025 & 2033
- Figure 17: Asia Pacific Industrial Salts Industry Revenue Share (%), by Country 2025 & 2033
- Figure 18: Asia Pacific Industrial Salts Industry Volume Share (%), by Country 2025 & 2033
- Figure 19: North America Industrial Salts Industry Revenue (million), by Source 2025 & 2033
- Figure 20: North America Industrial Salts Industry Volume (K Tons), by Source 2025 & 2033
- Figure 21: North America Industrial Salts Industry Revenue Share (%), by Source 2025 & 2033
- Figure 22: North America Industrial Salts Industry Volume Share (%), by Source 2025 & 2033
- Figure 23: North America Industrial Salts Industry Revenue (million), by Manufacturing Process 2025 & 2033
- Figure 24: North America Industrial Salts Industry Volume (K Tons), by Manufacturing Process 2025 & 2033
- Figure 25: North America Industrial Salts Industry Revenue Share (%), by Manufacturing Process 2025 & 2033
- Figure 26: North America Industrial Salts Industry Volume Share (%), by Manufacturing Process 2025 & 2033
- Figure 27: North America Industrial Salts Industry Revenue (million), by Application 2025 & 2033
- Figure 28: North America Industrial Salts Industry Volume (K Tons), by Application 2025 & 2033
- Figure 29: North America Industrial Salts Industry Revenue Share (%), by Application 2025 & 2033
- Figure 30: North America Industrial Salts Industry Volume Share (%), by Application 2025 & 2033
- Figure 31: North America Industrial Salts Industry Revenue (million), by Country 2025 & 2033
- Figure 32: North America Industrial Salts Industry Volume (K Tons), by Country 2025 & 2033
- Figure 33: North America Industrial Salts Industry Revenue Share (%), by Country 2025 & 2033
- Figure 34: North America Industrial Salts Industry Volume Share (%), by Country 2025 & 2033
- Figure 35: Europe Industrial Salts Industry Revenue (million), by Source 2025 & 2033
- Figure 36: Europe Industrial Salts Industry Volume (K Tons), by Source 2025 & 2033
- Figure 37: Europe Industrial Salts Industry Revenue Share (%), by Source 2025 & 2033
- Figure 38: Europe Industrial Salts Industry Volume Share (%), by Source 2025 & 2033
- Figure 39: Europe Industrial Salts Industry Revenue (million), by Manufacturing Process 2025 & 2033
- Figure 40: Europe Industrial Salts Industry Volume (K Tons), by Manufacturing Process 2025 & 2033
- Figure 41: Europe Industrial Salts Industry Revenue Share (%), by Manufacturing Process 2025 & 2033
- Figure 42: Europe Industrial Salts Industry Volume Share (%), by Manufacturing Process 2025 & 2033
- Figure 43: Europe Industrial Salts Industry Revenue (million), by Application 2025 & 2033
- Figure 44: Europe Industrial Salts Industry Volume (K Tons), by Application 2025 & 2033
- Figure 45: Europe Industrial Salts Industry Revenue Share (%), by Application 2025 & 2033
- Figure 46: Europe Industrial Salts Industry Volume Share (%), by Application 2025 & 2033
- Figure 47: Europe Industrial Salts Industry Revenue (million), by Country 2025 & 2033
- Figure 48: Europe Industrial Salts Industry Volume (K Tons), by Country 2025 & 2033
- Figure 49: Europe Industrial Salts Industry Revenue Share (%), by Country 2025 & 2033
- Figure 50: Europe Industrial Salts Industry Volume Share (%), by Country 2025 & 2033
- Figure 51: South America Industrial Salts Industry Revenue (million), by Source 2025 & 2033
- Figure 52: South America Industrial Salts Industry Volume (K Tons), by Source 2025 & 2033
- Figure 53: South America Industrial Salts Industry Revenue Share (%), by Source 2025 & 2033
- Figure 54: South America Industrial Salts Industry Volume Share (%), by Source 2025 & 2033
- Figure 55: South America Industrial Salts Industry Revenue (million), by Manufacturing Process 2025 & 2033
- Figure 56: South America Industrial Salts Industry Volume (K Tons), by Manufacturing Process 2025 & 2033
- Figure 57: South America Industrial Salts Industry Revenue Share (%), by Manufacturing Process 2025 & 2033
- Figure 58: South America Industrial Salts Industry Volume Share (%), by Manufacturing Process 2025 & 2033
- Figure 59: South America Industrial Salts Industry Revenue (million), by Application 2025 & 2033
- Figure 60: South America Industrial Salts Industry Volume (K Tons), by Application 2025 & 2033
- Figure 61: South America Industrial Salts Industry Revenue Share (%), by Application 2025 & 2033
- Figure 62: South America Industrial Salts Industry Volume Share (%), by Application 2025 & 2033
- Figure 63: South America Industrial Salts Industry Revenue (million), by Country 2025 & 2033
- Figure 64: South America Industrial Salts Industry Volume (K Tons), by Country 2025 & 2033
- Figure 65: South America Industrial Salts Industry Revenue Share (%), by Country 2025 & 2033
- Figure 66: South America Industrial Salts Industry Volume Share (%), by Country 2025 & 2033
- Figure 67: Middle East and Africa Industrial Salts Industry Revenue (million), by Source 2025 & 2033
- Figure 68: Middle East and Africa Industrial Salts Industry Volume (K Tons), by Source 2025 & 2033
- Figure 69: Middle East and Africa Industrial Salts Industry Revenue Share (%), by Source 2025 & 2033
- Figure 70: Middle East and Africa Industrial Salts Industry Volume Share (%), by Source 2025 & 2033
- Figure 71: Middle East and Africa Industrial Salts Industry Revenue (million), by Manufacturing Process 2025 & 2033
- Figure 72: Middle East and Africa Industrial Salts Industry Volume (K Tons), by Manufacturing Process 2025 & 2033
- Figure 73: Middle East and Africa Industrial Salts Industry Revenue Share (%), by Manufacturing Process 2025 & 2033
- Figure 74: Middle East and Africa Industrial Salts Industry Volume Share (%), by Manufacturing Process 2025 & 2033
- Figure 75: Middle East and Africa Industrial Salts Industry Revenue (million), by Application 2025 & 2033
- Figure 76: Middle East and Africa Industrial Salts Industry Volume (K Tons), by Application 2025 & 2033
- Figure 77: Middle East and Africa Industrial Salts Industry Revenue Share (%), by Application 2025 & 2033
- Figure 78: Middle East and Africa Industrial Salts Industry Volume Share (%), by Application 2025 & 2033
- Figure 79: Middle East and Africa Industrial Salts Industry Revenue (million), by Country 2025 & 2033
- Figure 80: Middle East and Africa Industrial Salts Industry Volume (K Tons), by Country 2025 & 2033
- Figure 81: Middle East and Africa Industrial Salts Industry Revenue Share (%), by Country 2025 & 2033
- Figure 82: Middle East and Africa Industrial Salts Industry Volume Share (%), by Country 2025 & 2033
List of Tables
- Table 1: Global Industrial Salts Industry Revenue million Forecast, by Source 2020 & 2033
- Table 2: Global Industrial Salts Industry Volume K Tons Forecast, by Source 2020 & 2033
- Table 3: Global Industrial Salts Industry Revenue million Forecast, by Manufacturing Process 2020 & 2033
- Table 4: Global Industrial Salts Industry Volume K Tons Forecast, by Manufacturing Process 2020 & 2033
- Table 5: Global Industrial Salts Industry Revenue million Forecast, by Application 2020 & 2033
- Table 6: Global Industrial Salts Industry Volume K Tons Forecast, by Application 2020 & 2033
- Table 7: Global Industrial Salts Industry Revenue million Forecast, by Region 2020 & 2033
- Table 8: Global Industrial Salts Industry Volume K Tons Forecast, by Region 2020 & 2033
- Table 9: Global Industrial Salts Industry Revenue million Forecast, by Source 2020 & 2033
- Table 10: Global Industrial Salts Industry Volume K Tons Forecast, by Source 2020 & 2033
- Table 11: Global Industrial Salts Industry Revenue million Forecast, by Manufacturing Process 2020 & 2033
- Table 12: Global Industrial Salts Industry Volume K Tons Forecast, by Manufacturing Process 2020 & 2033
- Table 13: Global Industrial Salts Industry Revenue million Forecast, by Application 2020 & 2033
- Table 14: Global Industrial Salts Industry Volume K Tons Forecast, by Application 2020 & 2033
- Table 15: Global Industrial Salts Industry Revenue million Forecast, by Country 2020 & 2033
- Table 16: Global Industrial Salts Industry Volume K Tons Forecast, by Country 2020 & 2033
- Table 17: China Industrial Salts Industry Revenue (million) Forecast, by Application 2020 & 2033
- Table 18: China Industrial Salts Industry Volume (K Tons) Forecast, by Application 2020 & 2033
- Table 19: India Industrial Salts Industry Revenue (million) Forecast, by Application 2020 & 2033
- Table 20: India Industrial Salts Industry Volume (K Tons) Forecast, by Application 2020 & 2033
- Table 21: Japan Industrial Salts Industry Revenue (million) Forecast, by Application 2020 & 2033
- Table 22: Japan Industrial Salts Industry Volume (K Tons) Forecast, by Application 2020 & 2033
- Table 23: South Korea Industrial Salts Industry Revenue (million) Forecast, by Application 2020 & 2033
- Table 24: South Korea Industrial Salts Industry Volume (K Tons) Forecast, by Application 2020 & 2033
- Table 25: Rest of Asia Pacific Industrial Salts Industry Revenue (million) Forecast, by Application 2020 & 2033
- Table 26: Rest of Asia Pacific Industrial Salts Industry Volume (K Tons) Forecast, by Application 2020 & 2033
- Table 27: Global Industrial Salts Industry Revenue million Forecast, by Source 2020 & 2033
- Table 28: Global Industrial Salts Industry Volume K Tons Forecast, by Source 2020 & 2033
- Table 29: Global Industrial Salts Industry Revenue million Forecast, by Manufacturing Process 2020 & 2033
- Table 30: Global Industrial Salts Industry Volume K Tons Forecast, by Manufacturing Process 2020 & 2033
- Table 31: Global Industrial Salts Industry Revenue million Forecast, by Application 2020 & 2033
- Table 32: Global Industrial Salts Industry Volume K Tons Forecast, by Application 2020 & 2033
- Table 33: Global Industrial Salts Industry Revenue million Forecast, by Country 2020 & 2033
- Table 34: Global Industrial Salts Industry Volume K Tons Forecast, by Country 2020 & 2033
- Table 35: United States Industrial Salts Industry Revenue (million) Forecast, by Application 2020 & 2033
- Table 36: United States Industrial Salts Industry Volume (K Tons) Forecast, by Application 2020 & 2033
- Table 37: Canada Industrial Salts Industry Revenue (million) Forecast, by Application 2020 & 2033
- Table 38: Canada Industrial Salts Industry Volume (K Tons) Forecast, by Application 2020 & 2033
- Table 39: Mexico Industrial Salts Industry Revenue (million) Forecast, by Application 2020 & 2033
- Table 40: Mexico Industrial Salts Industry Volume (K Tons) Forecast, by Application 2020 & 2033
- Table 41: Global Industrial Salts Industry Revenue million Forecast, by Source 2020 & 2033
- Table 42: Global Industrial Salts Industry Volume K Tons Forecast, by Source 2020 & 2033
- Table 43: Global Industrial Salts Industry Revenue million Forecast, by Manufacturing Process 2020 & 2033
- Table 44: Global Industrial Salts Industry Volume K Tons Forecast, by Manufacturing Process 2020 & 2033
- Table 45: Global Industrial Salts Industry Revenue million Forecast, by Application 2020 & 2033
- Table 46: Global Industrial Salts Industry Volume K Tons Forecast, by Application 2020 & 2033
- Table 47: Global Industrial Salts Industry Revenue million Forecast, by Country 2020 & 2033
- Table 48: Global Industrial Salts Industry Volume K Tons Forecast, by Country 2020 & 2033
- Table 49: Germany Industrial Salts Industry Revenue (million) Forecast, by Application 2020 & 2033
- Table 50: Germany Industrial Salts Industry Volume (K Tons) Forecast, by Application 2020 & 2033
- Table 51: United Kingdom Industrial Salts Industry Revenue (million) Forecast, by Application 2020 & 2033
- Table 52: United Kingdom Industrial Salts Industry Volume (K Tons) Forecast, by Application 2020 & 2033
- Table 53: France Industrial Salts Industry Revenue (million) Forecast, by Application 2020 & 2033
- Table 54: France Industrial Salts Industry Volume (K Tons) Forecast, by Application 2020 & 2033
- Table 55: Italy Industrial Salts Industry Revenue (million) Forecast, by Application 2020 & 2033
- Table 56: Italy Industrial Salts Industry Volume (K Tons) Forecast, by Application 2020 & 2033
- Table 57: Rest of Europe Industrial Salts Industry Revenue (million) Forecast, by Application 2020 & 2033
- Table 58: Rest of Europe Industrial Salts Industry Volume (K Tons) Forecast, by Application 2020 & 2033
- Table 59: Global Industrial Salts Industry Revenue million Forecast, by Source 2020 & 2033
- Table 60: Global Industrial Salts Industry Volume K Tons Forecast, by Source 2020 & 2033
- Table 61: Global Industrial Salts Industry Revenue million Forecast, by Manufacturing Process 2020 & 2033
- Table 62: Global Industrial Salts Industry Volume K Tons Forecast, by Manufacturing Process 2020 & 2033
- Table 63: Global Industrial Salts Industry Revenue million Forecast, by Application 2020 & 2033
- Table 64: Global Industrial Salts Industry Volume K Tons Forecast, by Application 2020 & 2033
- Table 65: Global Industrial Salts Industry Revenue million Forecast, by Country 2020 & 2033
- Table 66: Global Industrial Salts Industry Volume K Tons Forecast, by Country 2020 & 2033
- Table 67: Brazil Industrial Salts Industry Revenue (million) Forecast, by Application 2020 & 2033
- Table 68: Brazil Industrial Salts Industry Volume (K Tons) Forecast, by Application 2020 & 2033
- Table 69: Argentina Industrial Salts Industry Revenue (million) Forecast, by Application 2020 & 2033
- Table 70: Argentina Industrial Salts Industry Volume (K Tons) Forecast, by Application 2020 & 2033
- Table 71: Rest of South America Industrial Salts Industry Revenue (million) Forecast, by Application 2020 & 2033
- Table 72: Rest of South America Industrial Salts Industry Volume (K Tons) Forecast, by Application 2020 & 2033
- Table 73: Global Industrial Salts Industry Revenue million Forecast, by Source 2020 & 2033
- Table 74: Global Industrial Salts Industry Volume K Tons Forecast, by Source 2020 & 2033
- Table 75: Global Industrial Salts Industry Revenue million Forecast, by Manufacturing Process 2020 & 2033
- Table 76: Global Industrial Salts Industry Volume K Tons Forecast, by Manufacturing Process 2020 & 2033
- Table 77: Global Industrial Salts Industry Revenue million Forecast, by Application 2020 & 2033
- Table 78: Global Industrial Salts Industry Volume K Tons Forecast, by Application 2020 & 2033
- Table 79: Global Industrial Salts Industry Revenue million Forecast, by Country 2020 & 2033
- Table 80: Global Industrial Salts Industry Volume K Tons Forecast, by Country 2020 & 2033
- Table 81: Saudi Arabia Industrial Salts Industry Revenue (million) Forecast, by Application 2020 & 2033
- Table 82: Saudi Arabia Industrial Salts Industry Volume (K Tons) Forecast, by Application 2020 & 2033
- Table 83: South Africa Industrial Salts Industry Revenue (million) Forecast, by Application 2020 & 2033
- Table 84: South Africa Industrial Salts Industry Volume (K Tons) Forecast, by Application 2020 & 2033
- Table 85: Rest of Middle East and Africa Industrial Salts Industry Revenue (million) Forecast, by Application 2020 & 2033
- Table 86: Rest of Middle East and Africa Industrial Salts Industry Volume (K Tons) Forecast, by Application 2020 & 2033
Frequently Asked Questions
1. What is the projected Compound Annual Growth Rate (CAGR) of the Industrial Salts Industry?
The projected CAGR is approximately 2.2%.
2. Which companies are prominent players in the Industrial Salts Industry?
Key companies in the market include MITSUI & CO LTD, Cargill Incorporated, Salins IAA, Nouryon, INEOS, Tata Chemicals Ltd, Archean Group, Donald Brown Group, Rio Tinto, Delmon Group of Companies, K+S Aktiengesellschaft, Morton Salt Inc, Exportadora de Sal de CV, Compass Minerals, Dominion Salt Limited.
3. What are the main segments of the Industrial Salts Industry?
The market segments include Source, Manufacturing Process, Application.
4. Can you provide details about the market size?
The market size is estimated to be USD 238.55 million as of 2022.
5. What are some drivers contributing to market growth?
Increasing Demand in Chemical Processing; Growing Demand from Water Treatment.
6. What are the notable trends driving market growth?
Increasing Demand from Chemicals Processing Application.
7. Are there any restraints impacting market growth?
Stringent Government Regulations; Unfavorable Conditions Arising due to the Impact of COVID-19.
8. Can you provide examples of recent developments in the market?
In January 2021, Tata Chemicals Ltd intended to acquire the industrial salt unit with an annual production capacity of 3 million tons of Archean Group, which would enhance the company's business.
9. What pricing options are available for accessing the report?
Pricing options include single-user, multi-user, and enterprise licenses priced at USD 4750, USD 5250, and USD 8750 respectively.
10. Is the market size provided in terms of value or volume?
The market size is provided in terms of value, measured in million and volume, measured in K Tons.
11. Are there any specific market keywords associated with the report?
Yes, the market keyword associated with the report is "Industrial Salts Industry," which aids in identifying and referencing the specific market segment covered.
12. How do I determine which pricing option suits my needs best?
The pricing options vary based on user requirements and access needs. Individual users may opt for single-user licenses, while businesses requiring broader access may choose multi-user or enterprise licenses for cost-effective access to the report.
13. Are there any additional resources or data provided in the Industrial Salts Industry report?
While the report offers comprehensive insights, it's advisable to review the specific contents or supplementary materials provided to ascertain if additional resources or data are available.
14. How can I stay updated on further developments or reports in the Industrial Salts Industry?
To stay informed about further developments, trends, and reports in the Industrial Salts Industry, consider subscribing to industry newsletters, following relevant companies and organizations, or regularly checking reputable industry news sources and publications.
Methodology
Step 1 - Identification of Relevant Samples Size from Population Database


Step 2 - Approaches for Defining Global Market Size (Value, Volume* & Price*)

Note*: In applicable scenarios
Step 3 - Data Sources
Primary Research
- Web Analytics
- Survey Reports
- Research Institute
- Latest Research Reports
- Opinion Leaders
Secondary Research
- Annual Reports
- White Paper
- Latest Press Release
- Industry Association
- Paid Database
- Investor Presentations

Step 4 - Data Triangulation
Involves using different sources of information in order to increase the validity of a study
These sources are likely to be stakeholders in a program - participants, other researchers, program staff, other community members, and so on.
Then we put all data in single framework & apply various statistical tools to find out the dynamic on the market.
During the analysis stage, feedback from the stakeholder groups would be compared to determine areas of agreement as well as areas of divergence