

Key Insights
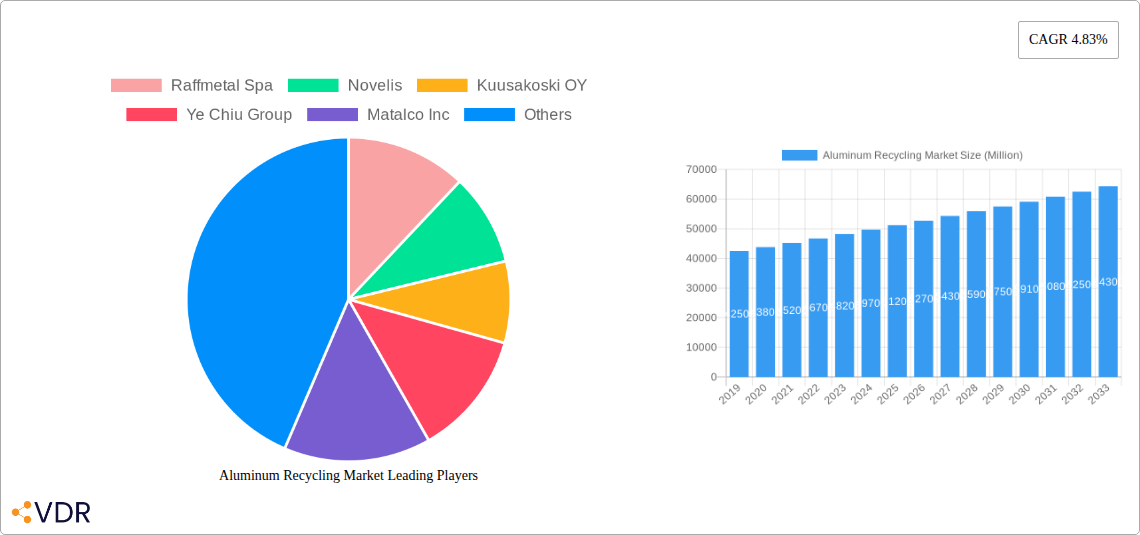
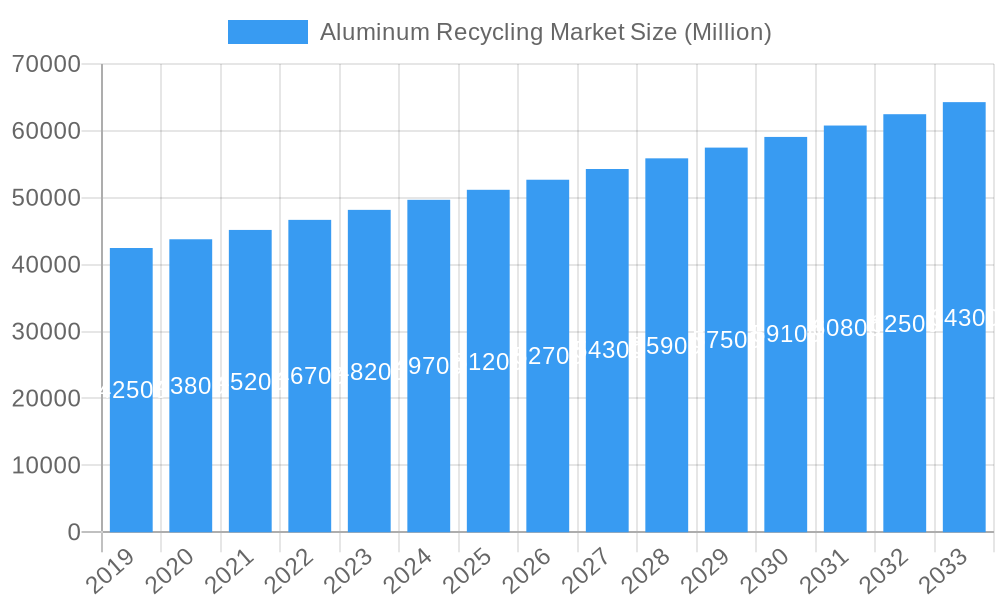
The global Aluminum Recycling Market is poised for robust expansion, projected to reach a substantial market size of approximately $55,000 million by 2025, driven by a Compound Annual Growth Rate (CAGR) of 4.83%. This growth is underpinned by a confluence of critical factors, primarily the increasing environmental consciousness among consumers and governments, coupled with stringent regulations promoting sustainable practices. The inherent economic advantages of recycling aluminum, including significant energy savings compared to primary production and reduced reliance on virgin bauxite, further fuel this upward trajectory. Key drivers include escalating demand from the automotive sector for lightweight materials to enhance fuel efficiency and reduce emissions, and the aerospace industry's continuous pursuit of high-performance, sustainable components. The building and construction industry also contributes significantly, leveraging aluminum's durability and recyclability in various applications. Innovations in recycling technologies, leading to higher recovery rates and improved purity of recycled aluminum, are also playing a pivotal role in market expansion.
Aluminum Recycling Market Market Size (In Billion)
The market is segmented into various product types, with Casting Alloys and Extrusion anticipated to dominate due to their widespread use in transportation and construction. Sheets are also expected to witness steady growth. Geographically, the Asia Pacific region, led by China and India, is emerging as a dominant force, propelled by rapid industrialization, a burgeoning manufacturing base, and proactive government initiatives supporting circular economy principles. North America and Europe, with their established recycling infrastructures and strong regulatory frameworks, will continue to be significant markets. However, challenges such as fluctuating scrap availability, energy costs associated with the recycling process, and the need for advanced sorting and processing technologies could present restraints. Emerging trends like the development of advanced alloys for specialized applications and the integration of artificial intelligence in sorting processes are set to redefine the market landscape, ensuring a sustainable and resource-efficient future for aluminum.
Aluminum Recycling Market Company Market Share
Unleash the Potential of Sustainable Aluminum: Comprehensive Market Report 2019-2033
Gain a definitive edge in the rapidly evolving Aluminum Recycling Market with our in-depth analysis, meticulously crafted for industry professionals and investors. This report provides a strategic roadmap to navigate the intricate landscape of secondary aluminum production, aluminum scrap market, and aluminum alloy recycling. We delve deep into the critical factors shaping demand, supply, and innovation, offering actionable insights for maximizing your market share and investment returns. Explore the lucrative opportunities within casting alloys, extrusion, sheets, and other product types, and understand how shifting dynamics in the automotive, aerospace, building and construction, electrical and electronics, and packaging industries are driving the need for efficient and sustainable aluminum recycling solutions.
With a comprehensive study period from 2019 to 2033, and detailed segmentation by product type and end-user industry, this report empowers you with unprecedented clarity. We analyze the global aluminum recycling market size, CAGR, and future projections, presenting all data in millions of units for easy comprehension. Uncover key industry developments, dominant regions, and the competitive strategies of leading players. Whether you are seeking to understand the drivers of aluminum recycling, challenges in aluminum scrap collection, or innovations in aluminum recycling technology, this report is your indispensable guide.
Aluminum Recycling Market Market Dynamics & Structure
The Aluminum Recycling Market is characterized by a moderately concentrated structure, with key players like Novelis, Alcoa Corporation, and Hydro ASA dominating the landscape. Technological innovation is a significant driver, with ongoing advancements in sorting, melting, and refining processes enhancing efficiency and expanding the range of recoverable aluminum alloys. Regulatory frameworks, particularly those promoting circular economy principles and stringent environmental standards, are increasingly influencing market operations and incentivizing higher recycling rates. Competitive product substitutes, such as other recyclable metals and advanced plastics, pose a constant challenge, necessitating continuous improvement in the cost-effectiveness and performance of recycled aluminum. End-user demographics are shifting towards greater demand for sustainable materials, driven by consumer awareness and corporate social responsibility initiatives. Mergers and acquisitions (M&A) are a prominent trend, with companies consolidating to gain economies of scale, expand geographical reach, and enhance their recycling capabilities.
- Market Concentration: Dominated by a few large integrated players with significant investment in advanced recycling infrastructure.
- Technological Innovation: Focus on improving sorting accuracy, energy efficiency in melting, and developing new alloys from recycled feedstock.
- Regulatory Frameworks: Increasing pressure from governments globally to achieve higher recycling targets and reduce landfill waste.
- Competitive Substitutes: Continuous need to demonstrate the superior sustainability and cost-competitiveness of recycled aluminum compared to virgin aluminum and alternative materials.
- End-user Demographics: Growing demand for lightweight, durable, and sustainably sourced materials across all key sectors.
- M&A Trends: Strategic acquisitions aimed at securing feedstock, expanding processing capacity, and enhancing technological expertise. For example, in September 2023, Stena Metall AB acquired Pyreco S.r.l, an Italian aluminum recycling company with a 12,000-square-meter facility and six advanced production lines, bolstering Stena Recycling’s capabilities in Italy.
Aluminum Recycling Market Growth Trends & Insights
The Aluminum Recycling Market is poised for substantial growth, fueled by a confluence of economic, environmental, and technological factors. The intrinsic recyclability of aluminum, which allows for nearly infinite recycling without degradation of quality, positions it as a cornerstone of the global shift towards a circular economy. Market size evolution has been consistently upward, with an increasing volume of aluminum scrap being diverted from landfills and processed into valuable secondary aluminum. Adoption rates of recycled aluminum are steadily rising across various end-user industries, driven by cost efficiencies and the growing imperative for sustainability. Technological disruptions, such as advanced sensor-based sorting and more energy-efficient smelting techniques, are continuously improving the economics and environmental footprint of aluminum recycling. Consumer behavior shifts, particularly in developed economies, are placing a premium on products manufactured using recycled materials, thereby creating a strong pull for recycled aluminum.
The global aluminum recycling market size is projected to witness a robust Compound Annual Growth Rate (CAGR) over the forecast period. This growth is intrinsically linked to the increasing volume of aluminum consumed globally and the corresponding generation of post-consumer and post-industrial scrap. For instance, the automotive industry's pursuit of lightweighting for fuel efficiency and the growing demand for electric vehicles (EVs) are significant contributors to the rising consumption of aluminum, subsequently increasing the available scrap for recycling. Similarly, the building and construction sector, with its focus on sustainable building materials and infrastructure development, represents a substantial source of aluminum scrap. The packaging sector, particularly for beverage cans, is a highly mature segment for aluminum recycling, with high collection and recycling rates already established in many regions. The electrical and electronics industry, while smaller in volume compared to automotive or construction, is also seeing an increase in the use of recycled aluminum due to its conductivity and recyclability.
The market penetration of recycled aluminum is steadily increasing as manufacturers recognize its economic advantages and environmental benefits. The energy savings associated with recycling aluminum—up to 95% less energy compared to primary aluminum production—make it an attractive option, especially in regions with high energy costs. Furthermore, government policies and incentives aimed at promoting recycling and reducing carbon emissions are creating a more favorable operating environment for recycling facilities. The growing awareness of the environmental impact of primary aluminum production, including its significant carbon footprint, is further propelling the demand for recycled alternatives. The industry is also witnessing a trend towards more sophisticated recycling processes that can handle complex aluminum alloys, thereby expanding the range of applications for recycled aluminum. The increasing focus on the "lifecycle assessment" of materials is also a key factor, as recycled aluminum consistently scores better on environmental impact metrics.
Dominant Regions, Countries, or Segments in Aluminum Recycling Market
The Aluminum Recycling Market is experiencing robust growth across several key regions and segments, with the Automotive end-user industry emerging as a dominant driver. This dominance is attributable to the automotive sector's relentless pursuit of lightweighting to enhance fuel efficiency in internal combustion engine vehicles and extend the range of electric vehicles (EVs). The inherent properties of aluminum – its high strength-to-weight ratio, corrosion resistance, and formability – make it an ideal material for vehicle components such as body panels, engine blocks, and chassis parts. As global automotive production continues to recover and evolve with the transition to EVs, the demand for recycled aluminum in this sector is projected to soar.
- Dominant End-User Industry: Automotive
- Lightweighting Initiatives: Crucial for improving fuel economy and EV range. Recycled aluminum offers a sustainable and cost-effective solution for achieving these goals.
- EV Growth: The increasing adoption of electric vehicles, which often utilize more aluminum for battery casings, motor components, and structural integrity, significantly boosts demand.
- Cost-Effectiveness: Recycled aluminum offers significant cost advantages over virgin aluminum, making it attractive for mass-produced vehicles.
- Sustainability Mandates: Automotive manufacturers are increasingly setting ambitious sustainability targets, making the use of recycled materials a strategic imperative.
- Market Share: The automotive sector accounts for a substantial and growing share of the total recycled aluminum consumption, estimated to be in the range of 30-35% in recent years.
Beyond the automotive sector, the Building and Construction industry also plays a pivotal role in the Aluminum Recycling Market. Aluminum is extensively used in architectural applications such as window frames, doors, facade systems, and roofing due to its durability, low maintenance, and aesthetic appeal. The global push towards sustainable construction practices and the increasing demand for energy-efficient buildings further bolster the use of recycled aluminum in this segment. Economic policies supporting infrastructure development and urban renewal projects in various countries are also contributing to sustained demand.
The Packaging segment, particularly for aluminum beverage cans, remains a high-volume and crucial area for aluminum recycling. Developed economies have established highly efficient collection and recycling systems, leading to very high recycling rates for aluminum cans. The consumer preference for aluminum cans due to their recyclability and preservation qualities continues to drive this segment.
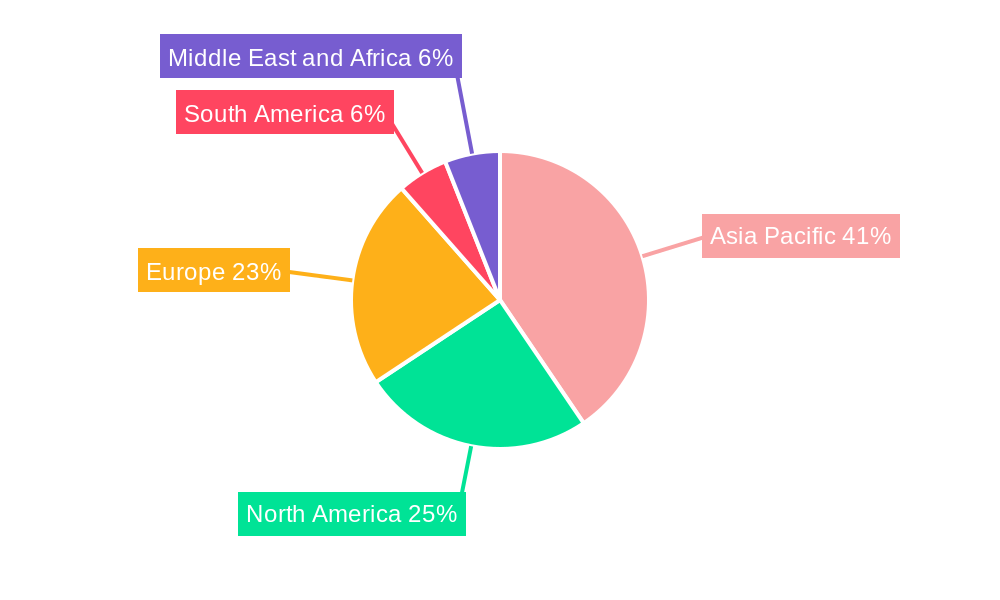
In terms of regions, North America and Europe currently lead the Aluminum Recycling Market. These regions benefit from well-established recycling infrastructures, strong regulatory support for circular economy initiatives, and a high level of consumer awareness regarding recycling. The presence of major aluminum producers and recyclers, coupled with significant industrial demand from the automotive and construction sectors, underpins their dominance. Asia-Pacific, particularly China, is emerging as a rapidly growing market, driven by its large manufacturing base, increasing industrialization, and growing environmental consciousness.
- Dominant Regions: North America and Europe, followed by Asia-Pacific.
- Key Growth Drivers (Regional):
- North America: Strong automotive and aerospace presence, supportive government policies, and robust recycling infrastructure.
- Europe: Ambitious circular economy targets, stringent environmental regulations, and high consumer demand for sustainable products.
- Asia-Pacific: Rapid industrial growth, increasing urbanization, and rising environmental awareness driving demand for recycled materials.
The Product Type segment of Sheets is also a significant contributor, driven by the demand from the packaging and automotive industries for rolled products. Advances in recycling technology are enabling the efficient production of high-quality recycled aluminum sheets that meet stringent industry specifications.
Aluminum Recycling Market Product Landscape
The Aluminum Recycling Market product landscape is characterized by a diverse range of offerings catering to various industrial needs. Casting alloys remain a cornerstone, finding extensive application in automotive components like engine blocks, cylinder heads, and wheels, where their superior fluidity and strength are critical. Extrusion products, including profiles for windows, doors, and structural components, are in high demand due to their versatility and recyclability. Sheets are integral to the packaging sector, particularly for beverage cans, and are increasingly utilized in automotive body panels and aerospace applications due to advancements in their quality and performance. Innovations are focused on developing higher-purity recycled aluminum, optimizing alloy compositions for specific performance requirements, and enhancing the efficiency of secondary aluminum production to reduce energy consumption and environmental impact.
Key Drivers, Barriers & Challenges in Aluminum Recycling Market
The Aluminum Recycling Market is propelled by several key drivers, foremost among them being the escalating global demand for sustainable materials and the inherent environmental benefits of recycling aluminum, which requires up to 95% less energy than primary production. Government regulations promoting circular economy principles and carbon footprint reduction further incentivize recycling. Technological advancements in sorting and melting processes are improving efficiency and expanding the range of recoverable alloys.
- Key Drivers:
- Environmental Imperative: Growing pressure to reduce carbon emissions and landfill waste.
- Economic Advantages: Lower energy consumption and production costs compared to primary aluminum.
- Circular Economy Policies: Government mandates and incentives favoring recycled content.
- Technological Advancements: Improved sorting, melting, and refining technologies.
- Consumer Demand: Increasing preference for sustainable and recycled products.
However, the market faces significant barriers and challenges. Inconsistent quality and availability of aluminum scrap, particularly from diverse sources, can pose supply chain issues. The capital-intensive nature of advanced recycling facilities requires substantial investment. Fluctuations in the price of primary aluminum can impact the competitiveness of recycled aluminum. Regulatory hurdles in certain regions and the need for sophisticated sorting technologies to separate different aluminum alloys also present challenges. Furthermore, competition from other lightweight materials and the logistical complexities of scrap collection and transportation need to be effectively managed.
- Barriers & Challenges:
- Scrap Quality and Availability: Inconsistent feedstock quality and collection logistics.
- High Capital Investment: Costs associated with advanced recycling infrastructure.
- Price Volatility: Dependence on primary aluminum market prices.
- Regulatory Complexities: Navigating varying regulations across different jurisdictions.
- Technological Sophistication: Need for advanced sorting to manage diverse alloys.
- Logistical Hurdles: Efficient collection and transportation of scrap.
Emerging Opportunities in Aluminum Recycling Market
Emerging opportunities in the Aluminum Recycling Market are manifold, driven by innovation and evolving market demands. The increasing focus on lightweighting in the automotive sector, particularly for electric vehicles, presents a significant growth avenue for high-quality recycled aluminum alloys. Furthermore, the development of advanced recycling technologies capable of processing complex aluminum scrap, including those with coatings or multiple alloys, opens up new feedstock streams and expands the potential applications for recycled aluminum. The growing consumer preference for sustainable products across all industries is creating a demand for products with a higher recycled content, encouraging manufacturers to incorporate more recycled aluminum into their supply chains. Untapped markets in developing economies with growing industrial bases and increasing environmental awareness also represent significant long-term growth potential.
Growth Accelerators in the Aluminum Recycling Market Industry
Several catalysts are accelerating growth in the Aluminum Recycling Market. Technological breakthroughs in automated sorting and identification of aluminum alloys are enhancing efficiency and purity, making it easier to recover valuable materials. Strategic partnerships between scrap collectors, recyclers, and end-users are crucial for securing reliable feedstock and ensuring consistent demand for recycled aluminum. Market expansion strategies, including investments in new recycling facilities in high-demand regions and the development of novel applications for recycled aluminum, are further fueling growth. The increasing emphasis on life cycle assessments (LCAs) and environmental, social, and governance (ESG) reporting by corporations is also a significant growth accelerator, as recycled aluminum consistently scores well on these metrics.
Key Players Shaping the Aluminum Recycling Market Market
- Raffmetal Spa
- Novelis
- Kuusakoski OY
- Ye Chiu Group
- Matalco Inc
- Speira Gmbh
- Real Alloy
- Constellium
- Stena Metall AB
- Norsk Hydro Asa
- Alcoa Corporation
- Amag Austria Metall AG
Notable Milestones in Aluminum Recycling Market Sector
- January 2024: Novelis Inc. signed a new contract with Ardagh Metal Packaging USA Corp., a global supplier of sustainable aluminum beverage packaging solutions. Under the contract, Novelis will supply aluminum beverage packaging sheets to Ardagh's metal production facilities in North America, highlighting a significant supply agreement in the packaging sector.
- September 2023: Stena Metall AB has acquired Pyreco S.r.l, an Italian aluminum recycling company. Pyreco S.r.l has a 12,000-square-meter facility equipped with six advanced production lines. The acquisition complements Stena Recycling’s capabilities in Italy, demonstrating strategic consolidation and expansion within the European market.
In-Depth Aluminum Recycling Market Market Outlook
The Aluminum Recycling Market is set for a robust future, driven by the inexorable shift towards sustainability and the inherent advantages of aluminum's recyclability. Growth accelerators, including ongoing technological advancements in purification and alloy development, alongside strategic collaborations between industry stakeholders, will further solidify its position. The increasing adoption of recycled aluminum in critical sectors like automotive (especially EVs) and aerospace, coupled with supportive global policies promoting circular economy principles, will create sustained demand. The market's outlook is exceptionally positive, with significant opportunities for innovation in feedstock management, enhanced processing efficiency, and the development of higher-value applications for recycled aluminum, promising substantial returns for those strategically positioned within this vital industry.
Aluminum Recycling Market Segmentation
-
1. Product Type
- 1.1. Casting Alloys
- 1.2. Extrusion
- 1.3. Sheets
- 1.4. Other Product Types
-
2. End-user Industry
- 2.1. Automotive
- 2.2. Aerospace and Defense
- 2.3. Building and Construction
- 2.4. Electrical and Electronics
- 2.5. Packaging
- 2.6. Other End-user Industries
Aluminum Recycling Market Segmentation By Geography
-
1. Asia Pacific
- 1.1. China
- 1.2. India
- 1.3. Japan
- 1.4. South Korea
- 1.5. Malaysia
- 1.6. Thailand
- 1.7. Indonesia
- 1.8. Vietnam
- 1.9. Rest of Asia Pacific
-
2. North America
- 2.1. United States
- 2.2. Canada
- 2.3. Mexico
-
3. Europe
- 3.1. Germany
- 3.2. United Kingdom
- 3.3. France
- 3.4. Italy
- 3.5. Spain
- 3.6. Nordic Countries
- 3.7. Turkey
- 3.8. Russia
- 3.9. Rest of Europe
-
4. South America
- 4.1. Brazil
- 4.2. Argentina
- 4.3. Colombia
- 4.4. Rest of South America
-
5. Middle East and Africa
- 5.1. Saudi Arabia
- 5.2. Qatar
- 5.3. United Arab Emirates
- 5.4. Nigeria
- 5.5. Egypt
- 5.6. South Africa
- 5.7. Rest of Middle East and Africa
Aluminum Recycling Market Regional Market Share
Geographic Coverage of Aluminum Recycling Market
Aluminum Recycling Market REPORT HIGHLIGHTS
| Aspects | Details |
|---|---|
| Study Period | 2020-2034 |
| Base Year | 2025 |
| Estimated Year | 2026 |
| Forecast Period | 2026-2034 |
| Historical Period | 2020-2025 |
| Growth Rate | CAGR of 11.4% from 2020-2034 |
| Segmentation |
|
Table of Contents
- 1. Introduction
- 1.1. Research Scope
- 1.2. Market Segmentation
- 1.3. Research Objective
- 1.4. Definitions and Assumptions
- 2. Executive Summary
- 2.1. Market Snapshot
- 3. Market Dynamics
- 3.1. Market Drivers
- 3.2. Market Restrains
- 3.3. Market Trends
- 3.4. Market Opportunities
- 4. Market Factor Analysis
- 4.1. Porters Five Forces
- 4.1.1. Bargaining Power of Suppliers
- 4.1.2. Bargaining Power of Buyers
- 4.1.3. Threat of New Entrants
- 4.1.4. Threat of Substitutes
- 4.1.5. Competitive Rivalry
- 4.2. PESTEL analysis
- 4.3. BCG Analysis
- 4.3.1. Stars (High Growth, High Market Share)
- 4.3.2. Cash Cows (Low Growth, High Market Share)
- 4.3.3. Question Mark (High Growth, Low Market Share)
- 4.3.4. Dogs (Low Growth, Low Market Share)
- 4.4. Ansoff Matrix Analysis
- 4.5. Supply Chain Analysis
- 4.6. Regulatory Landscape
- 4.7. Current Market Potential and Opportunity Assessment (TAM–SAM–SOM Framework)
- 4.8. VDR Analyst Note
- 4.1. Porters Five Forces
- 5. Market Analysis, Insights and Forecast 2021-2033
- 5.1. Market Analysis, Insights and Forecast - by Product Type
- 5.1.1. Casting Alloys
- 5.1.2. Extrusion
- 5.1.3. Sheets
- 5.1.4. Other Product Types
- 5.2. Market Analysis, Insights and Forecast - by End-user Industry
- 5.2.1. Automotive
- 5.2.2. Aerospace and Defense
- 5.2.3. Building and Construction
- 5.2.4. Electrical and Electronics
- 5.2.5. Packaging
- 5.2.6. Other End-user Industries
- 5.3. Market Analysis, Insights and Forecast - by Region
- 5.3.1. Asia Pacific
- 5.3.2. North America
- 5.3.3. Europe
- 5.3.4. South America
- 5.3.5. Middle East and Africa
- 5.1. Market Analysis, Insights and Forecast - by Product Type
- 6. Global Aluminum Recycling Market Analysis, Insights and Forecast, 2021-2033
- 6.1. Market Analysis, Insights and Forecast - by Product Type
- 6.1.1. Casting Alloys
- 6.1.2. Extrusion
- 6.1.3. Sheets
- 6.1.4. Other Product Types
- 6.2. Market Analysis, Insights and Forecast - by End-user Industry
- 6.2.1. Automotive
- 6.2.2. Aerospace and Defense
- 6.2.3. Building and Construction
- 6.2.4. Electrical and Electronics
- 6.2.5. Packaging
- 6.2.6. Other End-user Industries
- 6.1. Market Analysis, Insights and Forecast - by Product Type
- 7. Asia Pacific Aluminum Recycling Market Analysis, Insights and Forecast, 2021-2033
- 7.1. Market Analysis, Insights and Forecast - by Product Type
- 7.1.1. Casting Alloys
- 7.1.2. Extrusion
- 7.1.3. Sheets
- 7.1.4. Other Product Types
- 7.2. Market Analysis, Insights and Forecast - by End-user Industry
- 7.2.1. Automotive
- 7.2.2. Aerospace and Defense
- 7.2.3. Building and Construction
- 7.2.4. Electrical and Electronics
- 7.2.5. Packaging
- 7.2.6. Other End-user Industries
- 7.1. Market Analysis, Insights and Forecast - by Product Type
- 8. North America Aluminum Recycling Market Analysis, Insights and Forecast, 2021-2033
- 8.1. Market Analysis, Insights and Forecast - by Product Type
- 8.1.1. Casting Alloys
- 8.1.2. Extrusion
- 8.1.3. Sheets
- 8.1.4. Other Product Types
- 8.2. Market Analysis, Insights and Forecast - by End-user Industry
- 8.2.1. Automotive
- 8.2.2. Aerospace and Defense
- 8.2.3. Building and Construction
- 8.2.4. Electrical and Electronics
- 8.2.5. Packaging
- 8.2.6. Other End-user Industries
- 8.1. Market Analysis, Insights and Forecast - by Product Type
- 9. Europe Aluminum Recycling Market Analysis, Insights and Forecast, 2021-2033
- 9.1. Market Analysis, Insights and Forecast - by Product Type
- 9.1.1. Casting Alloys
- 9.1.2. Extrusion
- 9.1.3. Sheets
- 9.1.4. Other Product Types
- 9.2. Market Analysis, Insights and Forecast - by End-user Industry
- 9.2.1. Automotive
- 9.2.2. Aerospace and Defense
- 9.2.3. Building and Construction
- 9.2.4. Electrical and Electronics
- 9.2.5. Packaging
- 9.2.6. Other End-user Industries
- 9.1. Market Analysis, Insights and Forecast - by Product Type
- 10. South America Aluminum Recycling Market Analysis, Insights and Forecast, 2021-2033
- 10.1. Market Analysis, Insights and Forecast - by Product Type
- 10.1.1. Casting Alloys
- 10.1.2. Extrusion
- 10.1.3. Sheets
- 10.1.4. Other Product Types
- 10.2. Market Analysis, Insights and Forecast - by End-user Industry
- 10.2.1. Automotive
- 10.2.2. Aerospace and Defense
- 10.2.3. Building and Construction
- 10.2.4. Electrical and Electronics
- 10.2.5. Packaging
- 10.2.6. Other End-user Industries
- 10.1. Market Analysis, Insights and Forecast - by Product Type
- 11. Middle East and Africa Aluminum Recycling Market Analysis, Insights and Forecast, 2021-2033
- 11.1. Market Analysis, Insights and Forecast - by Product Type
- 11.1.1. Casting Alloys
- 11.1.2. Extrusion
- 11.1.3. Sheets
- 11.1.4. Other Product Types
- 11.2. Market Analysis, Insights and Forecast - by End-user Industry
- 11.2.1. Automotive
- 11.2.2. Aerospace and Defense
- 11.2.3. Building and Construction
- 11.2.4. Electrical and Electronics
- 11.2.5. Packaging
- 11.2.6. Other End-user Industries
- 11.1. Market Analysis, Insights and Forecast - by Product Type
- 12. Competitive Analysis
- 12.1. Company Profiles
- 12.1.1 Raffmetal Spa
- 12.1.1.1. Company Overview
- 12.1.1.2. Products
- 12.1.1.3. Company Financials
- 12.1.1.4. SWOT Analysis
- 12.1.2 Novelis
- 12.1.2.1. Company Overview
- 12.1.2.2. Products
- 12.1.2.3. Company Financials
- 12.1.2.4. SWOT Analysis
- 12.1.3 Kuusakoski OY
- 12.1.3.1. Company Overview
- 12.1.3.2. Products
- 12.1.3.3. Company Financials
- 12.1.3.4. SWOT Analysis
- 12.1.4 Ye Chiu Group
- 12.1.4.1. Company Overview
- 12.1.4.2. Products
- 12.1.4.3. Company Financials
- 12.1.4.4. SWOT Analysis
- 12.1.5 Matalco Inc
- 12.1.5.1. Company Overview
- 12.1.5.2. Products
- 12.1.5.3. Company Financials
- 12.1.5.4. SWOT Analysis
- 12.1.6 Speira Gmbh
- 12.1.6.1. Company Overview
- 12.1.6.2. Products
- 12.1.6.3. Company Financials
- 12.1.6.4. SWOT Analysis
- 12.1.7 Real Alloy
- 12.1.7.1. Company Overview
- 12.1.7.2. Products
- 12.1.7.3. Company Financials
- 12.1.7.4. SWOT Analysis
- 12.1.8 Constellium
- 12.1.8.1. Company Overview
- 12.1.8.2. Products
- 12.1.8.3. Company Financials
- 12.1.8.4. SWOT Analysis
- 12.1.9 Stena Metall AB
- 12.1.9.1. Company Overview
- 12.1.9.2. Products
- 12.1.9.3. Company Financials
- 12.1.9.4. SWOT Analysis
- 12.1.10 Norsk Hydro Asa
- 12.1.10.1. Company Overview
- 12.1.10.2. Products
- 12.1.10.3. Company Financials
- 12.1.10.4. SWOT Analysis
- 12.1.11 Alcoa Corporation
- 12.1.11.1. Company Overview
- 12.1.11.2. Products
- 12.1.11.3. Company Financials
- 12.1.11.4. SWOT Analysis
- 12.1.12 Amag Austria Metall AG
- 12.1.12.1. Company Overview
- 12.1.12.2. Products
- 12.1.12.3. Company Financials
- 12.1.12.4. SWOT Analysis
- 12.1.1 Raffmetal Spa
- 12.2. Market Entropy
- 12.2.1 Company's Key Areas Served
- 12.2.2 Recent Developments
- 12.3. Company Market Share Analysis 2025
- 12.3.1 Top 5 Companies Market Share Analysis
- 12.3.2 Top 3 Companies Market Share Analysis
- 12.4. List of Potential Customers
- 13. Research Methodology
List of Figures
- Figure 1: Global Aluminum Recycling Market Revenue Breakdown (undefined, %) by Region 2025 & 2033
- Figure 2: Global Aluminum Recycling Market Volume Breakdown (K Tons, %) by Region 2025 & 2033
- Figure 3: Asia Pacific Aluminum Recycling Market Revenue (undefined), by Product Type 2025 & 2033
- Figure 4: Asia Pacific Aluminum Recycling Market Volume (K Tons), by Product Type 2025 & 2033
- Figure 5: Asia Pacific Aluminum Recycling Market Revenue Share (%), by Product Type 2025 & 2033
- Figure 6: Asia Pacific Aluminum Recycling Market Volume Share (%), by Product Type 2025 & 2033
- Figure 7: Asia Pacific Aluminum Recycling Market Revenue (undefined), by End-user Industry 2025 & 2033
- Figure 8: Asia Pacific Aluminum Recycling Market Volume (K Tons), by End-user Industry 2025 & 2033
- Figure 9: Asia Pacific Aluminum Recycling Market Revenue Share (%), by End-user Industry 2025 & 2033
- Figure 10: Asia Pacific Aluminum Recycling Market Volume Share (%), by End-user Industry 2025 & 2033
- Figure 11: Asia Pacific Aluminum Recycling Market Revenue (undefined), by Country 2025 & 2033
- Figure 12: Asia Pacific Aluminum Recycling Market Volume (K Tons), by Country 2025 & 2033
- Figure 13: Asia Pacific Aluminum Recycling Market Revenue Share (%), by Country 2025 & 2033
- Figure 14: Asia Pacific Aluminum Recycling Market Volume Share (%), by Country 2025 & 2033
- Figure 15: North America Aluminum Recycling Market Revenue (undefined), by Product Type 2025 & 2033
- Figure 16: North America Aluminum Recycling Market Volume (K Tons), by Product Type 2025 & 2033
- Figure 17: North America Aluminum Recycling Market Revenue Share (%), by Product Type 2025 & 2033
- Figure 18: North America Aluminum Recycling Market Volume Share (%), by Product Type 2025 & 2033
- Figure 19: North America Aluminum Recycling Market Revenue (undefined), by End-user Industry 2025 & 2033
- Figure 20: North America Aluminum Recycling Market Volume (K Tons), by End-user Industry 2025 & 2033
- Figure 21: North America Aluminum Recycling Market Revenue Share (%), by End-user Industry 2025 & 2033
- Figure 22: North America Aluminum Recycling Market Volume Share (%), by End-user Industry 2025 & 2033
- Figure 23: North America Aluminum Recycling Market Revenue (undefined), by Country 2025 & 2033
- Figure 24: North America Aluminum Recycling Market Volume (K Tons), by Country 2025 & 2033
- Figure 25: North America Aluminum Recycling Market Revenue Share (%), by Country 2025 & 2033
- Figure 26: North America Aluminum Recycling Market Volume Share (%), by Country 2025 & 2033
- Figure 27: Europe Aluminum Recycling Market Revenue (undefined), by Product Type 2025 & 2033
- Figure 28: Europe Aluminum Recycling Market Volume (K Tons), by Product Type 2025 & 2033
- Figure 29: Europe Aluminum Recycling Market Revenue Share (%), by Product Type 2025 & 2033
- Figure 30: Europe Aluminum Recycling Market Volume Share (%), by Product Type 2025 & 2033
- Figure 31: Europe Aluminum Recycling Market Revenue (undefined), by End-user Industry 2025 & 2033
- Figure 32: Europe Aluminum Recycling Market Volume (K Tons), by End-user Industry 2025 & 2033
- Figure 33: Europe Aluminum Recycling Market Revenue Share (%), by End-user Industry 2025 & 2033
- Figure 34: Europe Aluminum Recycling Market Volume Share (%), by End-user Industry 2025 & 2033
- Figure 35: Europe Aluminum Recycling Market Revenue (undefined), by Country 2025 & 2033
- Figure 36: Europe Aluminum Recycling Market Volume (K Tons), by Country 2025 & 2033
- Figure 37: Europe Aluminum Recycling Market Revenue Share (%), by Country 2025 & 2033
- Figure 38: Europe Aluminum Recycling Market Volume Share (%), by Country 2025 & 2033
- Figure 39: South America Aluminum Recycling Market Revenue (undefined), by Product Type 2025 & 2033
- Figure 40: South America Aluminum Recycling Market Volume (K Tons), by Product Type 2025 & 2033
- Figure 41: South America Aluminum Recycling Market Revenue Share (%), by Product Type 2025 & 2033
- Figure 42: South America Aluminum Recycling Market Volume Share (%), by Product Type 2025 & 2033
- Figure 43: South America Aluminum Recycling Market Revenue (undefined), by End-user Industry 2025 & 2033
- Figure 44: South America Aluminum Recycling Market Volume (K Tons), by End-user Industry 2025 & 2033
- Figure 45: South America Aluminum Recycling Market Revenue Share (%), by End-user Industry 2025 & 2033
- Figure 46: South America Aluminum Recycling Market Volume Share (%), by End-user Industry 2025 & 2033
- Figure 47: South America Aluminum Recycling Market Revenue (undefined), by Country 2025 & 2033
- Figure 48: South America Aluminum Recycling Market Volume (K Tons), by Country 2025 & 2033
- Figure 49: South America Aluminum Recycling Market Revenue Share (%), by Country 2025 & 2033
- Figure 50: South America Aluminum Recycling Market Volume Share (%), by Country 2025 & 2033
- Figure 51: Middle East and Africa Aluminum Recycling Market Revenue (undefined), by Product Type 2025 & 2033
- Figure 52: Middle East and Africa Aluminum Recycling Market Volume (K Tons), by Product Type 2025 & 2033
- Figure 53: Middle East and Africa Aluminum Recycling Market Revenue Share (%), by Product Type 2025 & 2033
- Figure 54: Middle East and Africa Aluminum Recycling Market Volume Share (%), by Product Type 2025 & 2033
- Figure 55: Middle East and Africa Aluminum Recycling Market Revenue (undefined), by End-user Industry 2025 & 2033
- Figure 56: Middle East and Africa Aluminum Recycling Market Volume (K Tons), by End-user Industry 2025 & 2033
- Figure 57: Middle East and Africa Aluminum Recycling Market Revenue Share (%), by End-user Industry 2025 & 2033
- Figure 58: Middle East and Africa Aluminum Recycling Market Volume Share (%), by End-user Industry 2025 & 2033
- Figure 59: Middle East and Africa Aluminum Recycling Market Revenue (undefined), by Country 2025 & 2033
- Figure 60: Middle East and Africa Aluminum Recycling Market Volume (K Tons), by Country 2025 & 2033
- Figure 61: Middle East and Africa Aluminum Recycling Market Revenue Share (%), by Country 2025 & 2033
- Figure 62: Middle East and Africa Aluminum Recycling Market Volume Share (%), by Country 2025 & 2033
List of Tables
- Table 1: Global Aluminum Recycling Market Revenue undefined Forecast, by Product Type 2020 & 2033
- Table 2: Global Aluminum Recycling Market Volume K Tons Forecast, by Product Type 2020 & 2033
- Table 3: Global Aluminum Recycling Market Revenue undefined Forecast, by End-user Industry 2020 & 2033
- Table 4: Global Aluminum Recycling Market Volume K Tons Forecast, by End-user Industry 2020 & 2033
- Table 5: Global Aluminum Recycling Market Revenue undefined Forecast, by Region 2020 & 2033
- Table 6: Global Aluminum Recycling Market Volume K Tons Forecast, by Region 2020 & 2033
- Table 7: Global Aluminum Recycling Market Revenue undefined Forecast, by Product Type 2020 & 2033
- Table 8: Global Aluminum Recycling Market Volume K Tons Forecast, by Product Type 2020 & 2033
- Table 9: Global Aluminum Recycling Market Revenue undefined Forecast, by End-user Industry 2020 & 2033
- Table 10: Global Aluminum Recycling Market Volume K Tons Forecast, by End-user Industry 2020 & 2033
- Table 11: Global Aluminum Recycling Market Revenue undefined Forecast, by Country 2020 & 2033
- Table 12: Global Aluminum Recycling Market Volume K Tons Forecast, by Country 2020 & 2033
- Table 13: China Aluminum Recycling Market Revenue (undefined) Forecast, by Application 2020 & 2033
- Table 14: China Aluminum Recycling Market Volume (K Tons) Forecast, by Application 2020 & 2033
- Table 15: India Aluminum Recycling Market Revenue (undefined) Forecast, by Application 2020 & 2033
- Table 16: India Aluminum Recycling Market Volume (K Tons) Forecast, by Application 2020 & 2033
- Table 17: Japan Aluminum Recycling Market Revenue (undefined) Forecast, by Application 2020 & 2033
- Table 18: Japan Aluminum Recycling Market Volume (K Tons) Forecast, by Application 2020 & 2033
- Table 19: South Korea Aluminum Recycling Market Revenue (undefined) Forecast, by Application 2020 & 2033
- Table 20: South Korea Aluminum Recycling Market Volume (K Tons) Forecast, by Application 2020 & 2033
- Table 21: Malaysia Aluminum Recycling Market Revenue (undefined) Forecast, by Application 2020 & 2033
- Table 22: Malaysia Aluminum Recycling Market Volume (K Tons) Forecast, by Application 2020 & 2033
- Table 23: Thailand Aluminum Recycling Market Revenue (undefined) Forecast, by Application 2020 & 2033
- Table 24: Thailand Aluminum Recycling Market Volume (K Tons) Forecast, by Application 2020 & 2033
- Table 25: Indonesia Aluminum Recycling Market Revenue (undefined) Forecast, by Application 2020 & 2033
- Table 26: Indonesia Aluminum Recycling Market Volume (K Tons) Forecast, by Application 2020 & 2033
- Table 27: Vietnam Aluminum Recycling Market Revenue (undefined) Forecast, by Application 2020 & 2033
- Table 28: Vietnam Aluminum Recycling Market Volume (K Tons) Forecast, by Application 2020 & 2033
- Table 29: Rest of Asia Pacific Aluminum Recycling Market Revenue (undefined) Forecast, by Application 2020 & 2033
- Table 30: Rest of Asia Pacific Aluminum Recycling Market Volume (K Tons) Forecast, by Application 2020 & 2033
- Table 31: Global Aluminum Recycling Market Revenue undefined Forecast, by Product Type 2020 & 2033
- Table 32: Global Aluminum Recycling Market Volume K Tons Forecast, by Product Type 2020 & 2033
- Table 33: Global Aluminum Recycling Market Revenue undefined Forecast, by End-user Industry 2020 & 2033
- Table 34: Global Aluminum Recycling Market Volume K Tons Forecast, by End-user Industry 2020 & 2033
- Table 35: Global Aluminum Recycling Market Revenue undefined Forecast, by Country 2020 & 2033
- Table 36: Global Aluminum Recycling Market Volume K Tons Forecast, by Country 2020 & 2033
- Table 37: United States Aluminum Recycling Market Revenue (undefined) Forecast, by Application 2020 & 2033
- Table 38: United States Aluminum Recycling Market Volume (K Tons) Forecast, by Application 2020 & 2033
- Table 39: Canada Aluminum Recycling Market Revenue (undefined) Forecast, by Application 2020 & 2033
- Table 40: Canada Aluminum Recycling Market Volume (K Tons) Forecast, by Application 2020 & 2033
- Table 41: Mexico Aluminum Recycling Market Revenue (undefined) Forecast, by Application 2020 & 2033
- Table 42: Mexico Aluminum Recycling Market Volume (K Tons) Forecast, by Application 2020 & 2033
- Table 43: Global Aluminum Recycling Market Revenue undefined Forecast, by Product Type 2020 & 2033
- Table 44: Global Aluminum Recycling Market Volume K Tons Forecast, by Product Type 2020 & 2033
- Table 45: Global Aluminum Recycling Market Revenue undefined Forecast, by End-user Industry 2020 & 2033
- Table 46: Global Aluminum Recycling Market Volume K Tons Forecast, by End-user Industry 2020 & 2033
- Table 47: Global Aluminum Recycling Market Revenue undefined Forecast, by Country 2020 & 2033
- Table 48: Global Aluminum Recycling Market Volume K Tons Forecast, by Country 2020 & 2033
- Table 49: Germany Aluminum Recycling Market Revenue (undefined) Forecast, by Application 2020 & 2033
- Table 50: Germany Aluminum Recycling Market Volume (K Tons) Forecast, by Application 2020 & 2033
- Table 51: United Kingdom Aluminum Recycling Market Revenue (undefined) Forecast, by Application 2020 & 2033
- Table 52: United Kingdom Aluminum Recycling Market Volume (K Tons) Forecast, by Application 2020 & 2033
- Table 53: France Aluminum Recycling Market Revenue (undefined) Forecast, by Application 2020 & 2033
- Table 54: France Aluminum Recycling Market Volume (K Tons) Forecast, by Application 2020 & 2033
- Table 55: Italy Aluminum Recycling Market Revenue (undefined) Forecast, by Application 2020 & 2033
- Table 56: Italy Aluminum Recycling Market Volume (K Tons) Forecast, by Application 2020 & 2033
- Table 57: Spain Aluminum Recycling Market Revenue (undefined) Forecast, by Application 2020 & 2033
- Table 58: Spain Aluminum Recycling Market Volume (K Tons) Forecast, by Application 2020 & 2033
- Table 59: Nordic Countries Aluminum Recycling Market Revenue (undefined) Forecast, by Application 2020 & 2033
- Table 60: Nordic Countries Aluminum Recycling Market Volume (K Tons) Forecast, by Application 2020 & 2033
- Table 61: Turkey Aluminum Recycling Market Revenue (undefined) Forecast, by Application 2020 & 2033
- Table 62: Turkey Aluminum Recycling Market Volume (K Tons) Forecast, by Application 2020 & 2033
- Table 63: Russia Aluminum Recycling Market Revenue (undefined) Forecast, by Application 2020 & 2033
- Table 64: Russia Aluminum Recycling Market Volume (K Tons) Forecast, by Application 2020 & 2033
- Table 65: Rest of Europe Aluminum Recycling Market Revenue (undefined) Forecast, by Application 2020 & 2033
- Table 66: Rest of Europe Aluminum Recycling Market Volume (K Tons) Forecast, by Application 2020 & 2033
- Table 67: Global Aluminum Recycling Market Revenue undefined Forecast, by Product Type 2020 & 2033
- Table 68: Global Aluminum Recycling Market Volume K Tons Forecast, by Product Type 2020 & 2033
- Table 69: Global Aluminum Recycling Market Revenue undefined Forecast, by End-user Industry 2020 & 2033
- Table 70: Global Aluminum Recycling Market Volume K Tons Forecast, by End-user Industry 2020 & 2033
- Table 71: Global Aluminum Recycling Market Revenue undefined Forecast, by Country 2020 & 2033
- Table 72: Global Aluminum Recycling Market Volume K Tons Forecast, by Country 2020 & 2033
- Table 73: Brazil Aluminum Recycling Market Revenue (undefined) Forecast, by Application 2020 & 2033
- Table 74: Brazil Aluminum Recycling Market Volume (K Tons) Forecast, by Application 2020 & 2033
- Table 75: Argentina Aluminum Recycling Market Revenue (undefined) Forecast, by Application 2020 & 2033
- Table 76: Argentina Aluminum Recycling Market Volume (K Tons) Forecast, by Application 2020 & 2033
- Table 77: Colombia Aluminum Recycling Market Revenue (undefined) Forecast, by Application 2020 & 2033
- Table 78: Colombia Aluminum Recycling Market Volume (K Tons) Forecast, by Application 2020 & 2033
- Table 79: Rest of South America Aluminum Recycling Market Revenue (undefined) Forecast, by Application 2020 & 2033
- Table 80: Rest of South America Aluminum Recycling Market Volume (K Tons) Forecast, by Application 2020 & 2033
- Table 81: Global Aluminum Recycling Market Revenue undefined Forecast, by Product Type 2020 & 2033
- Table 82: Global Aluminum Recycling Market Volume K Tons Forecast, by Product Type 2020 & 2033
- Table 83: Global Aluminum Recycling Market Revenue undefined Forecast, by End-user Industry 2020 & 2033
- Table 84: Global Aluminum Recycling Market Volume K Tons Forecast, by End-user Industry 2020 & 2033
- Table 85: Global Aluminum Recycling Market Revenue undefined Forecast, by Country 2020 & 2033
- Table 86: Global Aluminum Recycling Market Volume K Tons Forecast, by Country 2020 & 2033
- Table 87: Saudi Arabia Aluminum Recycling Market Revenue (undefined) Forecast, by Application 2020 & 2033
- Table 88: Saudi Arabia Aluminum Recycling Market Volume (K Tons) Forecast, by Application 2020 & 2033
- Table 89: Qatar Aluminum Recycling Market Revenue (undefined) Forecast, by Application 2020 & 2033
- Table 90: Qatar Aluminum Recycling Market Volume (K Tons) Forecast, by Application 2020 & 2033
- Table 91: United Arab Emirates Aluminum Recycling Market Revenue (undefined) Forecast, by Application 2020 & 2033
- Table 92: United Arab Emirates Aluminum Recycling Market Volume (K Tons) Forecast, by Application 2020 & 2033
- Table 93: Nigeria Aluminum Recycling Market Revenue (undefined) Forecast, by Application 2020 & 2033
- Table 94: Nigeria Aluminum Recycling Market Volume (K Tons) Forecast, by Application 2020 & 2033
- Table 95: Egypt Aluminum Recycling Market Revenue (undefined) Forecast, by Application 2020 & 2033
- Table 96: Egypt Aluminum Recycling Market Volume (K Tons) Forecast, by Application 2020 & 2033
- Table 97: South Africa Aluminum Recycling Market Revenue (undefined) Forecast, by Application 2020 & 2033
- Table 98: South Africa Aluminum Recycling Market Volume (K Tons) Forecast, by Application 2020 & 2033
- Table 99: Rest of Middle East and Africa Aluminum Recycling Market Revenue (undefined) Forecast, by Application 2020 & 2033
- Table 100: Rest of Middle East and Africa Aluminum Recycling Market Volume (K Tons) Forecast, by Application 2020 & 2033
Frequently Asked Questions
1. What is the projected Compound Annual Growth Rate (CAGR) of the Aluminum Recycling Market?
The projected CAGR is approximately 11.4%.
2. Which companies are prominent players in the Aluminum Recycling Market?
Key companies in the market include Raffmetal Spa, Novelis, Kuusakoski OY, Ye Chiu Group, Matalco Inc, Speira Gmbh, Real Alloy, Constellium, Stena Metall AB, Norsk Hydro Asa, Alcoa Corporation, Amag Austria Metall AG.
3. What are the main segments of the Aluminum Recycling Market?
The market segments include Product Type, End-user Industry.
4. Can you provide details about the market size?
The market size is estimated to be USD XXX N/A as of 2022.
5. What are some drivers contributing to market growth?
Growing Utilization of Recycled Aluminum in the Construction Industry; Growing Demand for Recycled Aluminum from the Automotive Industry.
6. What are the notable trends driving market growth?
Increasing Demand from the Building and Construction Industry.
7. Are there any restraints impacting market growth?
Presence of Undesirable Impurities Like Iron.
8. Can you provide examples of recent developments in the market?
In January 2024, Novelis Inc. signed a new contract with Ardagh Metal Packaging USA Corp., a global supplier of sustainable aluminum beverage packaging solutions. Under the contract, Novelis will supply aluminum beverage packaging sheets to Ardagh's metal production facilities in North America.
9. What pricing options are available for accessing the report?
Pricing options include single-user, multi-user, and enterprise licenses priced at USD 4750, USD 5250, and USD 8750 respectively.
10. Is the market size provided in terms of value or volume?
The market size is provided in terms of value, measured in N/A and volume, measured in K Tons.
11. Are there any specific market keywords associated with the report?
Yes, the market keyword associated with the report is "Aluminum Recycling Market," which aids in identifying and referencing the specific market segment covered.
12. How do I determine which pricing option suits my needs best?
The pricing options vary based on user requirements and access needs. Individual users may opt for single-user licenses, while businesses requiring broader access may choose multi-user or enterprise licenses for cost-effective access to the report.
13. Are there any additional resources or data provided in the Aluminum Recycling Market report?
While the report offers comprehensive insights, it's advisable to review the specific contents or supplementary materials provided to ascertain if additional resources or data are available.
14. How can I stay updated on further developments or reports in the Aluminum Recycling Market?
To stay informed about further developments, trends, and reports in the Aluminum Recycling Market, consider subscribing to industry newsletters, following relevant companies and organizations, or regularly checking reputable industry news sources and publications.
Methodology
Step 1 - Identification of Relevant Samples Size from Population Database


Step 2 - Approaches for Defining Global Market Size (Value, Volume* & Price*)

Note*: In applicable scenarios
Step 3 - Data Sources
Primary Research
- Web Analytics
- Survey Reports
- Research Institute
- Latest Research Reports
- Opinion Leaders
Secondary Research
- Annual Reports
- White Paper
- Latest Press Release
- Industry Association
- Paid Database
- Investor Presentations

Step 4 - Data Triangulation
Involves using different sources of information in order to increase the validity of a study
These sources are likely to be stakeholders in a program - participants, other researchers, program staff, other community members, and so on.
Then we put all data in single framework & apply various statistical tools to find out the dynamic on the market.
During the analysis stage, feedback from the stakeholder groups would be compared to determine areas of agreement as well as areas of divergence