

Key Insights
The global Industrial Insulation market is poised for robust growth, projected to reach a significant market size of USD 7.41 billion by 2025. This expansion is fueled by a compelling Compound Annual Growth Rate (CAGR) exceeding 5.00%, indicating a sustained upward trajectory throughout the forecast period extending to 2033. A primary driver for this market surge is the escalating demand for energy efficiency across various industrial sectors. As global energy costs continue to rise and environmental regulations tighten, industries are increasingly investing in insulation solutions to minimize heat loss and gain, thereby reducing operational expenses and their carbon footprint. Key end-user industries such as Chemical and Petrochemical, Oil and Gas, and Power Generation are at the forefront of this adoption, recognizing insulation as a critical component for operational stability and cost management. Furthermore, the automotive sector's push towards lighter, more fuel-efficient vehicles, coupled with stringent noise reduction requirements, is also contributing to the growth in specialized industrial insulation applications. Emerging economies, particularly in the Asia Pacific region, represent significant growth pockets due to rapid industrialization and infrastructure development.
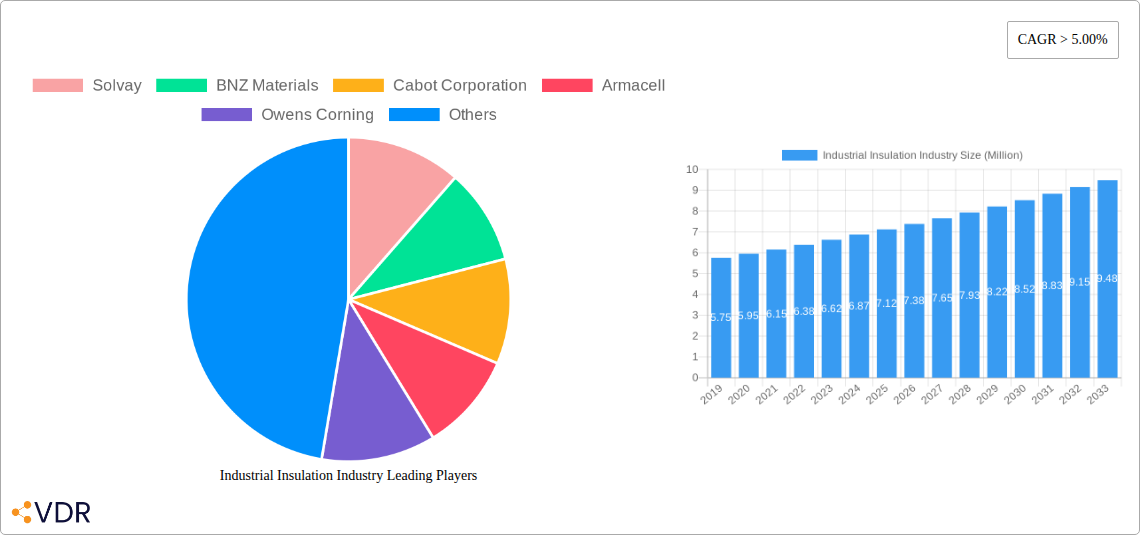
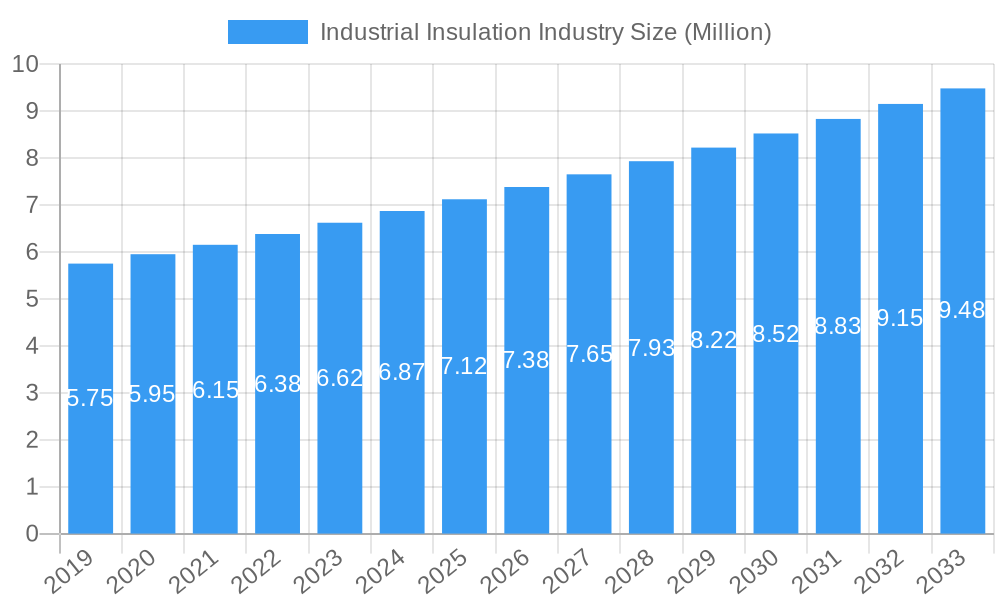
Industrial Insulation Industry Market Size (In Million)
The market's segmentation reveals a dynamic landscape driven by product innovation and material advancements. Mineral wool and fiberglass continue to dominate the insulation material segment, offering excellent thermal and acoustic properties. However, foamed plastics and calcium silicate are gaining traction due to their specialized applications, such as high-temperature resistance and improved fire safety. In terms of product form, blankets and boards are widely adopted for large-scale applications, while pipe insulation is crucial for energy-intensive processes. The competitive landscape is characterized by the presence of both established global players like Owens Corning, BASF SE, and Rockwool A/S, and specialized regional manufacturers such as Solvay and Armacell. These companies are actively engaged in research and development to introduce advanced insulation materials with enhanced performance characteristics and improved sustainability profiles. Strategic collaborations, mergers, and acquisitions are also expected to shape the market, as companies seek to expand their product portfolios and geographical reach. The industry faces challenges such as fluctuating raw material prices and the need for skilled labor for installation, but the overarching trend of energy conservation and operational optimization strongly supports continued market expansion.
Industrial Insulation Industry Company Market Share
Industrial Insulation Industry: Market Size, Trends, and Growth Outlook (2019-2033)
This comprehensive report provides an in-depth analysis of the global Industrial Insulation Market, offering critical insights into market dynamics, growth trajectories, and key industry developments. Covering a study period from 2019 to 2033, with a base year of 2025, this report details market size evolution, segment analysis, and forecasts to empower strategic decision-making for stakeholders. The industrial insulation market is segmented by insulation material (Mineral Wool, Fiber Glass, Foamed Plastics, Calcium Silicate, Other Insulation Materials), product (Blanket, Board, Pipe, Other Products), and end-user industry (Automotive, Chemical and Petrochemical, Construction, Electrical and Electronics, Oil and Gas, Power Generation, Other End-user Industries). Parent and child market analysis will further illuminate specific growth avenues within the broader industrial insulation sector.
Industrial Insulation Industry Market Dynamics & Structure
The industrial insulation market exhibits a moderately concentrated structure, with a few major players holding significant market share, alongside a considerable number of smaller regional and specialized providers. Technological innovation is a primary driver, focusing on enhanced thermal performance, fire resistance, and eco-friendly materials, influenced by stricter energy efficiency regulations and growing awareness of sustainability in industrial processes. Competitive product substitutes are emerging, particularly from advanced composite materials, though traditional mineral wool insulation and fiberglass insulation remain dominant due to their cost-effectiveness and established performance. End-user demographics are shifting, with increasing demand from burgeoning sectors like renewable energy and data centers, complementing established markets such as oil and gas insulation and chemical industry insulation. Mergers and acquisitions (M&A) are key strategic moves, aimed at expanding geographic footprints, diversifying product portfolios, and consolidating market position. For instance, the acquisition of Aislamientos y Envases SL by BEWI in November 2022 underscores this trend. The industry faces innovation barriers related to high R&D costs for novel materials and the lengthy certification processes required for new industrial applications.
- Market Concentration: Moderately concentrated, with key players like Owens Corning, Knauf Insulation, and Rockwool A/S dominating.
- Technological Innovation Drivers:
- Enhanced thermal performance for energy saving in industrial facilities.
- Improved fire safety features in high-temperature insulation.
- Development of sustainable and recyclable insulation materials.
- Advancements in cryogenic insulation for specialized applications.
- Regulatory Frameworks: Increasing stringency in building codes and industrial energy efficiency standards globally.
- Competitive Product Substitutes: Advanced composites, aerogels, and vacuum insulation panels are emerging alternatives.
- End-User Demographics: Growth in renewable energy, data centers, and stringent environmental compliance in petrochemical insulation.
- M&A Trends: Consolidation for market access and product portfolio expansion.
Industrial Insulation Industry Growth Trends & Insights
The industrial insulation market is poised for robust growth, driven by a confluence of factors including escalating global energy demand, stringent environmental policies, and a persistent focus on operational efficiency across various industrial sectors. The market size is projected to expand at a notable Compound Annual Growth Rate (CAGR) during the forecast period. Adoption rates for advanced insulation solutions are accelerating, particularly in regions with aggressive decarbonization targets and a strong emphasis on industrial energy management. Technological disruptions, such as the development of smart insulation materials that can monitor temperature and humidity, are beginning to influence consumer behavior and purchasing decisions. End-users are increasingly prioritizing long-term cost savings through reduced energy consumption and lower maintenance requirements, alongside adherence to sustainability in industrial construction and operations. The shift towards electrification in industries like automotive also creates new demand for specialized electrical insulation and thermal management solutions. Consumer behavior is evolving towards a more holistic approach, considering the lifecycle cost and environmental impact of insulation materials. The estimated market size for 2025 stands at approximately USD 28,500 Million, with projections indicating a significant upward trajectory driven by these trends. The market penetration of high-performance insulation materials is steadily increasing, reflecting a growing industry-wide commitment to sustainability and efficiency.
Dominant Regions, Countries, or Segments in Industrial Insulation Industry
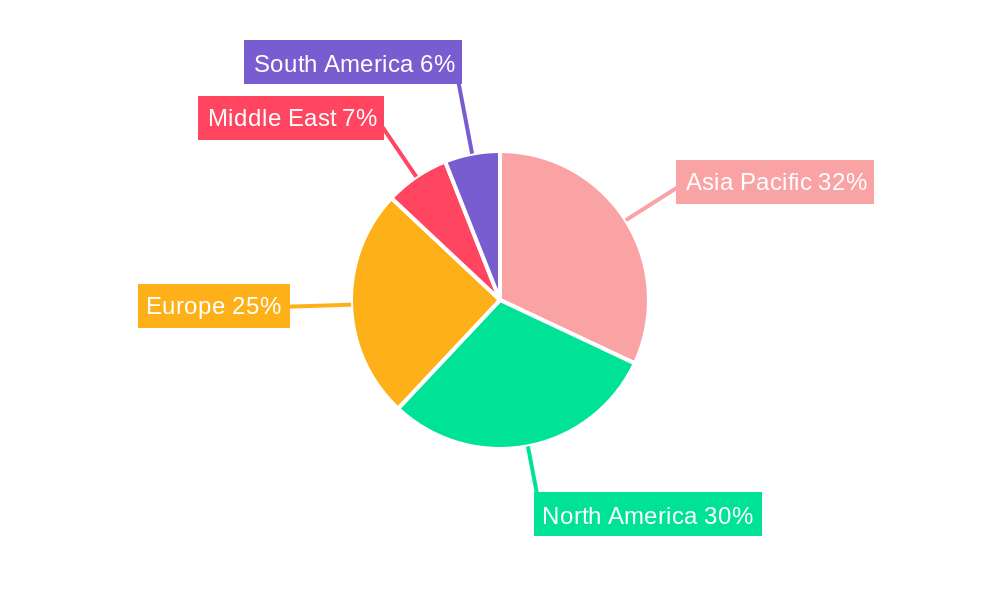
The global industrial insulation market is experiencing dominance from several key regions and segments. North America and Europe are currently leading markets, driven by mature industrial bases, stringent environmental regulations, and substantial investments in infrastructure and energy efficiency upgrades. The construction industry remains a cornerstone of demand, with significant growth in commercial and industrial building insulation. Within insulation materials, mineral wool and fiber glass continue to hold the largest market share due to their versatility, fire resistance, and cost-effectiveness, particularly for applications in power generation insulation and chemical and petrochemical insulation. The oil and gas sector also represents a significant demand driver, especially in regions with extensive upstream and downstream operations.
In terms of product segments, pipe insulation and blanket insulation are particularly dominant, catering to the widespread need for thermal and acoustic control in industrial piping systems and large equipment. However, the foamed plastics segment, especially Polyurethane (PU) and Expanded Polystyrene (EPS), is witnessing substantial growth, driven by their excellent thermal insulation properties and lightweight nature, finding increasing application in construction and refrigeration.
The Asia-Pacific region is emerging as the fastest-growing market, fueled by rapid industrialization, burgeoning construction activities, and government initiatives promoting energy conservation. Countries like China and India are major contributors to this growth, with substantial investments in manufacturing, energy infrastructure, and transportation, driving demand for automotive insulation, electrical and electronics insulation, and general industrial applications.
- Leading Region: North America and Europe, followed by the rapidly growing Asia-Pacific region.
- Dominant Insulation Materials: Mineral Wool and Fiber Glass, with strong growth in Foamed Plastics.
- Key Product Segments: Blanket and Pipe Insulation, with increasing adoption of Boards.
- Major End-User Industries: Construction, Oil and Gas, and Chemical & Petrochemical sectors are primary demand generators.
- Asia-Pacific Growth Drivers: Rapid industrialization, government support for energy efficiency, and infrastructure development.
- Market Share Insight: Mineral Wool estimated to hold approximately 30% of the insulation material market in 2025. Fiber Glass follows closely with around 28%.
- Growth Potential: Asia-Pacific projected to witness a CAGR of 6.5% in the industrial insulation market over the forecast period.
Industrial Insulation Industry Product Landscape
The industrial insulation product landscape is characterized by continuous innovation focused on enhancing thermal performance, durability, and environmental sustainability. Mineral wool insulation and fiberglass insulation remain foundational, offering excellent fire resistance and acoustic properties for a wide range of industrial applications, from high-temperature furnaces in the chemical sector to cryogenic storage in the oil and gas industry. Foamed plastics, particularly rigid polyurethane (PU) and polyisocyanurate (PIR) foams, are gaining traction due to their superior R-values per inch and suitability for complex shapes and space-constrained environments in sectors like automotive insulation. Advanced materials like calcium silicate are crucial for extreme temperature applications, such as in refractories and high-pressure steam systems. Emerging products include vacuum insulation panels (VIPs) offering ultra-thin profiles with exceptional thermal resistance, and bio-based insulation materials derived from renewable resources, aligning with increasing demand for sustainable solutions. Performance metrics such as thermal conductivity (k-value), fire rating, and moisture resistance are key differentiators, driving product development and application suitability.
Key Drivers, Barriers & Challenges in Industrial Insulation Industry
The industrial insulation market is propelled by several key drivers. Rising global energy prices and a growing imperative for energy efficiency in industrial operations are paramount. Stricter environmental regulations and a global push towards sustainability are incentivizing the adoption of advanced insulation solutions to reduce carbon footprints. The expansion of key end-user industries, including oil and gas, chemical and petrochemical, and construction, directly fuels demand. Technological advancements in insulation materials offering higher performance and longer lifespans also act as significant catalysts.
However, the industry faces several barriers and challenges. High upfront costs associated with premium insulation materials and their installation can deter some businesses, especially small and medium-sized enterprises. Supply chain disruptions, material price volatility, and labor shortages can impact production and project timelines. Stringent and evolving regulatory frameworks, while a driver, can also present compliance challenges. Competition from alternative energy-saving technologies and a lack of awareness regarding the long-term economic benefits of superior insulation can also hinder market growth.
- Key Drivers:
- Escalating energy costs and demand for energy conservation.
- Stringent environmental regulations and sustainability initiatives.
- Growth in key industrial sectors (Oil & Gas, Petrochemical, Construction).
- Technological advancements in insulation materials.
- Barriers & Challenges:
- High initial investment costs.
- Supply chain volatility and material price fluctuations.
- Labor shortages and skilled workforce requirements.
- Complex regulatory compliance.
Emerging Opportunities in Industrial Insulation Industry
The industrial insulation industry is ripe with emerging opportunities, particularly in the burgeoning renewable energy sector. Wind turbines, solar panel installations, and geothermal energy systems require specialized insulation solutions to optimize performance and efficiency, presenting a significant growth avenue. The expansion of data centers, driven by digital transformation, creates demand for advanced thermal management and acoustic insulation. Furthermore, the growing focus on retrofitting older industrial facilities for improved energy efficiency offers substantial market potential. The development and adoption of bio-based and recycled insulation materials align with the circular economy principles and cater to the increasing demand for sustainable construction and industrial practices. Innovations in smart insulation, capable of self-monitoring and reporting, are also poised to open new application frontiers. The global push towards electrification of transport, including electric vehicles and heavy-duty transportation, will also necessitate advanced thermal management and insulation solutions.
Growth Accelerators in the Industrial Insulation Industry Industry
Several growth accelerators are poised to significantly propel the industrial insulation industry forward. The increasing global commitment to net-zero emissions targets and the subsequent drive for decarbonization across all industrial sectors are fundamental growth catalysts. Significant investments in renewable energy infrastructure worldwide are creating substantial demand for specialized insulation materials that enhance performance and durability. Strategic partnerships between insulation manufacturers and end-user industries are fostering the development of tailored solutions, accelerating product adoption. Market expansion into developing economies, driven by rapid industrialization and increasing awareness of energy efficiency benefits, represents a major growth frontier. The continuous development of innovative insulation technologies, such as higher R-value materials and fire-resistant composites, will further stimulate market growth by offering superior performance and expanded application possibilities, thereby accelerating the adoption of advanced insulation systems.
Key Players Shaping the Industrial Insulation Industry Market
- Solvay
- BNZ Materials
- Cabot Corporation
- Armacell
- Owens Corning
- BASF SE
- Rockwool A/S
- Knauf Insulation
- Temati Group
- INSUL-FAB
- Johns Manville-Berkshire Hathway Company
- Jays Refractory Specialists
Notable Milestones in Industrial Insulation Industry Sector
- November 2022: BEWI acquired Aislamientos y Envases SL, a Spanish insulation company specializing in EPS-based products for packaging and industrial applications. This acquisition aimed to expand BEWI's geographic reach and strengthen its insulation solutions portfolio in Spain.
- October 2022: Knauf Group announced a significant investment of close to EUR 135 million (~USD 133.4 million) to increase its mineral wool (insulation) production capacity in Central and Eastern Europe. The investment will fund the retrofitting of an existing plant and the construction of a new facility at Knauf Insulation's site in Tarnaveni, Romania, with the new facility expected to be operational by 2024.
In-Depth Industrial Insulation Industry Market Outlook
The industrial insulation market is set for a period of sustained expansion, underpinned by critical growth accelerators. The intensifying global focus on energy conservation and emissions reduction is compelling industries to invest in advanced insulation technologies to optimize operational efficiency and meet sustainability mandates. The rapid development and deployment of renewable energy sources, coupled with ongoing infrastructure projects worldwide, are creating substantial demand for specialized insulation materials that can withstand diverse environmental conditions and enhance system performance. Strategic collaborations between insulation providers and key industrial players are fostering the innovation and customization of solutions, accelerating market penetration. Furthermore, the burgeoning industrial sectors in emerging economies present significant untapped potential, driven by increasing investments in manufacturing and energy infrastructure. Continuous technological advancements in insulation materials, promising higher thermal performance, enhanced durability, and improved fire safety, will serve as a vital engine for market growth, driving the adoption of more sophisticated and environmentally conscious insulation solutions. The estimated market size for 2033 is projected to reach approximately USD 42,000 Million.
Industrial Insulation Industry Segmentation
-
1. Insulation Material
- 1.1. Mineral Wool
- 1.2. Fiber Glass
- 1.3. Foamed Plastics
- 1.4. Calcium Silicate
- 1.5. Other Insulation Materials
-
2. Product
- 2.1. Blanket
- 2.2. Board
- 2.3. Pipe
- 2.4. Other Products
-
3. End-user Industry
- 3.1. Automotive
- 3.2. Chemical and Petrochemical
- 3.3. Construction
- 3.4. Electrical and Electronics
- 3.5. Oil and Gas
- 3.6. Power Generation
- 3.7. Other End-user Industries
Industrial Insulation Industry Segmentation By Geography
-
1. Asia Pacific
- 1.1. China
- 1.2. India
- 1.3. Japan
- 1.4. South Korea
- 1.5. Rest of Asia Pacific
-
2. North America
- 2.1. United States
- 2.2. Canada
- 2.3. Mexico
-
3. Europe
- 3.1. Germany
- 3.2. United Kingdom
- 3.3. France
- 3.4. Italy
- 3.5. Rest of Europe
-
4. South America
- 4.1. Brazil
- 4.2. Argentina
- 4.3. Rest of South America
- 5. Middle East
-
6. Saudi Arabia
- 6.1. South Africa
- 6.2. Rest of Middle East
Industrial Insulation Industry Regional Market Share
Geographic Coverage of Industrial Insulation Industry
Industrial Insulation Industry REPORT HIGHLIGHTS
| Aspects | Details |
|---|---|
| Study Period | 2020-2034 |
| Base Year | 2025 |
| Estimated Year | 2026 |
| Forecast Period | 2026-2034 |
| Historical Period | 2020-2025 |
| Growth Rate | CAGR of > 5.00% from 2020-2034 |
| Segmentation |
|
Table of Contents
- 1. Introduction
- 1.1. Research Scope
- 1.2. Market Segmentation
- 1.3. Research Objective
- 1.4. Definitions and Assumptions
- 2. Executive Summary
- 2.1. Market Snapshot
- 3. Market Dynamics
- 3.1. Market Drivers
- 3.2. Market Restrains
- 3.3. Market Trends
- 3.4. Market Opportunities
- 4. Market Factor Analysis
- 4.1. Porters Five Forces
- 4.1.1. Bargaining Power of Suppliers
- 4.1.2. Bargaining Power of Buyers
- 4.1.3. Threat of New Entrants
- 4.1.4. Threat of Substitutes
- 4.1.5. Competitive Rivalry
- 4.2. PESTEL analysis
- 4.3. BCG Analysis
- 4.3.1. Stars (High Growth, High Market Share)
- 4.3.2. Cash Cows (Low Growth, High Market Share)
- 4.3.3. Question Mark (High Growth, Low Market Share)
- 4.3.4. Dogs (Low Growth, Low Market Share)
- 4.4. Ansoff Matrix Analysis
- 4.5. Supply Chain Analysis
- 4.6. Regulatory Landscape
- 4.7. Current Market Potential and Opportunity Assessment (TAM–SAM–SOM Framework)
- 4.8. VDR Analyst Note
- 4.1. Porters Five Forces
- 5. Market Analysis, Insights and Forecast 2021-2033
- 5.1. Market Analysis, Insights and Forecast - by Insulation Material
- 5.1.1. Mineral Wool
- 5.1.2. Fiber Glass
- 5.1.3. Foamed Plastics
- 5.1.4. Calcium Silicate
- 5.1.5. Other Insulation Materials
- 5.2. Market Analysis, Insights and Forecast - by Product
- 5.2.1. Blanket
- 5.2.2. Board
- 5.2.3. Pipe
- 5.2.4. Other Products
- 5.3. Market Analysis, Insights and Forecast - by End-user Industry
- 5.3.1. Automotive
- 5.3.2. Chemical and Petrochemical
- 5.3.3. Construction
- 5.3.4. Electrical and Electronics
- 5.3.5. Oil and Gas
- 5.3.6. Power Generation
- 5.3.7. Other End-user Industries
- 5.4. Market Analysis, Insights and Forecast - by Region
- 5.4.1. Asia Pacific
- 5.4.2. North America
- 5.4.3. Europe
- 5.4.4. South America
- 5.4.5. Middle East
- 5.4.6. Saudi Arabia
- 5.1. Market Analysis, Insights and Forecast - by Insulation Material
- 6. Global Industrial Insulation Industry Analysis, Insights and Forecast, 2021-2033
- 6.1. Market Analysis, Insights and Forecast - by Insulation Material
- 6.1.1. Mineral Wool
- 6.1.2. Fiber Glass
- 6.1.3. Foamed Plastics
- 6.1.4. Calcium Silicate
- 6.1.5. Other Insulation Materials
- 6.2. Market Analysis, Insights and Forecast - by Product
- 6.2.1. Blanket
- 6.2.2. Board
- 6.2.3. Pipe
- 6.2.4. Other Products
- 6.3. Market Analysis, Insights and Forecast - by End-user Industry
- 6.3.1. Automotive
- 6.3.2. Chemical and Petrochemical
- 6.3.3. Construction
- 6.3.4. Electrical and Electronics
- 6.3.5. Oil and Gas
- 6.3.6. Power Generation
- 6.3.7. Other End-user Industries
- 6.1. Market Analysis, Insights and Forecast - by Insulation Material
- 7. Asia Pacific Industrial Insulation Industry Analysis, Insights and Forecast, 2021-2033
- 7.1. Market Analysis, Insights and Forecast - by Insulation Material
- 7.1.1. Mineral Wool
- 7.1.2. Fiber Glass
- 7.1.3. Foamed Plastics
- 7.1.4. Calcium Silicate
- 7.1.5. Other Insulation Materials
- 7.2. Market Analysis, Insights and Forecast - by Product
- 7.2.1. Blanket
- 7.2.2. Board
- 7.2.3. Pipe
- 7.2.4. Other Products
- 7.3. Market Analysis, Insights and Forecast - by End-user Industry
- 7.3.1. Automotive
- 7.3.2. Chemical and Petrochemical
- 7.3.3. Construction
- 7.3.4. Electrical and Electronics
- 7.3.5. Oil and Gas
- 7.3.6. Power Generation
- 7.3.7. Other End-user Industries
- 7.1. Market Analysis, Insights and Forecast - by Insulation Material
- 8. North America Industrial Insulation Industry Analysis, Insights and Forecast, 2021-2033
- 8.1. Market Analysis, Insights and Forecast - by Insulation Material
- 8.1.1. Mineral Wool
- 8.1.2. Fiber Glass
- 8.1.3. Foamed Plastics
- 8.1.4. Calcium Silicate
- 8.1.5. Other Insulation Materials
- 8.2. Market Analysis, Insights and Forecast - by Product
- 8.2.1. Blanket
- 8.2.2. Board
- 8.2.3. Pipe
- 8.2.4. Other Products
- 8.3. Market Analysis, Insights and Forecast - by End-user Industry
- 8.3.1. Automotive
- 8.3.2. Chemical and Petrochemical
- 8.3.3. Construction
- 8.3.4. Electrical and Electronics
- 8.3.5. Oil and Gas
- 8.3.6. Power Generation
- 8.3.7. Other End-user Industries
- 8.1. Market Analysis, Insights and Forecast - by Insulation Material
- 9. Europe Industrial Insulation Industry Analysis, Insights and Forecast, 2021-2033
- 9.1. Market Analysis, Insights and Forecast - by Insulation Material
- 9.1.1. Mineral Wool
- 9.1.2. Fiber Glass
- 9.1.3. Foamed Plastics
- 9.1.4. Calcium Silicate
- 9.1.5. Other Insulation Materials
- 9.2. Market Analysis, Insights and Forecast - by Product
- 9.2.1. Blanket
- 9.2.2. Board
- 9.2.3. Pipe
- 9.2.4. Other Products
- 9.3. Market Analysis, Insights and Forecast - by End-user Industry
- 9.3.1. Automotive
- 9.3.2. Chemical and Petrochemical
- 9.3.3. Construction
- 9.3.4. Electrical and Electronics
- 9.3.5. Oil and Gas
- 9.3.6. Power Generation
- 9.3.7. Other End-user Industries
- 9.1. Market Analysis, Insights and Forecast - by Insulation Material
- 10. South America Industrial Insulation Industry Analysis, Insights and Forecast, 2021-2033
- 10.1. Market Analysis, Insights and Forecast - by Insulation Material
- 10.1.1. Mineral Wool
- 10.1.2. Fiber Glass
- 10.1.3. Foamed Plastics
- 10.1.4. Calcium Silicate
- 10.1.5. Other Insulation Materials
- 10.2. Market Analysis, Insights and Forecast - by Product
- 10.2.1. Blanket
- 10.2.2. Board
- 10.2.3. Pipe
- 10.2.4. Other Products
- 10.3. Market Analysis, Insights and Forecast - by End-user Industry
- 10.3.1. Automotive
- 10.3.2. Chemical and Petrochemical
- 10.3.3. Construction
- 10.3.4. Electrical and Electronics
- 10.3.5. Oil and Gas
- 10.3.6. Power Generation
- 10.3.7. Other End-user Industries
- 10.1. Market Analysis, Insights and Forecast - by Insulation Material
- 11. Middle East Industrial Insulation Industry Analysis, Insights and Forecast, 2021-2033
- 11.1. Market Analysis, Insights and Forecast - by Insulation Material
- 11.1.1. Mineral Wool
- 11.1.2. Fiber Glass
- 11.1.3. Foamed Plastics
- 11.1.4. Calcium Silicate
- 11.1.5. Other Insulation Materials
- 11.2. Market Analysis, Insights and Forecast - by Product
- 11.2.1. Blanket
- 11.2.2. Board
- 11.2.3. Pipe
- 11.2.4. Other Products
- 11.3. Market Analysis, Insights and Forecast - by End-user Industry
- 11.3.1. Automotive
- 11.3.2. Chemical and Petrochemical
- 11.3.3. Construction
- 11.3.4. Electrical and Electronics
- 11.3.5. Oil and Gas
- 11.3.6. Power Generation
- 11.3.7. Other End-user Industries
- 11.1. Market Analysis, Insights and Forecast - by Insulation Material
- 12. Saudi Arabia Industrial Insulation Industry Analysis, Insights and Forecast, 2021-2033
- 12.1. Market Analysis, Insights and Forecast - by Insulation Material
- 12.1.1. Mineral Wool
- 12.1.2. Fiber Glass
- 12.1.3. Foamed Plastics
- 12.1.4. Calcium Silicate
- 12.1.5. Other Insulation Materials
- 12.2. Market Analysis, Insights and Forecast - by Product
- 12.2.1. Blanket
- 12.2.2. Board
- 12.2.3. Pipe
- 12.2.4. Other Products
- 12.3. Market Analysis, Insights and Forecast - by End-user Industry
- 12.3.1. Automotive
- 12.3.2. Chemical and Petrochemical
- 12.3.3. Construction
- 12.3.4. Electrical and Electronics
- 12.3.5. Oil and Gas
- 12.3.6. Power Generation
- 12.3.7. Other End-user Industries
- 12.1. Market Analysis, Insights and Forecast - by Insulation Material
- 13. Competitive Analysis
- 13.1. Company Profiles
- 13.1.1 Solvay
- 13.1.1.1. Company Overview
- 13.1.1.2. Products
- 13.1.1.3. Company Financials
- 13.1.1.4. SWOT Analysis
- 13.1.2 BNZ Materials
- 13.1.2.1. Company Overview
- 13.1.2.2. Products
- 13.1.2.3. Company Financials
- 13.1.2.4. SWOT Analysis
- 13.1.3 Cabot Corporation
- 13.1.3.1. Company Overview
- 13.1.3.2. Products
- 13.1.3.3. Company Financials
- 13.1.3.4. SWOT Analysis
- 13.1.4 Armacell
- 13.1.4.1. Company Overview
- 13.1.4.2. Products
- 13.1.4.3. Company Financials
- 13.1.4.4. SWOT Analysis
- 13.1.5 Owens Corning
- 13.1.5.1. Company Overview
- 13.1.5.2. Products
- 13.1.5.3. Company Financials
- 13.1.5.4. SWOT Analysis
- 13.1.6 BASF SE
- 13.1.6.1. Company Overview
- 13.1.6.2. Products
- 13.1.6.3. Company Financials
- 13.1.6.4. SWOT Analysis
- 13.1.7 Rockwool A/S
- 13.1.7.1. Company Overview
- 13.1.7.2. Products
- 13.1.7.3. Company Financials
- 13.1.7.4. SWOT Analysis
- 13.1.8 Knauf Insulation
- 13.1.8.1. Company Overview
- 13.1.8.2. Products
- 13.1.8.3. Company Financials
- 13.1.8.4. SWOT Analysis
- 13.1.9 Temati Group
- 13.1.9.1. Company Overview
- 13.1.9.2. Products
- 13.1.9.3. Company Financials
- 13.1.9.4. SWOT Analysis
- 13.1.10 INSUL-FAB
- 13.1.10.1. Company Overview
- 13.1.10.2. Products
- 13.1.10.3. Company Financials
- 13.1.10.4. SWOT Analysis
- 13.1.11 Johns Manville-Berkshire Hathway Company
- 13.1.11.1. Company Overview
- 13.1.11.2. Products
- 13.1.11.3. Company Financials
- 13.1.11.4. SWOT Analysis
- 13.1.12 Jays Refractory Specialists
- 13.1.12.1. Company Overview
- 13.1.12.2. Products
- 13.1.12.3. Company Financials
- 13.1.12.4. SWOT Analysis
- 13.1.1 Solvay
- 13.2. Market Entropy
- 13.2.1 Company's Key Areas Served
- 13.2.2 Recent Developments
- 13.3. Company Market Share Analysis 2025
- 13.3.1 Top 5 Companies Market Share Analysis
- 13.3.2 Top 3 Companies Market Share Analysis
- 13.4. List of Potential Customers
- 14. Research Methodology
List of Figures
- Figure 1: Global Industrial Insulation Industry Revenue Breakdown (Million, %) by Region 2025 & 2033
- Figure 2: Global Industrial Insulation Industry Volume Breakdown (K Tons, %) by Region 2025 & 2033
- Figure 3: Asia Pacific Industrial Insulation Industry Revenue (Million), by Insulation Material 2025 & 2033
- Figure 4: Asia Pacific Industrial Insulation Industry Volume (K Tons), by Insulation Material 2025 & 2033
- Figure 5: Asia Pacific Industrial Insulation Industry Revenue Share (%), by Insulation Material 2025 & 2033
- Figure 6: Asia Pacific Industrial Insulation Industry Volume Share (%), by Insulation Material 2025 & 2033
- Figure 7: Asia Pacific Industrial Insulation Industry Revenue (Million), by Product 2025 & 2033
- Figure 8: Asia Pacific Industrial Insulation Industry Volume (K Tons), by Product 2025 & 2033
- Figure 9: Asia Pacific Industrial Insulation Industry Revenue Share (%), by Product 2025 & 2033
- Figure 10: Asia Pacific Industrial Insulation Industry Volume Share (%), by Product 2025 & 2033
- Figure 11: Asia Pacific Industrial Insulation Industry Revenue (Million), by End-user Industry 2025 & 2033
- Figure 12: Asia Pacific Industrial Insulation Industry Volume (K Tons), by End-user Industry 2025 & 2033
- Figure 13: Asia Pacific Industrial Insulation Industry Revenue Share (%), by End-user Industry 2025 & 2033
- Figure 14: Asia Pacific Industrial Insulation Industry Volume Share (%), by End-user Industry 2025 & 2033
- Figure 15: Asia Pacific Industrial Insulation Industry Revenue (Million), by Country 2025 & 2033
- Figure 16: Asia Pacific Industrial Insulation Industry Volume (K Tons), by Country 2025 & 2033
- Figure 17: Asia Pacific Industrial Insulation Industry Revenue Share (%), by Country 2025 & 2033
- Figure 18: Asia Pacific Industrial Insulation Industry Volume Share (%), by Country 2025 & 2033
- Figure 19: North America Industrial Insulation Industry Revenue (Million), by Insulation Material 2025 & 2033
- Figure 20: North America Industrial Insulation Industry Volume (K Tons), by Insulation Material 2025 & 2033
- Figure 21: North America Industrial Insulation Industry Revenue Share (%), by Insulation Material 2025 & 2033
- Figure 22: North America Industrial Insulation Industry Volume Share (%), by Insulation Material 2025 & 2033
- Figure 23: North America Industrial Insulation Industry Revenue (Million), by Product 2025 & 2033
- Figure 24: North America Industrial Insulation Industry Volume (K Tons), by Product 2025 & 2033
- Figure 25: North America Industrial Insulation Industry Revenue Share (%), by Product 2025 & 2033
- Figure 26: North America Industrial Insulation Industry Volume Share (%), by Product 2025 & 2033
- Figure 27: North America Industrial Insulation Industry Revenue (Million), by End-user Industry 2025 & 2033
- Figure 28: North America Industrial Insulation Industry Volume (K Tons), by End-user Industry 2025 & 2033
- Figure 29: North America Industrial Insulation Industry Revenue Share (%), by End-user Industry 2025 & 2033
- Figure 30: North America Industrial Insulation Industry Volume Share (%), by End-user Industry 2025 & 2033
- Figure 31: North America Industrial Insulation Industry Revenue (Million), by Country 2025 & 2033
- Figure 32: North America Industrial Insulation Industry Volume (K Tons), by Country 2025 & 2033
- Figure 33: North America Industrial Insulation Industry Revenue Share (%), by Country 2025 & 2033
- Figure 34: North America Industrial Insulation Industry Volume Share (%), by Country 2025 & 2033
- Figure 35: Europe Industrial Insulation Industry Revenue (Million), by Insulation Material 2025 & 2033
- Figure 36: Europe Industrial Insulation Industry Volume (K Tons), by Insulation Material 2025 & 2033
- Figure 37: Europe Industrial Insulation Industry Revenue Share (%), by Insulation Material 2025 & 2033
- Figure 38: Europe Industrial Insulation Industry Volume Share (%), by Insulation Material 2025 & 2033
- Figure 39: Europe Industrial Insulation Industry Revenue (Million), by Product 2025 & 2033
- Figure 40: Europe Industrial Insulation Industry Volume (K Tons), by Product 2025 & 2033
- Figure 41: Europe Industrial Insulation Industry Revenue Share (%), by Product 2025 & 2033
- Figure 42: Europe Industrial Insulation Industry Volume Share (%), by Product 2025 & 2033
- Figure 43: Europe Industrial Insulation Industry Revenue (Million), by End-user Industry 2025 & 2033
- Figure 44: Europe Industrial Insulation Industry Volume (K Tons), by End-user Industry 2025 & 2033
- Figure 45: Europe Industrial Insulation Industry Revenue Share (%), by End-user Industry 2025 & 2033
- Figure 46: Europe Industrial Insulation Industry Volume Share (%), by End-user Industry 2025 & 2033
- Figure 47: Europe Industrial Insulation Industry Revenue (Million), by Country 2025 & 2033
- Figure 48: Europe Industrial Insulation Industry Volume (K Tons), by Country 2025 & 2033
- Figure 49: Europe Industrial Insulation Industry Revenue Share (%), by Country 2025 & 2033
- Figure 50: Europe Industrial Insulation Industry Volume Share (%), by Country 2025 & 2033
- Figure 51: South America Industrial Insulation Industry Revenue (Million), by Insulation Material 2025 & 2033
- Figure 52: South America Industrial Insulation Industry Volume (K Tons), by Insulation Material 2025 & 2033
- Figure 53: South America Industrial Insulation Industry Revenue Share (%), by Insulation Material 2025 & 2033
- Figure 54: South America Industrial Insulation Industry Volume Share (%), by Insulation Material 2025 & 2033
- Figure 55: South America Industrial Insulation Industry Revenue (Million), by Product 2025 & 2033
- Figure 56: South America Industrial Insulation Industry Volume (K Tons), by Product 2025 & 2033
- Figure 57: South America Industrial Insulation Industry Revenue Share (%), by Product 2025 & 2033
- Figure 58: South America Industrial Insulation Industry Volume Share (%), by Product 2025 & 2033
- Figure 59: South America Industrial Insulation Industry Revenue (Million), by End-user Industry 2025 & 2033
- Figure 60: South America Industrial Insulation Industry Volume (K Tons), by End-user Industry 2025 & 2033
- Figure 61: South America Industrial Insulation Industry Revenue Share (%), by End-user Industry 2025 & 2033
- Figure 62: South America Industrial Insulation Industry Volume Share (%), by End-user Industry 2025 & 2033
- Figure 63: South America Industrial Insulation Industry Revenue (Million), by Country 2025 & 2033
- Figure 64: South America Industrial Insulation Industry Volume (K Tons), by Country 2025 & 2033
- Figure 65: South America Industrial Insulation Industry Revenue Share (%), by Country 2025 & 2033
- Figure 66: South America Industrial Insulation Industry Volume Share (%), by Country 2025 & 2033
- Figure 67: Middle East Industrial Insulation Industry Revenue (Million), by Insulation Material 2025 & 2033
- Figure 68: Middle East Industrial Insulation Industry Volume (K Tons), by Insulation Material 2025 & 2033
- Figure 69: Middle East Industrial Insulation Industry Revenue Share (%), by Insulation Material 2025 & 2033
- Figure 70: Middle East Industrial Insulation Industry Volume Share (%), by Insulation Material 2025 & 2033
- Figure 71: Middle East Industrial Insulation Industry Revenue (Million), by Product 2025 & 2033
- Figure 72: Middle East Industrial Insulation Industry Volume (K Tons), by Product 2025 & 2033
- Figure 73: Middle East Industrial Insulation Industry Revenue Share (%), by Product 2025 & 2033
- Figure 74: Middle East Industrial Insulation Industry Volume Share (%), by Product 2025 & 2033
- Figure 75: Middle East Industrial Insulation Industry Revenue (Million), by End-user Industry 2025 & 2033
- Figure 76: Middle East Industrial Insulation Industry Volume (K Tons), by End-user Industry 2025 & 2033
- Figure 77: Middle East Industrial Insulation Industry Revenue Share (%), by End-user Industry 2025 & 2033
- Figure 78: Middle East Industrial Insulation Industry Volume Share (%), by End-user Industry 2025 & 2033
- Figure 79: Middle East Industrial Insulation Industry Revenue (Million), by Country 2025 & 2033
- Figure 80: Middle East Industrial Insulation Industry Volume (K Tons), by Country 2025 & 2033
- Figure 81: Middle East Industrial Insulation Industry Revenue Share (%), by Country 2025 & 2033
- Figure 82: Middle East Industrial Insulation Industry Volume Share (%), by Country 2025 & 2033
- Figure 83: Saudi Arabia Industrial Insulation Industry Revenue (Million), by Insulation Material 2025 & 2033
- Figure 84: Saudi Arabia Industrial Insulation Industry Volume (K Tons), by Insulation Material 2025 & 2033
- Figure 85: Saudi Arabia Industrial Insulation Industry Revenue Share (%), by Insulation Material 2025 & 2033
- Figure 86: Saudi Arabia Industrial Insulation Industry Volume Share (%), by Insulation Material 2025 & 2033
- Figure 87: Saudi Arabia Industrial Insulation Industry Revenue (Million), by Product 2025 & 2033
- Figure 88: Saudi Arabia Industrial Insulation Industry Volume (K Tons), by Product 2025 & 2033
- Figure 89: Saudi Arabia Industrial Insulation Industry Revenue Share (%), by Product 2025 & 2033
- Figure 90: Saudi Arabia Industrial Insulation Industry Volume Share (%), by Product 2025 & 2033
- Figure 91: Saudi Arabia Industrial Insulation Industry Revenue (Million), by End-user Industry 2025 & 2033
- Figure 92: Saudi Arabia Industrial Insulation Industry Volume (K Tons), by End-user Industry 2025 & 2033
- Figure 93: Saudi Arabia Industrial Insulation Industry Revenue Share (%), by End-user Industry 2025 & 2033
- Figure 94: Saudi Arabia Industrial Insulation Industry Volume Share (%), by End-user Industry 2025 & 2033
- Figure 95: Saudi Arabia Industrial Insulation Industry Revenue (Million), by Country 2025 & 2033
- Figure 96: Saudi Arabia Industrial Insulation Industry Volume (K Tons), by Country 2025 & 2033
- Figure 97: Saudi Arabia Industrial Insulation Industry Revenue Share (%), by Country 2025 & 2033
- Figure 98: Saudi Arabia Industrial Insulation Industry Volume Share (%), by Country 2025 & 2033
List of Tables
- Table 1: Global Industrial Insulation Industry Revenue Million Forecast, by Insulation Material 2020 & 2033
- Table 2: Global Industrial Insulation Industry Volume K Tons Forecast, by Insulation Material 2020 & 2033
- Table 3: Global Industrial Insulation Industry Revenue Million Forecast, by Product 2020 & 2033
- Table 4: Global Industrial Insulation Industry Volume K Tons Forecast, by Product 2020 & 2033
- Table 5: Global Industrial Insulation Industry Revenue Million Forecast, by End-user Industry 2020 & 2033
- Table 6: Global Industrial Insulation Industry Volume K Tons Forecast, by End-user Industry 2020 & 2033
- Table 7: Global Industrial Insulation Industry Revenue Million Forecast, by Region 2020 & 2033
- Table 8: Global Industrial Insulation Industry Volume K Tons Forecast, by Region 2020 & 2033
- Table 9: Global Industrial Insulation Industry Revenue Million Forecast, by Insulation Material 2020 & 2033
- Table 10: Global Industrial Insulation Industry Volume K Tons Forecast, by Insulation Material 2020 & 2033
- Table 11: Global Industrial Insulation Industry Revenue Million Forecast, by Product 2020 & 2033
- Table 12: Global Industrial Insulation Industry Volume K Tons Forecast, by Product 2020 & 2033
- Table 13: Global Industrial Insulation Industry Revenue Million Forecast, by End-user Industry 2020 & 2033
- Table 14: Global Industrial Insulation Industry Volume K Tons Forecast, by End-user Industry 2020 & 2033
- Table 15: Global Industrial Insulation Industry Revenue Million Forecast, by Country 2020 & 2033
- Table 16: Global Industrial Insulation Industry Volume K Tons Forecast, by Country 2020 & 2033
- Table 17: China Industrial Insulation Industry Revenue (Million) Forecast, by Application 2020 & 2033
- Table 18: China Industrial Insulation Industry Volume (K Tons) Forecast, by Application 2020 & 2033
- Table 19: India Industrial Insulation Industry Revenue (Million) Forecast, by Application 2020 & 2033
- Table 20: India Industrial Insulation Industry Volume (K Tons) Forecast, by Application 2020 & 2033
- Table 21: Japan Industrial Insulation Industry Revenue (Million) Forecast, by Application 2020 & 2033
- Table 22: Japan Industrial Insulation Industry Volume (K Tons) Forecast, by Application 2020 & 2033
- Table 23: South Korea Industrial Insulation Industry Revenue (Million) Forecast, by Application 2020 & 2033
- Table 24: South Korea Industrial Insulation Industry Volume (K Tons) Forecast, by Application 2020 & 2033
- Table 25: Rest of Asia Pacific Industrial Insulation Industry Revenue (Million) Forecast, by Application 2020 & 2033
- Table 26: Rest of Asia Pacific Industrial Insulation Industry Volume (K Tons) Forecast, by Application 2020 & 2033
- Table 27: Global Industrial Insulation Industry Revenue Million Forecast, by Insulation Material 2020 & 2033
- Table 28: Global Industrial Insulation Industry Volume K Tons Forecast, by Insulation Material 2020 & 2033
- Table 29: Global Industrial Insulation Industry Revenue Million Forecast, by Product 2020 & 2033
- Table 30: Global Industrial Insulation Industry Volume K Tons Forecast, by Product 2020 & 2033
- Table 31: Global Industrial Insulation Industry Revenue Million Forecast, by End-user Industry 2020 & 2033
- Table 32: Global Industrial Insulation Industry Volume K Tons Forecast, by End-user Industry 2020 & 2033
- Table 33: Global Industrial Insulation Industry Revenue Million Forecast, by Country 2020 & 2033
- Table 34: Global Industrial Insulation Industry Volume K Tons Forecast, by Country 2020 & 2033
- Table 35: United States Industrial Insulation Industry Revenue (Million) Forecast, by Application 2020 & 2033
- Table 36: United States Industrial Insulation Industry Volume (K Tons) Forecast, by Application 2020 & 2033
- Table 37: Canada Industrial Insulation Industry Revenue (Million) Forecast, by Application 2020 & 2033
- Table 38: Canada Industrial Insulation Industry Volume (K Tons) Forecast, by Application 2020 & 2033
- Table 39: Mexico Industrial Insulation Industry Revenue (Million) Forecast, by Application 2020 & 2033
- Table 40: Mexico Industrial Insulation Industry Volume (K Tons) Forecast, by Application 2020 & 2033
- Table 41: Global Industrial Insulation Industry Revenue Million Forecast, by Insulation Material 2020 & 2033
- Table 42: Global Industrial Insulation Industry Volume K Tons Forecast, by Insulation Material 2020 & 2033
- Table 43: Global Industrial Insulation Industry Revenue Million Forecast, by Product 2020 & 2033
- Table 44: Global Industrial Insulation Industry Volume K Tons Forecast, by Product 2020 & 2033
- Table 45: Global Industrial Insulation Industry Revenue Million Forecast, by End-user Industry 2020 & 2033
- Table 46: Global Industrial Insulation Industry Volume K Tons Forecast, by End-user Industry 2020 & 2033
- Table 47: Global Industrial Insulation Industry Revenue Million Forecast, by Country 2020 & 2033
- Table 48: Global Industrial Insulation Industry Volume K Tons Forecast, by Country 2020 & 2033
- Table 49: Germany Industrial Insulation Industry Revenue (Million) Forecast, by Application 2020 & 2033
- Table 50: Germany Industrial Insulation Industry Volume (K Tons) Forecast, by Application 2020 & 2033
- Table 51: United Kingdom Industrial Insulation Industry Revenue (Million) Forecast, by Application 2020 & 2033
- Table 52: United Kingdom Industrial Insulation Industry Volume (K Tons) Forecast, by Application 2020 & 2033
- Table 53: France Industrial Insulation Industry Revenue (Million) Forecast, by Application 2020 & 2033
- Table 54: France Industrial Insulation Industry Volume (K Tons) Forecast, by Application 2020 & 2033
- Table 55: Italy Industrial Insulation Industry Revenue (Million) Forecast, by Application 2020 & 2033
- Table 56: Italy Industrial Insulation Industry Volume (K Tons) Forecast, by Application 2020 & 2033
- Table 57: Rest of Europe Industrial Insulation Industry Revenue (Million) Forecast, by Application 2020 & 2033
- Table 58: Rest of Europe Industrial Insulation Industry Volume (K Tons) Forecast, by Application 2020 & 2033
- Table 59: Global Industrial Insulation Industry Revenue Million Forecast, by Insulation Material 2020 & 2033
- Table 60: Global Industrial Insulation Industry Volume K Tons Forecast, by Insulation Material 2020 & 2033
- Table 61: Global Industrial Insulation Industry Revenue Million Forecast, by Product 2020 & 2033
- Table 62: Global Industrial Insulation Industry Volume K Tons Forecast, by Product 2020 & 2033
- Table 63: Global Industrial Insulation Industry Revenue Million Forecast, by End-user Industry 2020 & 2033
- Table 64: Global Industrial Insulation Industry Volume K Tons Forecast, by End-user Industry 2020 & 2033
- Table 65: Global Industrial Insulation Industry Revenue Million Forecast, by Country 2020 & 2033
- Table 66: Global Industrial Insulation Industry Volume K Tons Forecast, by Country 2020 & 2033
- Table 67: Brazil Industrial Insulation Industry Revenue (Million) Forecast, by Application 2020 & 2033
- Table 68: Brazil Industrial Insulation Industry Volume (K Tons) Forecast, by Application 2020 & 2033
- Table 69: Argentina Industrial Insulation Industry Revenue (Million) Forecast, by Application 2020 & 2033
- Table 70: Argentina Industrial Insulation Industry Volume (K Tons) Forecast, by Application 2020 & 2033
- Table 71: Rest of South America Industrial Insulation Industry Revenue (Million) Forecast, by Application 2020 & 2033
- Table 72: Rest of South America Industrial Insulation Industry Volume (K Tons) Forecast, by Application 2020 & 2033
- Table 73: Global Industrial Insulation Industry Revenue Million Forecast, by Insulation Material 2020 & 2033
- Table 74: Global Industrial Insulation Industry Volume K Tons Forecast, by Insulation Material 2020 & 2033
- Table 75: Global Industrial Insulation Industry Revenue Million Forecast, by Product 2020 & 2033
- Table 76: Global Industrial Insulation Industry Volume K Tons Forecast, by Product 2020 & 2033
- Table 77: Global Industrial Insulation Industry Revenue Million Forecast, by End-user Industry 2020 & 2033
- Table 78: Global Industrial Insulation Industry Volume K Tons Forecast, by End-user Industry 2020 & 2033
- Table 79: Global Industrial Insulation Industry Revenue Million Forecast, by Country 2020 & 2033
- Table 80: Global Industrial Insulation Industry Volume K Tons Forecast, by Country 2020 & 2033
- Table 81: Global Industrial Insulation Industry Revenue Million Forecast, by Insulation Material 2020 & 2033
- Table 82: Global Industrial Insulation Industry Volume K Tons Forecast, by Insulation Material 2020 & 2033
- Table 83: Global Industrial Insulation Industry Revenue Million Forecast, by Product 2020 & 2033
- Table 84: Global Industrial Insulation Industry Volume K Tons Forecast, by Product 2020 & 2033
- Table 85: Global Industrial Insulation Industry Revenue Million Forecast, by End-user Industry 2020 & 2033
- Table 86: Global Industrial Insulation Industry Volume K Tons Forecast, by End-user Industry 2020 & 2033
- Table 87: Global Industrial Insulation Industry Revenue Million Forecast, by Country 2020 & 2033
- Table 88: Global Industrial Insulation Industry Volume K Tons Forecast, by Country 2020 & 2033
- Table 89: South Africa Industrial Insulation Industry Revenue (Million) Forecast, by Application 2020 & 2033
- Table 90: South Africa Industrial Insulation Industry Volume (K Tons) Forecast, by Application 2020 & 2033
- Table 91: Rest of Middle East Industrial Insulation Industry Revenue (Million) Forecast, by Application 2020 & 2033
- Table 92: Rest of Middle East Industrial Insulation Industry Volume (K Tons) Forecast, by Application 2020 & 2033
Frequently Asked Questions
1. What is the projected Compound Annual Growth Rate (CAGR) of the Industrial Insulation Industry?
The projected CAGR is approximately > 5.00%.
2. Which companies are prominent players in the Industrial Insulation Industry?
Key companies in the market include Solvay, BNZ Materials, Cabot Corporation, Armacell, Owens Corning, BASF SE, Rockwool A/S, Knauf Insulation, Temati Group, INSUL-FAB, Johns Manville-Berkshire Hathway Company, Jays Refractory Specialists.
3. What are the main segments of the Industrial Insulation Industry?
The market segments include Insulation Material, Product, End-user Industry.
4. Can you provide details about the market size?
The market size is estimated to be USD 7.41 Million as of 2022.
5. What are some drivers contributing to market growth?
Growing Construction and Power Generation Industry; Regulatory Support to Increase Energy Efficiency.
6. What are the notable trends driving market growth?
Power Generation Industry to Dominate the Market.
7. Are there any restraints impacting market growth?
Environmental Hazards; Other Restraints.
8. Can you provide examples of recent developments in the market?
November 2022: BEWI acquired Aislamientos y Envases SL, a Spanish insulation company that provides EPS-based products for packaging and industrial applications, to expand its geographic footprint and strengthen its insulation solutions product portfolio in Spain.
9. What pricing options are available for accessing the report?
Pricing options include single-user, multi-user, and enterprise licenses priced at USD 4750, USD 5250, and USD 8750 respectively.
10. Is the market size provided in terms of value or volume?
The market size is provided in terms of value, measured in Million and volume, measured in K Tons.
11. Are there any specific market keywords associated with the report?
Yes, the market keyword associated with the report is "Industrial Insulation Industry," which aids in identifying and referencing the specific market segment covered.
12. How do I determine which pricing option suits my needs best?
The pricing options vary based on user requirements and access needs. Individual users may opt for single-user licenses, while businesses requiring broader access may choose multi-user or enterprise licenses for cost-effective access to the report.
13. Are there any additional resources or data provided in the Industrial Insulation Industry report?
While the report offers comprehensive insights, it's advisable to review the specific contents or supplementary materials provided to ascertain if additional resources or data are available.
14. How can I stay updated on further developments or reports in the Industrial Insulation Industry?
To stay informed about further developments, trends, and reports in the Industrial Insulation Industry, consider subscribing to industry newsletters, following relevant companies and organizations, or regularly checking reputable industry news sources and publications.
Methodology
Step 1 - Identification of Relevant Samples Size from Population Database


Step 2 - Approaches for Defining Global Market Size (Value, Volume* & Price*)

Note*: In applicable scenarios
Step 3 - Data Sources
Primary Research
- Web Analytics
- Survey Reports
- Research Institute
- Latest Research Reports
- Opinion Leaders
Secondary Research
- Annual Reports
- White Paper
- Latest Press Release
- Industry Association
- Paid Database
- Investor Presentations

Step 4 - Data Triangulation
Involves using different sources of information in order to increase the validity of a study
These sources are likely to be stakeholders in a program - participants, other researchers, program staff, other community members, and so on.
Then we put all data in single framework & apply various statistical tools to find out the dynamic on the market.
During the analysis stage, feedback from the stakeholder groups would be compared to determine areas of agreement as well as areas of divergence