

Key Insights
The Nitrile Butadiene Rubber (NBR) market is poised for robust expansion, projected to reach a significant valuation by 2033. This growth is primarily propelled by the escalating demand from the automotive and transportation sector, driven by the increasing production of vehicles and the need for high-performance components like hoses, belts, and gaskets that offer superior resistance to oil, fuel, and heat. The building and construction industry also significantly contributes to market growth, with NBR finding applications in sealants and adhesives that require durability and resilience. Furthermore, the burgeoning medical sector, utilizing NBR for gloves and other disposables due to its hypoallergenic properties and excellent barrier performance, is a key growth driver. Emerging economies, particularly in Asia Pacific, are expected to lead this expansion, fueled by rapid industrialization, infrastructure development, and a growing automotive manufacturing base.
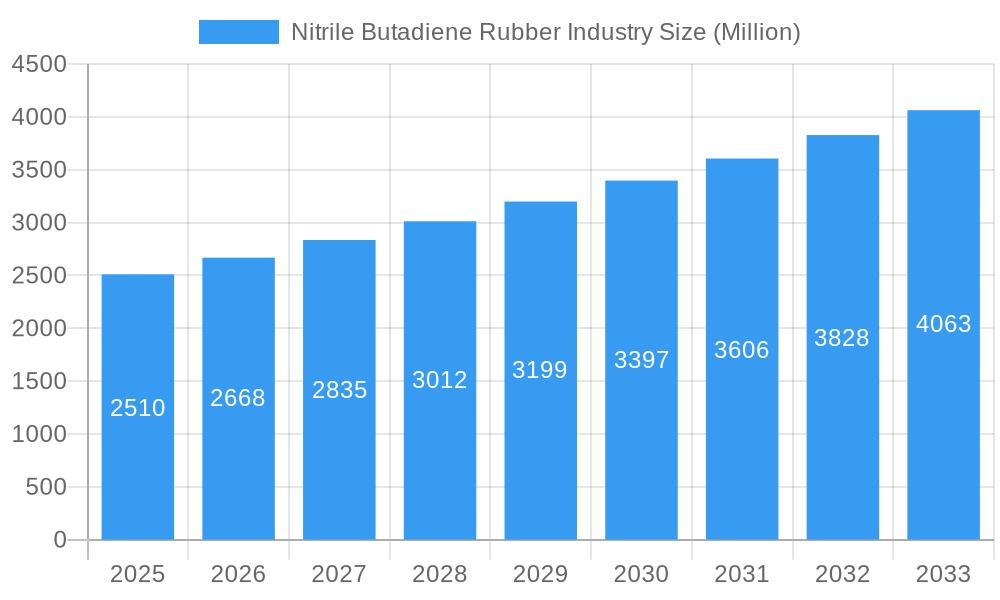
Nitrile Butadiene Rubber Industry Market Size (In Billion)
The Nitrile Butadiene Rubber market is navigating a dynamic landscape characterized by evolving technological advancements and shifting consumer preferences. Innovations in NBR production are focusing on enhancing its performance characteristics, such as improved temperature resistance and chemical inertness, to cater to more demanding applications. The trend towards eco-friendly and sustainable rubber alternatives presents both opportunities and challenges, prompting manufacturers to explore bio-based NBR or recycling initiatives. However, the market faces restraints such as the volatility of raw material prices, particularly butadiene and acrylonitrile, which can impact profit margins. Geopolitical factors and stringent environmental regulations in certain regions can also influence production costs and market access. Despite these challenges, the inherent versatility and widespread applicability of NBR across a multitude of critical industries ensure its continued relevance and sustained growth trajectory throughout the forecast period.
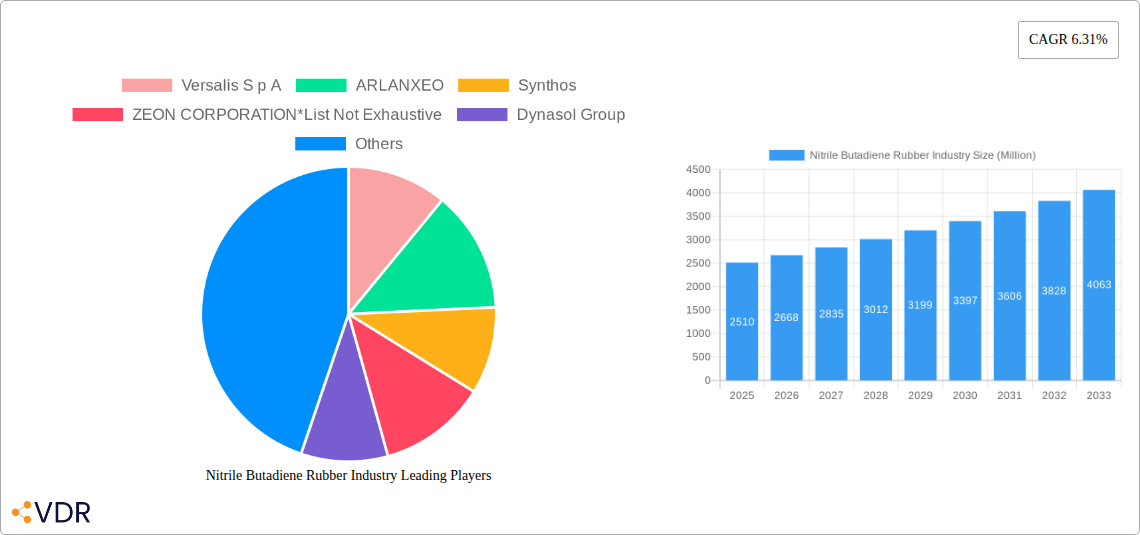
Nitrile Butadiene Rubber Industry Company Market Share
Nitrile Butadiene Rubber (NBR) Industry Report: Market Dynamics, Growth Trends, and Future Outlook (2019-2033)
This comprehensive report offers an in-depth analysis of the global Nitrile Butadiene Rubber (NBR) industry, a critical synthetic rubber renowned for its excellent resistance to oil, chemicals, and abrasion. Covering the historical period of 2019-2024, base and estimated year of 2025, and a robust forecast period from 2025-2033, this study provides actionable insights into market dynamics, growth trajectories, regional dominance, product innovations, and key player strategies. With a focus on high-traffic keywords and segmented market analysis (parent and child markets), this report is an indispensable resource for industry professionals, investors, and decision-makers seeking to understand and capitalize on the evolving NBR landscape. All values are presented in Million units.
Nitrile Butadiene Rubber Industry Market Dynamics & Structure
The Nitrile Butadiene Rubber (NBR) industry exhibits a moderately concentrated market structure, with a few leading global players like ARALANXEO, Versalis S p A, and Synthos holding significant market shares. Technological innovation is a key driver, with continuous advancements in polymerization processes and compounding techniques enhancing NBR's performance characteristics for specialized applications. Regulatory frameworks, particularly concerning environmental impact and material safety, are increasingly influencing production methods and product formulations. Competitive product substitutes, such as thermoplastic elastomers (TPEs) and other synthetic rubbers, pose a constant challenge, pushing NBR manufacturers to innovate and differentiate. End-user demographics are shifting, with rising demand from the automotive and medical sectors propelling market growth. Mergers and acquisitions (M&A) trends are active, as companies seek to consolidate their market position, expand their product portfolios, and gain access to new technologies and geographical markets. For instance, the acquisition of specialized NBR producers by larger chemical conglomerates aims to achieve economies of scale and broader market reach.
- Market Concentration: Dominated by a mix of large multinational corporations and regional specialists.
- Technological Innovation Drivers: Development of high-performance grades, bio-based NBR, and enhanced processing capabilities.
- Regulatory Frameworks: Stringent environmental regulations and material safety standards are shaping R&D and production.
- Competitive Product Substitutes: Ongoing competition from TPEs, EPDM, and natural rubber in specific applications.
- End-User Demographics: Increasing demand from automotive (seals, hoses), medical (gloves), and industrial sectors.
- M&A Trends: Strategic consolidations and acquisitions to enhance market presence and technological capabilities.
Nitrile Butadiene Rubber Industry Growth Trends & Insights
The Nitrile Butadiene Rubber (NBR) industry is poised for robust growth, driven by increasing demand across its diverse applications and end-user industries. The market size evolution indicates a steady upward trajectory, fueled by the inherent properties of NBR, including its exceptional resistance to oils, fuels, and chemicals, which makes it indispensable in critical components across various sectors. Adoption rates for advanced NBR grades are on the rise, particularly in automotive and industrial machinery, where enhanced durability and performance are paramount. Technological disruptions, such as improved catalysts for NBR synthesis and the development of specialty NBR copolymers (e.g., hydrogenated nitrile butadiene rubber - HNBR), are expanding the application spectrum and enabling NBR to compete in more demanding environments. Consumer behavior shifts, notably the growing emphasis on safety and hygiene in the medical sector, have significantly boosted the demand for NBR gloves, a substantial segment within the NBR market. Furthermore, the automotive industry's push towards electric vehicles (EVs) is creating new opportunities for NBR in battery components, seals, and thermal management systems, as its excellent dielectric properties and chemical resistance are crucial. The industrial sector's continued expansion and modernization also contribute to sustained demand for NBR in hoses, belts, and seals.
The CAGR for the NBR market is projected to be around 5.5% during the forecast period (2025-2033), reflecting strong underlying growth drivers. Market penetration is expected to deepen, especially in emerging economies where industrialization and infrastructure development are accelerating. The development of specialized NBR compounds with improved temperature resistance and wear characteristics is enabling its use in applications previously dominated by more expensive or less versatile materials. Consumer preferences for durable and reliable products across all sectors indirectly support the NBR market, as it forms the backbone of many essential components. The increasing awareness and adoption of nitrile gloves in both professional and domestic settings, particularly post-pandemic, have solidified this segment as a major growth accelerator. The report will delve deeper into these trends, providing quantitative metrics and qualitative analysis to paint a comprehensive picture of the NBR industry's future.
Dominant Regions, Countries, or Segments in Nitrile Butadiene Rubber Industry
The Nitrile Butadiene Rubber (NBR) market's dominance is intricately linked to a confluence of regional economic strength, industrial infrastructure, and specific segment demand. Asia-Pacific, particularly China, has emerged as the leading region, driven by its massive manufacturing base across automotive, industrial, and consumer goods sectors. The region's substantial production capacity for NBR and its derivatives, coupled with strong domestic consumption, underpins its market leadership.
Dominant Segments:
- Application: Gloves: This segment is a paramount growth driver, propelled by the stringent hygiene requirements in the medical industry and the increasing adoption of disposable nitrile gloves in healthcare, food processing, and general industrial applications. The COVID-19 pandemic significantly accelerated demand and awareness for nitrile gloves, leading to sustained high consumption levels. Market share in this segment is substantial, projected to reach over 40% of the total NBR market by 2033.
- End-user Industry: Medical: Closely tied to the gloves segment, the medical industry is a cornerstone of NBR demand. The inherent properties of NBR – its hypoallergenic nature, chemical resistance, and barrier protection – make it the material of choice for surgical gloves, examination gloves, and various medical tubing and seals. Government healthcare spending and an aging global population further bolster demand in this sector.
- End-user Industry: Automotive and Transportation: This sector represents a significant and steadily growing segment for NBR. NBR's excellent resistance to fuels, oils, and hydraulic fluids makes it ideal for critical automotive components such as fuel hoses, oil seals, O-rings, and gaskets. The increasing global vehicle production, coupled with the rising demand for electric vehicles (EVs) which require specialized sealing and thermal management solutions, contributes to the robust growth in this end-user industry. The transition to EVs also presents opportunities for NBR in battery sealing and thermal management systems, where its dielectric properties and chemical resistance are crucial.
- Application: Hoses: The demand for industrial and automotive hoses remains a strong contributor to NBR consumption. NBR's flexibility, durability, and resistance to abrasion and chemicals make it a preferred material for fluid transfer applications across various industries, including manufacturing, construction, and agriculture.
Key Drivers of Dominance in Asia-Pacific:
- Economic Policies: Government initiatives promoting industrialization and manufacturing exports in countries like China and India.
- Infrastructure Development: Extensive investments in infrastructure projects, leading to increased demand for industrial components and materials.
- Automotive Production Hub: Asia-Pacific is the world's largest automotive manufacturing hub, driving significant demand for NBR in vehicle components.
- Growing Healthcare Sector: Expanding healthcare infrastructure and rising disposable incomes in developing Asian nations are fueling demand for medical-grade NBR products.
- Cost-Effective Manufacturing: Favorable manufacturing costs in the region contribute to its competitiveness in NBR production and export.
The market share of NBR in the global synthetic rubber market is substantial, and its growth potential in these dominant regions and segments is expected to outpace the overall market. The continuous innovation in NBR formulations tailored for specific high-performance applications further solidifies its position and market share.
Nitrile Butadiene Rubber Industry Product Landscape
The Nitrile Butadiene Rubber (NBR) product landscape is characterized by a spectrum of grades designed to meet diverse application requirements. Key product innovations focus on enhancing oil and chemical resistance, improving temperature performance (both high and low), and increasing abrasion and ozone resistance. Specialty NBR copolymers, such as carboxylated NBR (XNBR) and hydrogenated NBR (HNBR), offer superior mechanical strength and chemical resilience, opening doors to more demanding applications in automotive powertrains and oil exploration. Emerging trends include the development of bio-based NBR precursors and advanced compounding technologies that optimize processing efficiency and finished product performance. These advancements are crucial for NBR to maintain its competitive edge against emerging material alternatives and to cater to increasingly stringent industry standards.
Key Drivers, Barriers & Challenges in Nitrile Butadiene Rubber Industry
Key Drivers:
The Nitrile Butadiene Rubber (NBR) industry is propelled by several potent forces. The growing demand from the automotive sector, particularly for components resistant to fuels and oils, remains a primary driver. The medical industry's consistent need for high-quality nitrile gloves for hygiene and safety also fuels substantial growth. Furthermore, industrialization and infrastructure development worldwide necessitate the use of NBR in hoses, belts, and seals for machinery and equipment. Technological advancements leading to enhanced performance characteristics, such as improved temperature and chemical resistance, enable NBR to penetrate new, more demanding applications.
Barriers & Challenges:
Despite its strengths, the NBR industry faces significant challenges. Fluctuations in the prices of raw materials, such as butadiene and acrylonitrile, can impact profitability and market competitiveness. Intensifying competition from alternative materials, including thermoplastic elastomers (TPEs) and other synthetic rubbers, poses a constant threat, especially in price-sensitive applications. Stringent environmental regulations concerning emissions and waste management during production can increase operational costs and necessitate significant investment in sustainable practices. Supply chain disruptions, exacerbated by geopolitical events and logistical complexities, can lead to material shortages and price volatility. The development and adoption of bio-based and recyclable rubber alternatives also represent a long-term challenge that requires strategic adaptation.
Emerging Opportunities in Nitrile Butadiene Rubber Industry
Emerging opportunities within the Nitrile Butadiene Rubber (NBR) industry are diverse and significant. The expanding electric vehicle (EV) market presents a substantial avenue, with NBR’s dielectric properties and chemical resistance crucial for battery seals, thermal management systems, and charging infrastructure components. The increasing focus on healthcare and hygiene globally continues to drive demand for advanced nitrile gloves with enhanced barrier protection and tactile sensitivity. Furthermore, the growing oil and gas exploration activities in challenging environments create demand for high-performance NBR compounds capable of withstanding extreme temperatures and harsh chemicals. The development of sustainable NBR formulations, potentially incorporating bio-based feedstocks or advanced recycling technologies, offers a pathway to address environmental concerns and capture market share from eco-conscious consumers. Innovations in 3D printing applications for NBR also present a nascent but promising opportunity for customized components and rapid prototyping.
Growth Accelerators in the Nitrile Butadiene Rubber Industry Industry
The long-term growth of the Nitrile Butadiene Rubber (NBR) industry is significantly accelerated by several key catalysts. Continuous technological breakthroughs in polymerization techniques and compounding are yielding NBR grades with superior properties, such as enhanced heat resistance, improved oil swell resistance, and greater durability, enabling penetration into high-value applications. Strategic partnerships and collaborations between raw material suppliers, NBR manufacturers, and end-users are fostering innovation and the co-development of tailored solutions, ensuring NBR remains competitive. Market expansion into emerging economies, driven by industrialization and increasing disposable incomes, offers substantial untapped potential for NBR consumption. The growing emphasis on material performance and reliability across all industries, from automotive to aerospace, inherently favors materials like NBR that offer a proven track record of robustness and resilience. Furthermore, governmental support for key industries like automotive and healthcare, which are major consumers of NBR, acts as a significant growth accelerant.
Key Players Shaping the Nitrile Butadiene Rubber Industry Market
- ARLANXEO
- Versalis S p A
- Synthos
- ZEON CORPORATION
- Dynasol Group
- ENEOS Materials Corporation
- KUMHO PETROCHEMICAL
- SIBUR
- Synthomer PLC
- LG Chem
- China Petrochemical Corporation (Sinopec)
- Apcotex
- Lanxess
- TSRC
Notable Milestones in Nitrile Butadiene Rubber Industry Sector
- August 2022: Kumho Petrochemical announced plans to invest KRW6,000 billion (approximately USD 5.10 billion) into its existing and new businesses over the next five years.
- As part of this initiative, Kumho Petrochemical will allocate KRW 3,300 billion (approximately USD 2.81 billion) towards its core business areas.
- These core business areas include significant investments in nitrile butadiene latex (NB latex) production and styrene solution butadiene rubber (SSBR) manufacturing, underscoring a strategic focus on critical NBR-related materials.
In-Depth Nitrile Butadiene Rubber Industry Market Outlook
The future outlook for the Nitrile Butadiene Rubber (NBR) industry is exceptionally promising, underpinned by a combination of ongoing demand drivers and emerging opportunities. Growth accelerators such as advanced material science and strategic market expansions will continue to fuel market expansion. The industry's ability to adapt to evolving sustainability demands by developing greener NBR alternatives and more efficient production processes will be crucial for long-term success. The increasing sophistication of end-user industries, particularly in the automotive (especially EVs) and medical sectors, will necessitate higher-performance NBR grades, presenting significant opportunities for value-added products. Strategic investments by key players in research and development and capacity expansion will ensure the industry remains responsive to market needs. Overall, the NBR market is projected for sustained and robust growth, driven by its indispensable properties and the continuous innovation landscape.
Nitrile Butadiene Rubber Industry Segmentation
-
1. Application
- 1.1. Adhesives and Sealants
- 1.2. Belts and Cables
- 1.3. Gloves
- 1.4. Hoses
- 1.5. Gaskets and O-Rings
- 1.6. Other Applications (Consumer Goods)
-
2. End-user Industry
- 2.1. Automotive and Transportation
- 2.2. Building and Construction
- 2.3. Industrial
- 2.4. Medical
- 2.5. Other End-user Industries (Oil and Gas, Aerospace)
Nitrile Butadiene Rubber Industry Segmentation By Geography
-
1. Asia Pacific
- 1.1. China
- 1.2. India
- 1.3. Japan
- 1.4. South Korea
- 1.5. Malaysia
- 1.6. Thailand
- 1.7. Vietnam
- 1.8. Indonesia
- 1.9. Rest of Asia Pacific
-
2. North America
- 2.1. United States
- 2.2. Canada
- 2.3. Mexico
-
3. Europe
- 3.1. Germany
- 3.2. United Kingdom
- 3.3. Italy
- 3.4. France
- 3.5. Spain
- 3.6. Turkey
- 3.7. Russia
- 3.8. NORDIC
- 3.9. Rest of Europe
-
4. South America
- 4.1. Brazil
- 4.2. Argentina
- 4.3. Colombia
- 4.4. Rest of South America
-
5. Middle East and Africa
- 5.1. Saudi Arabia
- 5.2. South Africa
- 5.3. Nigeria
- 5.4. Egypt
- 5.5. Qatar
- 5.6. UAE
- 5.7. Rest of Middle East and Africa
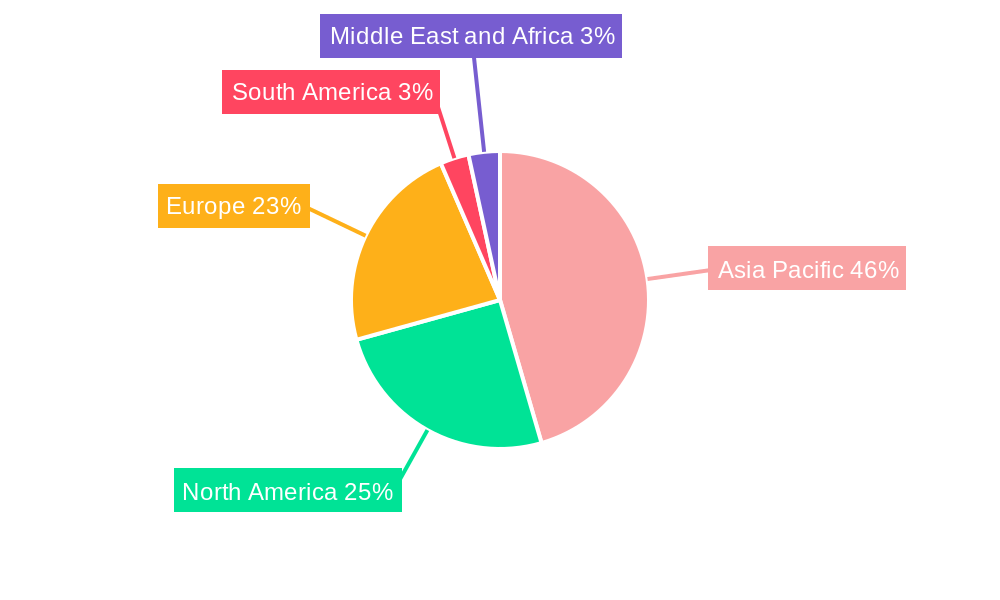
Nitrile Butadiene Rubber Industry Regional Market Share
Geographic Coverage of Nitrile Butadiene Rubber Industry
Nitrile Butadiene Rubber Industry REPORT HIGHLIGHTS
| Aspects | Details |
|---|---|
| Study Period | 2020-2034 |
| Base Year | 2025 |
| Estimated Year | 2026 |
| Forecast Period | 2026-2034 |
| Historical Period | 2020-2025 |
| Growth Rate | CAGR of 6.31% from 2020-2034 |
| Segmentation |
|
Table of Contents
- 1. Introduction
- 1.1. Research Scope
- 1.2. Market Segmentation
- 1.3. Research Objective
- 1.4. Definitions and Assumptions
- 2. Executive Summary
- 2.1. Market Snapshot
- 3. Market Dynamics
- 3.1. Market Drivers
- 3.2. Market Restrains
- 3.3. Market Trends
- 3.4. Market Opportunities
- 4. Market Factor Analysis
- 4.1. Porters Five Forces
- 4.1.1. Bargaining Power of Suppliers
- 4.1.2. Bargaining Power of Buyers
- 4.1.3. Threat of New Entrants
- 4.1.4. Threat of Substitutes
- 4.1.5. Competitive Rivalry
- 4.2. PESTEL analysis
- 4.3. BCG Analysis
- 4.3.1. Stars (High Growth, High Market Share)
- 4.3.2. Cash Cows (Low Growth, High Market Share)
- 4.3.3. Question Mark (High Growth, Low Market Share)
- 4.3.4. Dogs (Low Growth, Low Market Share)
- 4.4. Ansoff Matrix Analysis
- 4.5. Supply Chain Analysis
- 4.6. Regulatory Landscape
- 4.7. Current Market Potential and Opportunity Assessment (TAM–SAM–SOM Framework)
- 4.8. VDR Analyst Note
- 4.1. Porters Five Forces
- 5. Market Analysis, Insights and Forecast 2021-2033
- 5.1. Market Analysis, Insights and Forecast - by Application
- 5.1.1. Adhesives and Sealants
- 5.1.2. Belts and Cables
- 5.1.3. Gloves
- 5.1.4. Hoses
- 5.1.5. Gaskets and O-Rings
- 5.1.6. Other Applications (Consumer Goods)
- 5.2. Market Analysis, Insights and Forecast - by End-user Industry
- 5.2.1. Automotive and Transportation
- 5.2.2. Building and Construction
- 5.2.3. Industrial
- 5.2.4. Medical
- 5.2.5. Other End-user Industries (Oil and Gas, Aerospace)
- 5.3. Market Analysis, Insights and Forecast - by Region
- 5.3.1. Asia Pacific
- 5.3.2. North America
- 5.3.3. Europe
- 5.3.4. South America
- 5.3.5. Middle East and Africa
- 5.1. Market Analysis, Insights and Forecast - by Application
- 6. Global Nitrile Butadiene Rubber Industry Analysis, Insights and Forecast, 2021-2033
- 6.1. Market Analysis, Insights and Forecast - by Application
- 6.1.1. Adhesives and Sealants
- 6.1.2. Belts and Cables
- 6.1.3. Gloves
- 6.1.4. Hoses
- 6.1.5. Gaskets and O-Rings
- 6.1.6. Other Applications (Consumer Goods)
- 6.2. Market Analysis, Insights and Forecast - by End-user Industry
- 6.2.1. Automotive and Transportation
- 6.2.2. Building and Construction
- 6.2.3. Industrial
- 6.2.4. Medical
- 6.2.5. Other End-user Industries (Oil and Gas, Aerospace)
- 6.1. Market Analysis, Insights and Forecast - by Application
- 7. Asia Pacific Nitrile Butadiene Rubber Industry Analysis, Insights and Forecast, 2021-2033
- 7.1. Market Analysis, Insights and Forecast - by Application
- 7.1.1. Adhesives and Sealants
- 7.1.2. Belts and Cables
- 7.1.3. Gloves
- 7.1.4. Hoses
- 7.1.5. Gaskets and O-Rings
- 7.1.6. Other Applications (Consumer Goods)
- 7.2. Market Analysis, Insights and Forecast - by End-user Industry
- 7.2.1. Automotive and Transportation
- 7.2.2. Building and Construction
- 7.2.3. Industrial
- 7.2.4. Medical
- 7.2.5. Other End-user Industries (Oil and Gas, Aerospace)
- 7.1. Market Analysis, Insights and Forecast - by Application
- 8. North America Nitrile Butadiene Rubber Industry Analysis, Insights and Forecast, 2021-2033
- 8.1. Market Analysis, Insights and Forecast - by Application
- 8.1.1. Adhesives and Sealants
- 8.1.2. Belts and Cables
- 8.1.3. Gloves
- 8.1.4. Hoses
- 8.1.5. Gaskets and O-Rings
- 8.1.6. Other Applications (Consumer Goods)
- 8.2. Market Analysis, Insights and Forecast - by End-user Industry
- 8.2.1. Automotive and Transportation
- 8.2.2. Building and Construction
- 8.2.3. Industrial
- 8.2.4. Medical
- 8.2.5. Other End-user Industries (Oil and Gas, Aerospace)
- 8.1. Market Analysis, Insights and Forecast - by Application
- 9. Europe Nitrile Butadiene Rubber Industry Analysis, Insights and Forecast, 2021-2033
- 9.1. Market Analysis, Insights and Forecast - by Application
- 9.1.1. Adhesives and Sealants
- 9.1.2. Belts and Cables
- 9.1.3. Gloves
- 9.1.4. Hoses
- 9.1.5. Gaskets and O-Rings
- 9.1.6. Other Applications (Consumer Goods)
- 9.2. Market Analysis, Insights and Forecast - by End-user Industry
- 9.2.1. Automotive and Transportation
- 9.2.2. Building and Construction
- 9.2.3. Industrial
- 9.2.4. Medical
- 9.2.5. Other End-user Industries (Oil and Gas, Aerospace)
- 9.1. Market Analysis, Insights and Forecast - by Application
- 10. South America Nitrile Butadiene Rubber Industry Analysis, Insights and Forecast, 2021-2033
- 10.1. Market Analysis, Insights and Forecast - by Application
- 10.1.1. Adhesives and Sealants
- 10.1.2. Belts and Cables
- 10.1.3. Gloves
- 10.1.4. Hoses
- 10.1.5. Gaskets and O-Rings
- 10.1.6. Other Applications (Consumer Goods)
- 10.2. Market Analysis, Insights and Forecast - by End-user Industry
- 10.2.1. Automotive and Transportation
- 10.2.2. Building and Construction
- 10.2.3. Industrial
- 10.2.4. Medical
- 10.2.5. Other End-user Industries (Oil and Gas, Aerospace)
- 10.1. Market Analysis, Insights and Forecast - by Application
- 11. Middle East and Africa Nitrile Butadiene Rubber Industry Analysis, Insights and Forecast, 2021-2033
- 11.1. Market Analysis, Insights and Forecast - by Application
- 11.1.1. Adhesives and Sealants
- 11.1.2. Belts and Cables
- 11.1.3. Gloves
- 11.1.4. Hoses
- 11.1.5. Gaskets and O-Rings
- 11.1.6. Other Applications (Consumer Goods)
- 11.2. Market Analysis, Insights and Forecast - by End-user Industry
- 11.2.1. Automotive and Transportation
- 11.2.2. Building and Construction
- 11.2.3. Industrial
- 11.2.4. Medical
- 11.2.5. Other End-user Industries (Oil and Gas, Aerospace)
- 11.1. Market Analysis, Insights and Forecast - by Application
- 12. Competitive Analysis
- 12.1. Company Profiles
- 12.1.1 Versalis S p A
- 12.1.1.1. Company Overview
- 12.1.1.2. Products
- 12.1.1.3. Company Financials
- 12.1.1.4. SWOT Analysis
- 12.1.2 ARLANXEO
- 12.1.2.1. Company Overview
- 12.1.2.2. Products
- 12.1.2.3. Company Financials
- 12.1.2.4. SWOT Analysis
- 12.1.3 Synthos
- 12.1.3.1. Company Overview
- 12.1.3.2. Products
- 12.1.3.3. Company Financials
- 12.1.3.4. SWOT Analysis
- 12.1.4 ZEON CORPORATION*List Not Exhaustive
- 12.1.4.1. Company Overview
- 12.1.4.2. Products
- 12.1.4.3. Company Financials
- 12.1.4.4. SWOT Analysis
- 12.1.5 Dynasol Group
- 12.1.5.1. Company Overview
- 12.1.5.2. Products
- 12.1.5.3. Company Financials
- 12.1.5.4. SWOT Analysis
- 12.1.6 ENEOS Materials Corporation
- 12.1.6.1. Company Overview
- 12.1.6.2. Products
- 12.1.6.3. Company Financials
- 12.1.6.4. SWOT Analysis
- 12.1.7 KUMHO PETROCHEMICAL
- 12.1.7.1. Company Overview
- 12.1.7.2. Products
- 12.1.7.3. Company Financials
- 12.1.7.4. SWOT Analysis
- 12.1.8 SIBUR
- 12.1.8.1. Company Overview
- 12.1.8.2. Products
- 12.1.8.3. Company Financials
- 12.1.8.4. SWOT Analysis
- 12.1.9 Synthomer PLC
- 12.1.9.1. Company Overview
- 12.1.9.2. Products
- 12.1.9.3. Company Financials
- 12.1.9.4. SWOT Analysis
- 12.1.10 LG Chem
- 12.1.10.1. Company Overview
- 12.1.10.2. Products
- 12.1.10.3. Company Financials
- 12.1.10.4. SWOT Analysis
- 12.1.11 China Petrochemical Corporation (Sinopec)
- 12.1.11.1. Company Overview
- 12.1.11.2. Products
- 12.1.11.3. Company Financials
- 12.1.11.4. SWOT Analysis
- 12.1.12 Apcotex
- 12.1.12.1. Company Overview
- 12.1.12.2. Products
- 12.1.12.3. Company Financials
- 12.1.12.4. SWOT Analysis
- 12.1.13 Lanxess
- 12.1.13.1. Company Overview
- 12.1.13.2. Products
- 12.1.13.3. Company Financials
- 12.1.13.4. SWOT Analysis
- 12.1.14 TSRC
- 12.1.14.1. Company Overview
- 12.1.14.2. Products
- 12.1.14.3. Company Financials
- 12.1.14.4. SWOT Analysis
- 12.1.1 Versalis S p A
- 12.2. Market Entropy
- 12.2.1 Company's Key Areas Served
- 12.2.2 Recent Developments
- 12.3. Company Market Share Analysis 2025
- 12.3.1 Top 5 Companies Market Share Analysis
- 12.3.2 Top 3 Companies Market Share Analysis
- 12.4. List of Potential Customers
- 13. Research Methodology
List of Figures
- Figure 1: Global Nitrile Butadiene Rubber Industry Revenue Breakdown (Million, %) by Region 2025 & 2033
- Figure 2: Global Nitrile Butadiene Rubber Industry Volume Breakdown (K Tons, %) by Region 2025 & 2033
- Figure 3: Asia Pacific Nitrile Butadiene Rubber Industry Revenue (Million), by Application 2025 & 2033
- Figure 4: Asia Pacific Nitrile Butadiene Rubber Industry Volume (K Tons), by Application 2025 & 2033
- Figure 5: Asia Pacific Nitrile Butadiene Rubber Industry Revenue Share (%), by Application 2025 & 2033
- Figure 6: Asia Pacific Nitrile Butadiene Rubber Industry Volume Share (%), by Application 2025 & 2033
- Figure 7: Asia Pacific Nitrile Butadiene Rubber Industry Revenue (Million), by End-user Industry 2025 & 2033
- Figure 8: Asia Pacific Nitrile Butadiene Rubber Industry Volume (K Tons), by End-user Industry 2025 & 2033
- Figure 9: Asia Pacific Nitrile Butadiene Rubber Industry Revenue Share (%), by End-user Industry 2025 & 2033
- Figure 10: Asia Pacific Nitrile Butadiene Rubber Industry Volume Share (%), by End-user Industry 2025 & 2033
- Figure 11: Asia Pacific Nitrile Butadiene Rubber Industry Revenue (Million), by Country 2025 & 2033
- Figure 12: Asia Pacific Nitrile Butadiene Rubber Industry Volume (K Tons), by Country 2025 & 2033
- Figure 13: Asia Pacific Nitrile Butadiene Rubber Industry Revenue Share (%), by Country 2025 & 2033
- Figure 14: Asia Pacific Nitrile Butadiene Rubber Industry Volume Share (%), by Country 2025 & 2033
- Figure 15: North America Nitrile Butadiene Rubber Industry Revenue (Million), by Application 2025 & 2033
- Figure 16: North America Nitrile Butadiene Rubber Industry Volume (K Tons), by Application 2025 & 2033
- Figure 17: North America Nitrile Butadiene Rubber Industry Revenue Share (%), by Application 2025 & 2033
- Figure 18: North America Nitrile Butadiene Rubber Industry Volume Share (%), by Application 2025 & 2033
- Figure 19: North America Nitrile Butadiene Rubber Industry Revenue (Million), by End-user Industry 2025 & 2033
- Figure 20: North America Nitrile Butadiene Rubber Industry Volume (K Tons), by End-user Industry 2025 & 2033
- Figure 21: North America Nitrile Butadiene Rubber Industry Revenue Share (%), by End-user Industry 2025 & 2033
- Figure 22: North America Nitrile Butadiene Rubber Industry Volume Share (%), by End-user Industry 2025 & 2033
- Figure 23: North America Nitrile Butadiene Rubber Industry Revenue (Million), by Country 2025 & 2033
- Figure 24: North America Nitrile Butadiene Rubber Industry Volume (K Tons), by Country 2025 & 2033
- Figure 25: North America Nitrile Butadiene Rubber Industry Revenue Share (%), by Country 2025 & 2033
- Figure 26: North America Nitrile Butadiene Rubber Industry Volume Share (%), by Country 2025 & 2033
- Figure 27: Europe Nitrile Butadiene Rubber Industry Revenue (Million), by Application 2025 & 2033
- Figure 28: Europe Nitrile Butadiene Rubber Industry Volume (K Tons), by Application 2025 & 2033
- Figure 29: Europe Nitrile Butadiene Rubber Industry Revenue Share (%), by Application 2025 & 2033
- Figure 30: Europe Nitrile Butadiene Rubber Industry Volume Share (%), by Application 2025 & 2033
- Figure 31: Europe Nitrile Butadiene Rubber Industry Revenue (Million), by End-user Industry 2025 & 2033
- Figure 32: Europe Nitrile Butadiene Rubber Industry Volume (K Tons), by End-user Industry 2025 & 2033
- Figure 33: Europe Nitrile Butadiene Rubber Industry Revenue Share (%), by End-user Industry 2025 & 2033
- Figure 34: Europe Nitrile Butadiene Rubber Industry Volume Share (%), by End-user Industry 2025 & 2033
- Figure 35: Europe Nitrile Butadiene Rubber Industry Revenue (Million), by Country 2025 & 2033
- Figure 36: Europe Nitrile Butadiene Rubber Industry Volume (K Tons), by Country 2025 & 2033
- Figure 37: Europe Nitrile Butadiene Rubber Industry Revenue Share (%), by Country 2025 & 2033
- Figure 38: Europe Nitrile Butadiene Rubber Industry Volume Share (%), by Country 2025 & 2033
- Figure 39: South America Nitrile Butadiene Rubber Industry Revenue (Million), by Application 2025 & 2033
- Figure 40: South America Nitrile Butadiene Rubber Industry Volume (K Tons), by Application 2025 & 2033
- Figure 41: South America Nitrile Butadiene Rubber Industry Revenue Share (%), by Application 2025 & 2033
- Figure 42: South America Nitrile Butadiene Rubber Industry Volume Share (%), by Application 2025 & 2033
- Figure 43: South America Nitrile Butadiene Rubber Industry Revenue (Million), by End-user Industry 2025 & 2033
- Figure 44: South America Nitrile Butadiene Rubber Industry Volume (K Tons), by End-user Industry 2025 & 2033
- Figure 45: South America Nitrile Butadiene Rubber Industry Revenue Share (%), by End-user Industry 2025 & 2033
- Figure 46: South America Nitrile Butadiene Rubber Industry Volume Share (%), by End-user Industry 2025 & 2033
- Figure 47: South America Nitrile Butadiene Rubber Industry Revenue (Million), by Country 2025 & 2033
- Figure 48: South America Nitrile Butadiene Rubber Industry Volume (K Tons), by Country 2025 & 2033
- Figure 49: South America Nitrile Butadiene Rubber Industry Revenue Share (%), by Country 2025 & 2033
- Figure 50: South America Nitrile Butadiene Rubber Industry Volume Share (%), by Country 2025 & 2033
- Figure 51: Middle East and Africa Nitrile Butadiene Rubber Industry Revenue (Million), by Application 2025 & 2033
- Figure 52: Middle East and Africa Nitrile Butadiene Rubber Industry Volume (K Tons), by Application 2025 & 2033
- Figure 53: Middle East and Africa Nitrile Butadiene Rubber Industry Revenue Share (%), by Application 2025 & 2033
- Figure 54: Middle East and Africa Nitrile Butadiene Rubber Industry Volume Share (%), by Application 2025 & 2033
- Figure 55: Middle East and Africa Nitrile Butadiene Rubber Industry Revenue (Million), by End-user Industry 2025 & 2033
- Figure 56: Middle East and Africa Nitrile Butadiene Rubber Industry Volume (K Tons), by End-user Industry 2025 & 2033
- Figure 57: Middle East and Africa Nitrile Butadiene Rubber Industry Revenue Share (%), by End-user Industry 2025 & 2033
- Figure 58: Middle East and Africa Nitrile Butadiene Rubber Industry Volume Share (%), by End-user Industry 2025 & 2033
- Figure 59: Middle East and Africa Nitrile Butadiene Rubber Industry Revenue (Million), by Country 2025 & 2033
- Figure 60: Middle East and Africa Nitrile Butadiene Rubber Industry Volume (K Tons), by Country 2025 & 2033
- Figure 61: Middle East and Africa Nitrile Butadiene Rubber Industry Revenue Share (%), by Country 2025 & 2033
- Figure 62: Middle East and Africa Nitrile Butadiene Rubber Industry Volume Share (%), by Country 2025 & 2033
List of Tables
- Table 1: Global Nitrile Butadiene Rubber Industry Revenue Million Forecast, by Application 2020 & 2033
- Table 2: Global Nitrile Butadiene Rubber Industry Volume K Tons Forecast, by Application 2020 & 2033
- Table 3: Global Nitrile Butadiene Rubber Industry Revenue Million Forecast, by End-user Industry 2020 & 2033
- Table 4: Global Nitrile Butadiene Rubber Industry Volume K Tons Forecast, by End-user Industry 2020 & 2033
- Table 5: Global Nitrile Butadiene Rubber Industry Revenue Million Forecast, by Region 2020 & 2033
- Table 6: Global Nitrile Butadiene Rubber Industry Volume K Tons Forecast, by Region 2020 & 2033
- Table 7: Global Nitrile Butadiene Rubber Industry Revenue Million Forecast, by Application 2020 & 2033
- Table 8: Global Nitrile Butadiene Rubber Industry Volume K Tons Forecast, by Application 2020 & 2033
- Table 9: Global Nitrile Butadiene Rubber Industry Revenue Million Forecast, by End-user Industry 2020 & 2033
- Table 10: Global Nitrile Butadiene Rubber Industry Volume K Tons Forecast, by End-user Industry 2020 & 2033
- Table 11: Global Nitrile Butadiene Rubber Industry Revenue Million Forecast, by Country 2020 & 2033
- Table 12: Global Nitrile Butadiene Rubber Industry Volume K Tons Forecast, by Country 2020 & 2033
- Table 13: China Nitrile Butadiene Rubber Industry Revenue (Million) Forecast, by Application 2020 & 2033
- Table 14: China Nitrile Butadiene Rubber Industry Volume (K Tons) Forecast, by Application 2020 & 2033
- Table 15: India Nitrile Butadiene Rubber Industry Revenue (Million) Forecast, by Application 2020 & 2033
- Table 16: India Nitrile Butadiene Rubber Industry Volume (K Tons) Forecast, by Application 2020 & 2033
- Table 17: Japan Nitrile Butadiene Rubber Industry Revenue (Million) Forecast, by Application 2020 & 2033
- Table 18: Japan Nitrile Butadiene Rubber Industry Volume (K Tons) Forecast, by Application 2020 & 2033
- Table 19: South Korea Nitrile Butadiene Rubber Industry Revenue (Million) Forecast, by Application 2020 & 2033
- Table 20: South Korea Nitrile Butadiene Rubber Industry Volume (K Tons) Forecast, by Application 2020 & 2033
- Table 21: Malaysia Nitrile Butadiene Rubber Industry Revenue (Million) Forecast, by Application 2020 & 2033
- Table 22: Malaysia Nitrile Butadiene Rubber Industry Volume (K Tons) Forecast, by Application 2020 & 2033
- Table 23: Thailand Nitrile Butadiene Rubber Industry Revenue (Million) Forecast, by Application 2020 & 2033
- Table 24: Thailand Nitrile Butadiene Rubber Industry Volume (K Tons) Forecast, by Application 2020 & 2033
- Table 25: Vietnam Nitrile Butadiene Rubber Industry Revenue (Million) Forecast, by Application 2020 & 2033
- Table 26: Vietnam Nitrile Butadiene Rubber Industry Volume (K Tons) Forecast, by Application 2020 & 2033
- Table 27: Indonesia Nitrile Butadiene Rubber Industry Revenue (Million) Forecast, by Application 2020 & 2033
- Table 28: Indonesia Nitrile Butadiene Rubber Industry Volume (K Tons) Forecast, by Application 2020 & 2033
- Table 29: Rest of Asia Pacific Nitrile Butadiene Rubber Industry Revenue (Million) Forecast, by Application 2020 & 2033
- Table 30: Rest of Asia Pacific Nitrile Butadiene Rubber Industry Volume (K Tons) Forecast, by Application 2020 & 2033
- Table 31: Global Nitrile Butadiene Rubber Industry Revenue Million Forecast, by Application 2020 & 2033
- Table 32: Global Nitrile Butadiene Rubber Industry Volume K Tons Forecast, by Application 2020 & 2033
- Table 33: Global Nitrile Butadiene Rubber Industry Revenue Million Forecast, by End-user Industry 2020 & 2033
- Table 34: Global Nitrile Butadiene Rubber Industry Volume K Tons Forecast, by End-user Industry 2020 & 2033
- Table 35: Global Nitrile Butadiene Rubber Industry Revenue Million Forecast, by Country 2020 & 2033
- Table 36: Global Nitrile Butadiene Rubber Industry Volume K Tons Forecast, by Country 2020 & 2033
- Table 37: United States Nitrile Butadiene Rubber Industry Revenue (Million) Forecast, by Application 2020 & 2033
- Table 38: United States Nitrile Butadiene Rubber Industry Volume (K Tons) Forecast, by Application 2020 & 2033
- Table 39: Canada Nitrile Butadiene Rubber Industry Revenue (Million) Forecast, by Application 2020 & 2033
- Table 40: Canada Nitrile Butadiene Rubber Industry Volume (K Tons) Forecast, by Application 2020 & 2033
- Table 41: Mexico Nitrile Butadiene Rubber Industry Revenue (Million) Forecast, by Application 2020 & 2033
- Table 42: Mexico Nitrile Butadiene Rubber Industry Volume (K Tons) Forecast, by Application 2020 & 2033
- Table 43: Global Nitrile Butadiene Rubber Industry Revenue Million Forecast, by Application 2020 & 2033
- Table 44: Global Nitrile Butadiene Rubber Industry Volume K Tons Forecast, by Application 2020 & 2033
- Table 45: Global Nitrile Butadiene Rubber Industry Revenue Million Forecast, by End-user Industry 2020 & 2033
- Table 46: Global Nitrile Butadiene Rubber Industry Volume K Tons Forecast, by End-user Industry 2020 & 2033
- Table 47: Global Nitrile Butadiene Rubber Industry Revenue Million Forecast, by Country 2020 & 2033
- Table 48: Global Nitrile Butadiene Rubber Industry Volume K Tons Forecast, by Country 2020 & 2033
- Table 49: Germany Nitrile Butadiene Rubber Industry Revenue (Million) Forecast, by Application 2020 & 2033
- Table 50: Germany Nitrile Butadiene Rubber Industry Volume (K Tons) Forecast, by Application 2020 & 2033
- Table 51: United Kingdom Nitrile Butadiene Rubber Industry Revenue (Million) Forecast, by Application 2020 & 2033
- Table 52: United Kingdom Nitrile Butadiene Rubber Industry Volume (K Tons) Forecast, by Application 2020 & 2033
- Table 53: Italy Nitrile Butadiene Rubber Industry Revenue (Million) Forecast, by Application 2020 & 2033
- Table 54: Italy Nitrile Butadiene Rubber Industry Volume (K Tons) Forecast, by Application 2020 & 2033
- Table 55: France Nitrile Butadiene Rubber Industry Revenue (Million) Forecast, by Application 2020 & 2033
- Table 56: France Nitrile Butadiene Rubber Industry Volume (K Tons) Forecast, by Application 2020 & 2033
- Table 57: Spain Nitrile Butadiene Rubber Industry Revenue (Million) Forecast, by Application 2020 & 2033
- Table 58: Spain Nitrile Butadiene Rubber Industry Volume (K Tons) Forecast, by Application 2020 & 2033
- Table 59: Turkey Nitrile Butadiene Rubber Industry Revenue (Million) Forecast, by Application 2020 & 2033
- Table 60: Turkey Nitrile Butadiene Rubber Industry Volume (K Tons) Forecast, by Application 2020 & 2033
- Table 61: Russia Nitrile Butadiene Rubber Industry Revenue (Million) Forecast, by Application 2020 & 2033
- Table 62: Russia Nitrile Butadiene Rubber Industry Volume (K Tons) Forecast, by Application 2020 & 2033
- Table 63: NORDIC Nitrile Butadiene Rubber Industry Revenue (Million) Forecast, by Application 2020 & 2033
- Table 64: NORDIC Nitrile Butadiene Rubber Industry Volume (K Tons) Forecast, by Application 2020 & 2033
- Table 65: Rest of Europe Nitrile Butadiene Rubber Industry Revenue (Million) Forecast, by Application 2020 & 2033
- Table 66: Rest of Europe Nitrile Butadiene Rubber Industry Volume (K Tons) Forecast, by Application 2020 & 2033
- Table 67: Global Nitrile Butadiene Rubber Industry Revenue Million Forecast, by Application 2020 & 2033
- Table 68: Global Nitrile Butadiene Rubber Industry Volume K Tons Forecast, by Application 2020 & 2033
- Table 69: Global Nitrile Butadiene Rubber Industry Revenue Million Forecast, by End-user Industry 2020 & 2033
- Table 70: Global Nitrile Butadiene Rubber Industry Volume K Tons Forecast, by End-user Industry 2020 & 2033
- Table 71: Global Nitrile Butadiene Rubber Industry Revenue Million Forecast, by Country 2020 & 2033
- Table 72: Global Nitrile Butadiene Rubber Industry Volume K Tons Forecast, by Country 2020 & 2033
- Table 73: Brazil Nitrile Butadiene Rubber Industry Revenue (Million) Forecast, by Application 2020 & 2033
- Table 74: Brazil Nitrile Butadiene Rubber Industry Volume (K Tons) Forecast, by Application 2020 & 2033
- Table 75: Argentina Nitrile Butadiene Rubber Industry Revenue (Million) Forecast, by Application 2020 & 2033
- Table 76: Argentina Nitrile Butadiene Rubber Industry Volume (K Tons) Forecast, by Application 2020 & 2033
- Table 77: Colombia Nitrile Butadiene Rubber Industry Revenue (Million) Forecast, by Application 2020 & 2033
- Table 78: Colombia Nitrile Butadiene Rubber Industry Volume (K Tons) Forecast, by Application 2020 & 2033
- Table 79: Rest of South America Nitrile Butadiene Rubber Industry Revenue (Million) Forecast, by Application 2020 & 2033
- Table 80: Rest of South America Nitrile Butadiene Rubber Industry Volume (K Tons) Forecast, by Application 2020 & 2033
- Table 81: Global Nitrile Butadiene Rubber Industry Revenue Million Forecast, by Application 2020 & 2033
- Table 82: Global Nitrile Butadiene Rubber Industry Volume K Tons Forecast, by Application 2020 & 2033
- Table 83: Global Nitrile Butadiene Rubber Industry Revenue Million Forecast, by End-user Industry 2020 & 2033
- Table 84: Global Nitrile Butadiene Rubber Industry Volume K Tons Forecast, by End-user Industry 2020 & 2033
- Table 85: Global Nitrile Butadiene Rubber Industry Revenue Million Forecast, by Country 2020 & 2033
- Table 86: Global Nitrile Butadiene Rubber Industry Volume K Tons Forecast, by Country 2020 & 2033
- Table 87: Saudi Arabia Nitrile Butadiene Rubber Industry Revenue (Million) Forecast, by Application 2020 & 2033
- Table 88: Saudi Arabia Nitrile Butadiene Rubber Industry Volume (K Tons) Forecast, by Application 2020 & 2033
- Table 89: South Africa Nitrile Butadiene Rubber Industry Revenue (Million) Forecast, by Application 2020 & 2033
- Table 90: South Africa Nitrile Butadiene Rubber Industry Volume (K Tons) Forecast, by Application 2020 & 2033
- Table 91: Nigeria Nitrile Butadiene Rubber Industry Revenue (Million) Forecast, by Application 2020 & 2033
- Table 92: Nigeria Nitrile Butadiene Rubber Industry Volume (K Tons) Forecast, by Application 2020 & 2033
- Table 93: Egypt Nitrile Butadiene Rubber Industry Revenue (Million) Forecast, by Application 2020 & 2033
- Table 94: Egypt Nitrile Butadiene Rubber Industry Volume (K Tons) Forecast, by Application 2020 & 2033
- Table 95: Qatar Nitrile Butadiene Rubber Industry Revenue (Million) Forecast, by Application 2020 & 2033
- Table 96: Qatar Nitrile Butadiene Rubber Industry Volume (K Tons) Forecast, by Application 2020 & 2033
- Table 97: UAE Nitrile Butadiene Rubber Industry Revenue (Million) Forecast, by Application 2020 & 2033
- Table 98: UAE Nitrile Butadiene Rubber Industry Volume (K Tons) Forecast, by Application 2020 & 2033
- Table 99: Rest of Middle East and Africa Nitrile Butadiene Rubber Industry Revenue (Million) Forecast, by Application 2020 & 2033
- Table 100: Rest of Middle East and Africa Nitrile Butadiene Rubber Industry Volume (K Tons) Forecast, by Application 2020 & 2033
Frequently Asked Questions
1. What is the projected Compound Annual Growth Rate (CAGR) of the Nitrile Butadiene Rubber Industry?
The projected CAGR is approximately 6.31%.
2. Which companies are prominent players in the Nitrile Butadiene Rubber Industry?
Key companies in the market include Versalis S p A, ARLANXEO, Synthos, ZEON CORPORATION*List Not Exhaustive, Dynasol Group, ENEOS Materials Corporation, KUMHO PETROCHEMICAL, SIBUR, Synthomer PLC, LG Chem, China Petrochemical Corporation (Sinopec), Apcotex, Lanxess, TSRC.
3. What are the main segments of the Nitrile Butadiene Rubber Industry?
The market segments include Application, End-user Industry.
4. Can you provide details about the market size?
The market size is estimated to be USD 2.51 Million as of 2022.
5. What are some drivers contributing to market growth?
Expanding Automotive Industry; Industrial and Infrastructure Development Projects.
6. What are the notable trends driving market growth?
Automotive and Transportation Sector Dominates the Market.
7. Are there any restraints impacting market growth?
Availability of Substitute Materials; Fluctuating Raw Material Prices.
8. Can you provide examples of recent developments in the market?
August 2022: Kumho Petrochemical will be KRW6,000 billion (~USD 5.10 billion) into existing and new businesses in the next five years. As part of the initiative, Kumho will invest KRW 3,300 billion (~USD 2.81 billion) in its core business areas, which include nitrile butadiene latex (NB latex) production and styrene solution butadiene rubber (SSBR) manufacturing.
9. What pricing options are available for accessing the report?
Pricing options include single-user, multi-user, and enterprise licenses priced at USD 4750, USD 5250, and USD 8750 respectively.
10. Is the market size provided in terms of value or volume?
The market size is provided in terms of value, measured in Million and volume, measured in K Tons.
11. Are there any specific market keywords associated with the report?
Yes, the market keyword associated with the report is "Nitrile Butadiene Rubber Industry," which aids in identifying and referencing the specific market segment covered.
12. How do I determine which pricing option suits my needs best?
The pricing options vary based on user requirements and access needs. Individual users may opt for single-user licenses, while businesses requiring broader access may choose multi-user or enterprise licenses for cost-effective access to the report.
13. Are there any additional resources or data provided in the Nitrile Butadiene Rubber Industry report?
While the report offers comprehensive insights, it's advisable to review the specific contents or supplementary materials provided to ascertain if additional resources or data are available.
14. How can I stay updated on further developments or reports in the Nitrile Butadiene Rubber Industry?
To stay informed about further developments, trends, and reports in the Nitrile Butadiene Rubber Industry, consider subscribing to industry newsletters, following relevant companies and organizations, or regularly checking reputable industry news sources and publications.
Methodology
Step 1 - Identification of Relevant Samples Size from Population Database


Step 2 - Approaches for Defining Global Market Size (Value, Volume* & Price*)

Note*: In applicable scenarios
Step 3 - Data Sources
Primary Research
- Web Analytics
- Survey Reports
- Research Institute
- Latest Research Reports
- Opinion Leaders
Secondary Research
- Annual Reports
- White Paper
- Latest Press Release
- Industry Association
- Paid Database
- Investor Presentations

Step 4 - Data Triangulation
Involves using different sources of information in order to increase the validity of a study
These sources are likely to be stakeholders in a program - participants, other researchers, program staff, other community members, and so on.
Then we put all data in single framework & apply various statistical tools to find out the dynamic on the market.
During the analysis stage, feedback from the stakeholder groups would be compared to determine areas of agreement as well as areas of divergence