

Key Insights
The Global Bleaching Clay Market is projected for substantial growth, forecasted to reach USD 1.7 billion by 2025, exhibiting a Compound Annual Growth Rate (CAGR) of 5.5%. This expansion is driven by escalating demand for purified edible oils and fats, a consequence of population growth and increased health consciousness. The food and beverage sector is the primary consumer, vital for refining vegetable and animal fats. The burgeoning cosmetics and personal care industries, utilizing bleaching clays for product purification and formulation, also significantly contribute to market development. Emerging applications in the chemicals sector, including lubricating oils and waxes, further bolster this positive trend.
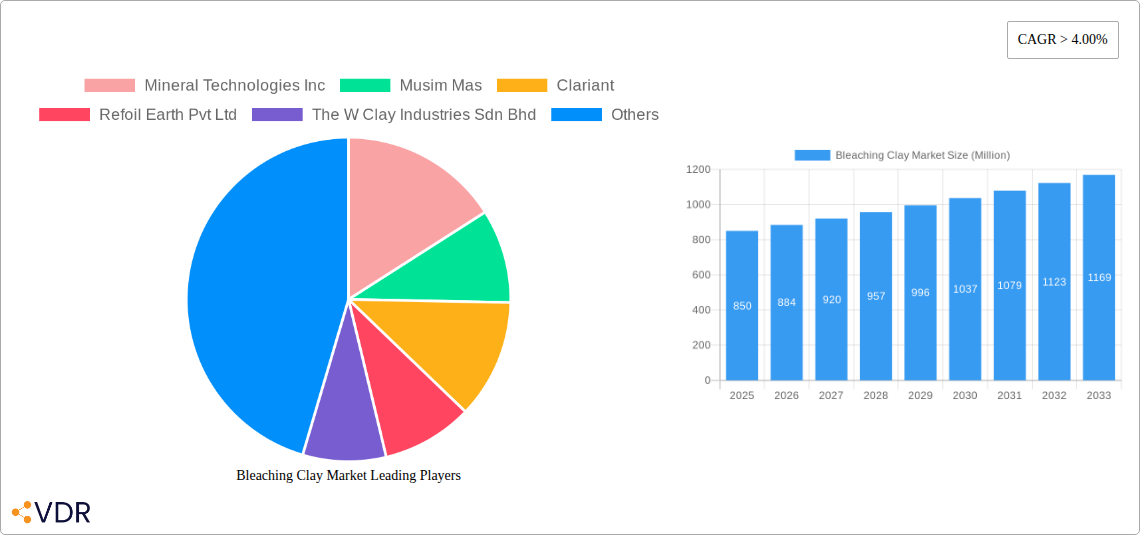
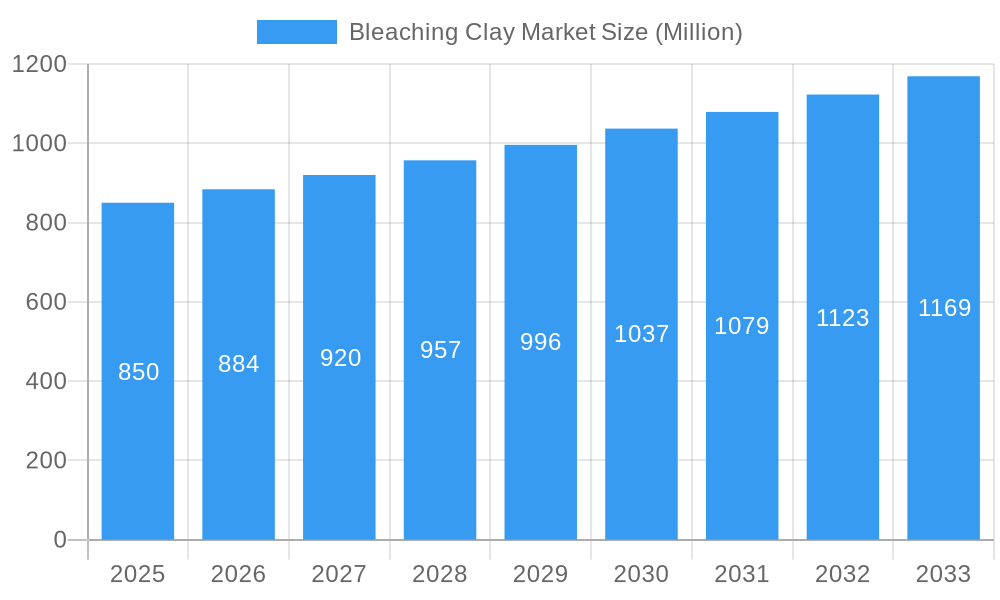
Bleaching Clay Market Market Size (In Billion)
Key market drivers include the cost-effectiveness and superior adsorption capabilities of bleaching clays over synthetic alternatives, making them essential for efficient purification. The growing adoption in rapidly developing economies, especially in the Asia Pacific region, is a critical growth catalyst. Market restraints involve fluctuating raw material prices and environmental concerns regarding spent bleaching clay disposal. Emerging trends like innovations in regeneration technologies and sustainable bleaching clay solutions are poised to address these challenges and accelerate market growth. Geographically, the Asia Pacific region is expected to dominate due to its significant agricultural output and high consumer demand.
Bleaching Clay Market Company Market Share
Bleaching Clay Market Report: Comprehensive Analysis & Future Outlook (2019-2033)
This in-depth report provides a definitive analysis of the global Bleaching Clay Market, encompassing its intricate dynamics, growth trajectories, and future potential. We delve into critical segments such as parent and child markets, offering unparalleled insights for industry stakeholders. Our comprehensive research covers a study period from 2019 to 2033, with a base year of 2025, offering a robust estimation and forecast.
Bleaching Clay Market Market Dynamics & Structure
The Bleaching Clay Market is characterized by a moderately concentrated structure, with key players investing heavily in R&D to enhance product efficacy and sustainability. Technological innovation is a primary driver, focusing on improved adsorption capabilities, cost-effectiveness, and environmentally friendly production processes for bleaching clay types like activated bauxite and fuller's earth. Regulatory frameworks, particularly concerning food safety and environmental impact, significantly influence product development and market entry. Competitive product substitutes, such as synthetic adsorbents, pose a constant challenge, necessitating continuous innovation in natural bleaching clays. End-user demographics are shifting towards greater demand for natural and organic ingredients in cosmetics and food, boosting the market for high-quality, food-grade bleaching clays. Mergers and acquisitions (M&A) are strategic moves to expand market reach, acquire new technologies, and consolidate market share. For instance, a notable M&A trend saw a global player acquire a specialized producer of activated clays in 2023, with an estimated deal volume of $XX million, aiming to strengthen its position in the edible oil refining sector. Innovation barriers include the high capital expenditure required for advanced processing technologies and the need for extensive regulatory approvals, particularly for food and pharmaceutical applications.
- Market Concentration: Moderately concentrated with significant market share held by top players.
- Technological Innovation: Focus on enhanced adsorption, eco-friendly production, and specialty grades.
- Regulatory Frameworks: Stringent regulations in food, cosmetic, and chemical industries shaping product standards.
- Competitive Substitutes: Rise of synthetic adsorbents necessitates differentiation through performance and sustainability.
- End-User Demographics: Growing demand for natural ingredients in food and personal care products.
- M&A Trends: Strategic acquisitions to gain market share, access new technologies, and expand geographical presence.
Bleaching Clay Market Growth Trends & Insights
The Bleaching Clay Market is poised for significant growth, driven by an escalating global demand for refined oils, fats, and petrochemical products. Leveraging advanced analytical tools, our research indicates a robust market size evolution from an estimated $XXXX million in 2025, projected to reach $XXXX million by 2033, exhibiting a Compound Annual Growth Rate (CAGR) of XX%. Adoption rates of high-performance bleaching clays, particularly for specialized applications like the purification of biodiesel and high-grade industrial oils, are accelerating. Technological disruptions are primarily centered around developing more efficient and sustainable bleaching processes, including novel activation techniques and improved regeneration methods for used clays. Consumer behavior shifts, particularly the increasing preference for natural ingredients in food and cosmetic products, are creating a strong demand for food-grade and cosmetic-grade bleaching clays. This trend directly impacts the vegetable oil and animal fats segment, as well as the cosmetics and personal care industry. Furthermore, the expanding petrochemical industry, with its need for effective filtration and purification agents, contributes to sustained demand. The market penetration of specialty bleaching clays, tailored for specific impurity removal, is also on an upward trajectory. For example, the demand for Fuller's Earth in cosmetic applications has seen a XX% increase in adoption over the past three years due to its natural absorbent properties. The environmental imperative to reduce waste and improve the efficiency of refining processes is also a key growth driver, pushing manufacturers towards sustainable and regenerable bleaching clay solutions. The global market's responsiveness to evolving industrial needs, coupled with continuous product development, underpins this optimistic growth forecast.
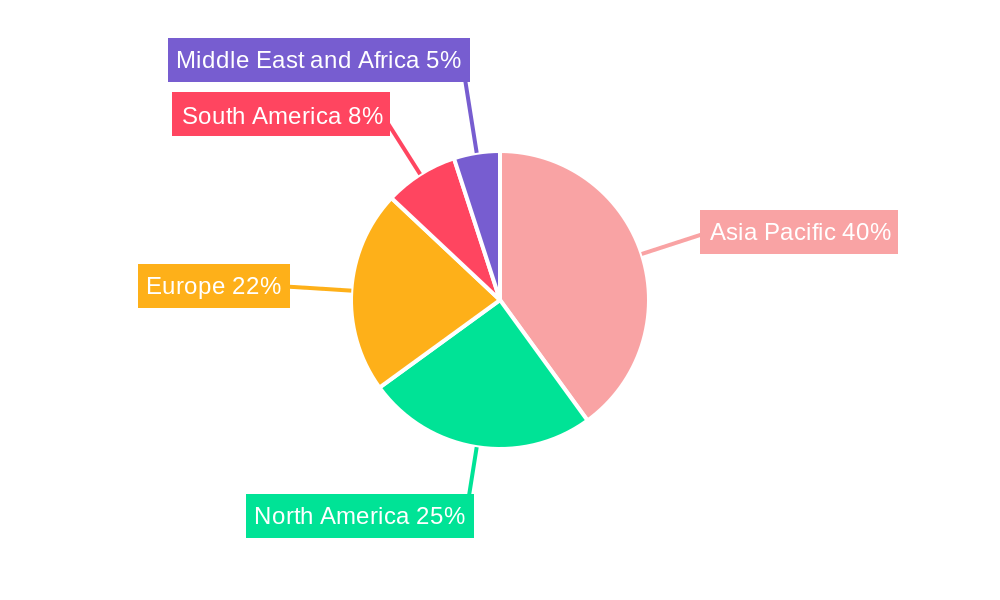
Dominant Regions, Countries, or Segments in Bleaching Clay Market
The Asia Pacific region is emerging as the dominant force in the global Bleaching Clay Market, driven by a confluence of robust industrialization, a burgeoning food processing sector, and significant expansion in the cosmetics and personal care industries. Within this region, countries like China and India are key growth engines, owing to their massive domestic consumption and substantial manufacturing capacities. China's extensive food and beverage industry, coupled with its prominent role in global chemical production, fuels a substantial demand for various types of bleaching clays. India, with its rapidly growing edible oil production and a booming personal care market, further solidifies Asia Pacific's dominance.
From a Segment perspective, Activated Clays represent the largest and most dynamic category within the Bleaching Clay Market. This dominance is attributed to their versatility and widespread application across numerous industries. The Vegetable Oil and Animal Fats segment within Application is a primary consumer of activated clays, essential for decolorizing and purifying edible oils and fats, a market projected to contribute $XXXX million in 2025. This segment's growth is intrinsically linked to increasing global food demand and the rising preference for healthier, refined oils.
The Food and Beverage end-user industry significantly influences the market's trajectory. The demand for bleached vegetable oils, processed foods, and confectionery products directly translates into a sustained need for high-purity bleaching clays. Economic policies supporting agricultural processing and food security in developing nations further bolster this demand. Infrastructure development, particularly in logistics and storage for raw materials and finished products, also plays a crucial role in facilitating market growth across dominant regions. The market share of Activated Clays in the overall Bleaching Clay Market is estimated at XX% in 2025, showcasing its commanding presence. Growth potential in Asia Pacific is further amplified by favorable government initiatives promoting domestic manufacturing and export-oriented industries, creating a fertile ground for bleaching clay producers. The region's increasing disposable income also translates to higher consumption of processed food and personal care products, indirectly driving the demand for bleaching clays.
- Dominant Region: Asia Pacific (China, India)
- Dominant Segment (Type): Activated Clays
- Dominant Segment (Application): Vegetable Oil and Animal Fats
- Dominant End-user Industry: Food and Beverage
- Key Drivers: Industrialization, burgeoning food processing, expanding cosmetics and personal care, economic policies, infrastructure development.
Bleaching Clay Market Product Landscape
The Bleaching Clay Market product landscape is characterized by continuous innovation aimed at enhancing purification efficiency and sustainability. Key product developments include advanced activated bauxite with superior adsorption capacities for refining high-viscosity mineral oils and waxes, and specialized activated clays engineered for the selective removal of specific impurities in vegetable oils. Fuller's Earth derivatives, increasingly processed for improved fine particle size distribution, are gaining traction in cosmetic applications for their enhanced sebum absorption and matting properties. These products offer unique selling propositions through higher bleaching efficiency, reduced acid consumption, and better de-oiling capabilities, leading to higher product yields for end-users. Technological advancements in activation processes, such as controlled steam activation and acid treatment optimization, are crucial in differentiating product performance and meeting stringent industry standards for purity and safety.
Key Drivers, Barriers & Challenges in Bleaching Clay Market
Key Drivers:
- Rising Demand for Refined Edible Oils: Global population growth and changing dietary habits fuel the need for purified vegetable oils and animal fats.
- Expansion of Food & Beverage Industry: Increased consumption of processed foods, snacks, and baked goods directly increases demand for bleaching agents.
- Growth in Cosmetics and Personal Care: The demand for natural ingredients and improved product formulations drives the use of bleaching clays in cosmetics.
- Petrochemical Industry Advancements: Increasing demand for purified mineral oils, waxes, and lubricants in various industrial applications.
- Environmental Regulations: Growing emphasis on sustainable refining practices and the use of eco-friendly processing aids.
Barriers & Challenges:
- Price Volatility of Raw Materials: Fluctuations in the cost of bentonite and bauxite can impact profit margins.
- Competition from Synthetic Adsorbents: The development of advanced synthetic adsorbents poses a competitive threat.
- Stringent Quality Control & Regulatory Compliance: Meeting international standards for food-grade and pharmaceutical-grade bleaching clays requires significant investment and adherence.
- Disposal of Spent Bleaching Clay: Environmental concerns regarding the disposal of used bleaching clay require innovative regeneration solutions.
- Supply Chain Disruptions: Geopolitical factors and logistical challenges can impact the availability and cost of raw materials.
Emerging Opportunities in Bleaching Clay Market
Emerging opportunities in the Bleaching Clay Market lie in the development of highly specialized and sustainable bleaching solutions. Untapped markets in emerging economies with rapidly growing food processing and personal care industries present significant growth potential. Innovative applications, such as the use of bio-activated clays for purifying biofuels and pharmaceutical intermediates, are gaining traction. Evolving consumer preferences towards "clean label" products are creating a demand for natural, minimally processed bleaching agents with enhanced functional properties. Furthermore, the development of efficient and cost-effective regeneration technologies for spent bleaching clay offers a significant opportunity to reduce waste and improve the circularity of the market. Investment in research and development for novel activation methods and the extraction of rare earth elements from bleaching clay waste streams are also areas of burgeoning interest.
Growth Accelerators in the Bleaching Clay Market Industry
Long-term growth in the Bleaching Clay Market is being accelerated by several key catalysts. Technological breakthroughs in sustainable activation processes, such as microwave and ultrasonic activation, are leading to more energy-efficient and environmentally friendly production methods for activated clays. Strategic partnerships between bleaching clay manufacturers and end-users, particularly in the food and chemical sectors, are fostering co-development of customized solutions that meet specific purification needs. Market expansion strategies, including the penetration of untapped geographical regions and the diversification into high-value niche applications like edible oil refining for infant formula and specialized lubricants, are further propelling growth. The increasing adoption of advanced analytics and AI in optimizing bleaching processes also contributes to enhanced efficiency and cost-effectiveness, making bleaching clays a more attractive option.
Key Players Shaping the Bleaching Clay Market Market
- Mineral Technologies Inc
- Musim Mas
- Clariant
- Refoil Earth Pvt Ltd
- The W Clay Industries Sdn Bhd
- HRP Industries
- Ashapura Group
- Oil-Dri Corporation of America
- EP Minerals
- Taiko Clay Marketing Sdn Bhd
Notable Milestones in Bleaching Clay Market Sector
- 2019: Mineral Technologies Inc. acquires Cleansorb, expanding its product portfolio in adsorbent technologies.
- 2020: Musim Mas invests in R&D for sustainable palm oil processing, including advanced bleaching techniques.
- 2021: Clariant launches new range of high-performance activated clays for challenging industrial applications.
- 2022: Refoil Earth Pvt Ltd secures significant funding to scale up production of eco-friendly bleaching clays.
- 2023 (Month XX): The W Clay Industries Sdn Bhd announces expansion of its manufacturing capacity to meet rising regional demand.
- 2024 (Month XX): Oil-Dri Corporation of America unveils a new generation of activated bauxite with improved filtration efficiency.
In-Depth Bleaching Clay Market Market Outlook
The future outlook for the Bleaching Clay Market remains exceptionally promising, underpinned by robust growth accelerators and emerging opportunities. The increasing global demand for purified edible oils, coupled with the expanding applications in cosmetics, personal care, and the chemical industry, will continue to drive market expansion. Innovations in sustainable production and regeneration technologies are poised to address environmental concerns and enhance the economic viability of bleaching clays. Strategic collaborations and R&D investments will further unlock new applications and improve product performance. The market is expected to witness a steady increase in demand for specialty bleaching clays tailored to specific purification needs, offering significant opportunities for players who can innovate and adapt to evolving industry requirements. The Asia Pacific region, with its strong industrial growth, is anticipated to remain a dominant market, while other regions are also expected to contribute significantly to overall market expansion.
Bleaching Clay Market Segmentation
-
1. Type
- 1.1. Activated Bauxite
- 1.2. Activated Clays
- 1.3. Fuller's Earth
-
2. Application
- 2.1. Industrial Oil
- 2.2. Mineral Oil and Waxes
- 2.3. Vegetable Oil and Animal Fats
-
3. End-user Industry
- 3.1. Food and Beverage
- 3.2. Cosmetics and Personal Care
- 3.3. Chemicals
- 3.4. Other End-user Industries
Bleaching Clay Market Segmentation By Geography
-
1. Asia Pacific
- 1.1. China
- 1.2. India
- 1.3. Japan
- 1.4. South Korea
- 1.5. Rest of Asia Pacific
-
2. North America
- 2.1. United States
- 2.2. Canada
- 2.3. Mexico
-
3. Europe
- 3.1. Germany
- 3.2. United Kingdom
- 3.3. Italy
- 3.4. France
- 3.5. Rest of Europe
-
4. South America
- 4.1. Brazil
- 4.2. Argentina
- 4.3. Rest of South America
-
5. Middle East and Africa
- 5.1. Saudi Arabia
- 5.2. South Africa
- 5.3. Rest of Middle East and Africa
Bleaching Clay Market Regional Market Share
Geographic Coverage of Bleaching Clay Market
Bleaching Clay Market REPORT HIGHLIGHTS
| Aspects | Details |
|---|---|
| Study Period | 2020-2034 |
| Base Year | 2025 |
| Estimated Year | 2026 |
| Forecast Period | 2026-2034 |
| Historical Period | 2020-2025 |
| Growth Rate | CAGR of 5.5% from 2020-2034 |
| Segmentation |
|
Table of Contents
- 1. Introduction
- 1.1. Research Scope
- 1.2. Market Segmentation
- 1.3. Research Objective
- 1.4. Definitions and Assumptions
- 2. Executive Summary
- 2.1. Market Snapshot
- 3. Market Dynamics
- 3.1. Market Drivers
- 3.2. Market Restrains
- 3.3. Market Trends
- 3.4. Market Opportunities
- 4. Market Factor Analysis
- 4.1. Porters Five Forces
- 4.1.1. Bargaining Power of Suppliers
- 4.1.2. Bargaining Power of Buyers
- 4.1.3. Threat of New Entrants
- 4.1.4. Threat of Substitutes
- 4.1.5. Competitive Rivalry
- 4.2. PESTEL analysis
- 4.3. BCG Analysis
- 4.3.1. Stars (High Growth, High Market Share)
- 4.3.2. Cash Cows (Low Growth, High Market Share)
- 4.3.3. Question Mark (High Growth, Low Market Share)
- 4.3.4. Dogs (Low Growth, Low Market Share)
- 4.4. Ansoff Matrix Analysis
- 4.5. Supply Chain Analysis
- 4.6. Regulatory Landscape
- 4.7. Current Market Potential and Opportunity Assessment (TAM–SAM–SOM Framework)
- 4.8. VDR Analyst Note
- 4.1. Porters Five Forces
- 5. Market Analysis, Insights and Forecast 2021-2033
- 5.1. Market Analysis, Insights and Forecast - by Type
- 5.1.1. Activated Bauxite
- 5.1.2. Activated Clays
- 5.1.3. Fuller's Earth
- 5.2. Market Analysis, Insights and Forecast - by Application
- 5.2.1. Industrial Oil
- 5.2.2. Mineral Oil and Waxes
- 5.2.3. Vegetable Oil and Animal Fats
- 5.3. Market Analysis, Insights and Forecast - by End-user Industry
- 5.3.1. Food and Beverage
- 5.3.2. Cosmetics and Personal Care
- 5.3.3. Chemicals
- 5.3.4. Other End-user Industries
- 5.4. Market Analysis, Insights and Forecast - by Region
- 5.4.1. Asia Pacific
- 5.4.2. North America
- 5.4.3. Europe
- 5.4.4. South America
- 5.4.5. Middle East and Africa
- 5.1. Market Analysis, Insights and Forecast - by Type
- 6. Global Bleaching Clay Market Analysis, Insights and Forecast, 2021-2033
- 6.1. Market Analysis, Insights and Forecast - by Type
- 6.1.1. Activated Bauxite
- 6.1.2. Activated Clays
- 6.1.3. Fuller's Earth
- 6.2. Market Analysis, Insights and Forecast - by Application
- 6.2.1. Industrial Oil
- 6.2.2. Mineral Oil and Waxes
- 6.2.3. Vegetable Oil and Animal Fats
- 6.3. Market Analysis, Insights and Forecast - by End-user Industry
- 6.3.1. Food and Beverage
- 6.3.2. Cosmetics and Personal Care
- 6.3.3. Chemicals
- 6.3.4. Other End-user Industries
- 6.1. Market Analysis, Insights and Forecast - by Type
- 7. Asia Pacific Bleaching Clay Market Analysis, Insights and Forecast, 2021-2033
- 7.1. Market Analysis, Insights and Forecast - by Type
- 7.1.1. Activated Bauxite
- 7.1.2. Activated Clays
- 7.1.3. Fuller's Earth
- 7.2. Market Analysis, Insights and Forecast - by Application
- 7.2.1. Industrial Oil
- 7.2.2. Mineral Oil and Waxes
- 7.2.3. Vegetable Oil and Animal Fats
- 7.3. Market Analysis, Insights and Forecast - by End-user Industry
- 7.3.1. Food and Beverage
- 7.3.2. Cosmetics and Personal Care
- 7.3.3. Chemicals
- 7.3.4. Other End-user Industries
- 7.1. Market Analysis, Insights and Forecast - by Type
- 8. North America Bleaching Clay Market Analysis, Insights and Forecast, 2021-2033
- 8.1. Market Analysis, Insights and Forecast - by Type
- 8.1.1. Activated Bauxite
- 8.1.2. Activated Clays
- 8.1.3. Fuller's Earth
- 8.2. Market Analysis, Insights and Forecast - by Application
- 8.2.1. Industrial Oil
- 8.2.2. Mineral Oil and Waxes
- 8.2.3. Vegetable Oil and Animal Fats
- 8.3. Market Analysis, Insights and Forecast - by End-user Industry
- 8.3.1. Food and Beverage
- 8.3.2. Cosmetics and Personal Care
- 8.3.3. Chemicals
- 8.3.4. Other End-user Industries
- 8.1. Market Analysis, Insights and Forecast - by Type
- 9. Europe Bleaching Clay Market Analysis, Insights and Forecast, 2021-2033
- 9.1. Market Analysis, Insights and Forecast - by Type
- 9.1.1. Activated Bauxite
- 9.1.2. Activated Clays
- 9.1.3. Fuller's Earth
- 9.2. Market Analysis, Insights and Forecast - by Application
- 9.2.1. Industrial Oil
- 9.2.2. Mineral Oil and Waxes
- 9.2.3. Vegetable Oil and Animal Fats
- 9.3. Market Analysis, Insights and Forecast - by End-user Industry
- 9.3.1. Food and Beverage
- 9.3.2. Cosmetics and Personal Care
- 9.3.3. Chemicals
- 9.3.4. Other End-user Industries
- 9.1. Market Analysis, Insights and Forecast - by Type
- 10. South America Bleaching Clay Market Analysis, Insights and Forecast, 2021-2033
- 10.1. Market Analysis, Insights and Forecast - by Type
- 10.1.1. Activated Bauxite
- 10.1.2. Activated Clays
- 10.1.3. Fuller's Earth
- 10.2. Market Analysis, Insights and Forecast - by Application
- 10.2.1. Industrial Oil
- 10.2.2. Mineral Oil and Waxes
- 10.2.3. Vegetable Oil and Animal Fats
- 10.3. Market Analysis, Insights and Forecast - by End-user Industry
- 10.3.1. Food and Beverage
- 10.3.2. Cosmetics and Personal Care
- 10.3.3. Chemicals
- 10.3.4. Other End-user Industries
- 10.1. Market Analysis, Insights and Forecast - by Type
- 11. Middle East and Africa Bleaching Clay Market Analysis, Insights and Forecast, 2021-2033
- 11.1. Market Analysis, Insights and Forecast - by Type
- 11.1.1. Activated Bauxite
- 11.1.2. Activated Clays
- 11.1.3. Fuller's Earth
- 11.2. Market Analysis, Insights and Forecast - by Application
- 11.2.1. Industrial Oil
- 11.2.2. Mineral Oil and Waxes
- 11.2.3. Vegetable Oil and Animal Fats
- 11.3. Market Analysis, Insights and Forecast - by End-user Industry
- 11.3.1. Food and Beverage
- 11.3.2. Cosmetics and Personal Care
- 11.3.3. Chemicals
- 11.3.4. Other End-user Industries
- 11.1. Market Analysis, Insights and Forecast - by Type
- 12. Competitive Analysis
- 12.1. Company Profiles
- 12.1.1 Mineral Technologies Inc
- 12.1.1.1. Company Overview
- 12.1.1.2. Products
- 12.1.1.3. Company Financials
- 12.1.1.4. SWOT Analysis
- 12.1.2 Musim Mas
- 12.1.2.1. Company Overview
- 12.1.2.2. Products
- 12.1.2.3. Company Financials
- 12.1.2.4. SWOT Analysis
- 12.1.3 Clariant
- 12.1.3.1. Company Overview
- 12.1.3.2. Products
- 12.1.3.3. Company Financials
- 12.1.3.4. SWOT Analysis
- 12.1.4 Refoil Earth Pvt Ltd
- 12.1.4.1. Company Overview
- 12.1.4.2. Products
- 12.1.4.3. Company Financials
- 12.1.4.4. SWOT Analysis
- 12.1.5 The W Clay Industries Sdn Bhd
- 12.1.5.1. Company Overview
- 12.1.5.2. Products
- 12.1.5.3. Company Financials
- 12.1.5.4. SWOT Analysis
- 12.1.6 HRP Industries
- 12.1.6.1. Company Overview
- 12.1.6.2. Products
- 12.1.6.3. Company Financials
- 12.1.6.4. SWOT Analysis
- 12.1.7 Ashapura Group
- 12.1.7.1. Company Overview
- 12.1.7.2. Products
- 12.1.7.3. Company Financials
- 12.1.7.4. SWOT Analysis
- 12.1.8 Oil-Dri Corporation of America
- 12.1.8.1. Company Overview
- 12.1.8.2. Products
- 12.1.8.3. Company Financials
- 12.1.8.4. SWOT Analysis
- 12.1.9 EP Minerals
- 12.1.9.1. Company Overview
- 12.1.9.2. Products
- 12.1.9.3. Company Financials
- 12.1.9.4. SWOT Analysis
- 12.1.10 Taiko Clay Marketing Sdn Bhd
- 12.1.10.1. Company Overview
- 12.1.10.2. Products
- 12.1.10.3. Company Financials
- 12.1.10.4. SWOT Analysis
- 12.1.1 Mineral Technologies Inc
- 12.2. Market Entropy
- 12.2.1 Company's Key Areas Served
- 12.2.2 Recent Developments
- 12.3. Company Market Share Analysis 2025
- 12.3.1 Top 5 Companies Market Share Analysis
- 12.3.2 Top 3 Companies Market Share Analysis
- 12.4. List of Potential Customers
- 13. Research Methodology
List of Figures
- Figure 1: Global Bleaching Clay Market Revenue Breakdown (billion, %) by Region 2025 & 2033
- Figure 2: Global Bleaching Clay Market Volume Breakdown (K Tons, %) by Region 2025 & 2033
- Figure 3: Asia Pacific Bleaching Clay Market Revenue (billion), by Type 2025 & 2033
- Figure 4: Asia Pacific Bleaching Clay Market Volume (K Tons), by Type 2025 & 2033
- Figure 5: Asia Pacific Bleaching Clay Market Revenue Share (%), by Type 2025 & 2033
- Figure 6: Asia Pacific Bleaching Clay Market Volume Share (%), by Type 2025 & 2033
- Figure 7: Asia Pacific Bleaching Clay Market Revenue (billion), by Application 2025 & 2033
- Figure 8: Asia Pacific Bleaching Clay Market Volume (K Tons), by Application 2025 & 2033
- Figure 9: Asia Pacific Bleaching Clay Market Revenue Share (%), by Application 2025 & 2033
- Figure 10: Asia Pacific Bleaching Clay Market Volume Share (%), by Application 2025 & 2033
- Figure 11: Asia Pacific Bleaching Clay Market Revenue (billion), by End-user Industry 2025 & 2033
- Figure 12: Asia Pacific Bleaching Clay Market Volume (K Tons), by End-user Industry 2025 & 2033
- Figure 13: Asia Pacific Bleaching Clay Market Revenue Share (%), by End-user Industry 2025 & 2033
- Figure 14: Asia Pacific Bleaching Clay Market Volume Share (%), by End-user Industry 2025 & 2033
- Figure 15: Asia Pacific Bleaching Clay Market Revenue (billion), by Country 2025 & 2033
- Figure 16: Asia Pacific Bleaching Clay Market Volume (K Tons), by Country 2025 & 2033
- Figure 17: Asia Pacific Bleaching Clay Market Revenue Share (%), by Country 2025 & 2033
- Figure 18: Asia Pacific Bleaching Clay Market Volume Share (%), by Country 2025 & 2033
- Figure 19: North America Bleaching Clay Market Revenue (billion), by Type 2025 & 2033
- Figure 20: North America Bleaching Clay Market Volume (K Tons), by Type 2025 & 2033
- Figure 21: North America Bleaching Clay Market Revenue Share (%), by Type 2025 & 2033
- Figure 22: North America Bleaching Clay Market Volume Share (%), by Type 2025 & 2033
- Figure 23: North America Bleaching Clay Market Revenue (billion), by Application 2025 & 2033
- Figure 24: North America Bleaching Clay Market Volume (K Tons), by Application 2025 & 2033
- Figure 25: North America Bleaching Clay Market Revenue Share (%), by Application 2025 & 2033
- Figure 26: North America Bleaching Clay Market Volume Share (%), by Application 2025 & 2033
- Figure 27: North America Bleaching Clay Market Revenue (billion), by End-user Industry 2025 & 2033
- Figure 28: North America Bleaching Clay Market Volume (K Tons), by End-user Industry 2025 & 2033
- Figure 29: North America Bleaching Clay Market Revenue Share (%), by End-user Industry 2025 & 2033
- Figure 30: North America Bleaching Clay Market Volume Share (%), by End-user Industry 2025 & 2033
- Figure 31: North America Bleaching Clay Market Revenue (billion), by Country 2025 & 2033
- Figure 32: North America Bleaching Clay Market Volume (K Tons), by Country 2025 & 2033
- Figure 33: North America Bleaching Clay Market Revenue Share (%), by Country 2025 & 2033
- Figure 34: North America Bleaching Clay Market Volume Share (%), by Country 2025 & 2033
- Figure 35: Europe Bleaching Clay Market Revenue (billion), by Type 2025 & 2033
- Figure 36: Europe Bleaching Clay Market Volume (K Tons), by Type 2025 & 2033
- Figure 37: Europe Bleaching Clay Market Revenue Share (%), by Type 2025 & 2033
- Figure 38: Europe Bleaching Clay Market Volume Share (%), by Type 2025 & 2033
- Figure 39: Europe Bleaching Clay Market Revenue (billion), by Application 2025 & 2033
- Figure 40: Europe Bleaching Clay Market Volume (K Tons), by Application 2025 & 2033
- Figure 41: Europe Bleaching Clay Market Revenue Share (%), by Application 2025 & 2033
- Figure 42: Europe Bleaching Clay Market Volume Share (%), by Application 2025 & 2033
- Figure 43: Europe Bleaching Clay Market Revenue (billion), by End-user Industry 2025 & 2033
- Figure 44: Europe Bleaching Clay Market Volume (K Tons), by End-user Industry 2025 & 2033
- Figure 45: Europe Bleaching Clay Market Revenue Share (%), by End-user Industry 2025 & 2033
- Figure 46: Europe Bleaching Clay Market Volume Share (%), by End-user Industry 2025 & 2033
- Figure 47: Europe Bleaching Clay Market Revenue (billion), by Country 2025 & 2033
- Figure 48: Europe Bleaching Clay Market Volume (K Tons), by Country 2025 & 2033
- Figure 49: Europe Bleaching Clay Market Revenue Share (%), by Country 2025 & 2033
- Figure 50: Europe Bleaching Clay Market Volume Share (%), by Country 2025 & 2033
- Figure 51: South America Bleaching Clay Market Revenue (billion), by Type 2025 & 2033
- Figure 52: South America Bleaching Clay Market Volume (K Tons), by Type 2025 & 2033
- Figure 53: South America Bleaching Clay Market Revenue Share (%), by Type 2025 & 2033
- Figure 54: South America Bleaching Clay Market Volume Share (%), by Type 2025 & 2033
- Figure 55: South America Bleaching Clay Market Revenue (billion), by Application 2025 & 2033
- Figure 56: South America Bleaching Clay Market Volume (K Tons), by Application 2025 & 2033
- Figure 57: South America Bleaching Clay Market Revenue Share (%), by Application 2025 & 2033
- Figure 58: South America Bleaching Clay Market Volume Share (%), by Application 2025 & 2033
- Figure 59: South America Bleaching Clay Market Revenue (billion), by End-user Industry 2025 & 2033
- Figure 60: South America Bleaching Clay Market Volume (K Tons), by End-user Industry 2025 & 2033
- Figure 61: South America Bleaching Clay Market Revenue Share (%), by End-user Industry 2025 & 2033
- Figure 62: South America Bleaching Clay Market Volume Share (%), by End-user Industry 2025 & 2033
- Figure 63: South America Bleaching Clay Market Revenue (billion), by Country 2025 & 2033
- Figure 64: South America Bleaching Clay Market Volume (K Tons), by Country 2025 & 2033
- Figure 65: South America Bleaching Clay Market Revenue Share (%), by Country 2025 & 2033
- Figure 66: South America Bleaching Clay Market Volume Share (%), by Country 2025 & 2033
- Figure 67: Middle East and Africa Bleaching Clay Market Revenue (billion), by Type 2025 & 2033
- Figure 68: Middle East and Africa Bleaching Clay Market Volume (K Tons), by Type 2025 & 2033
- Figure 69: Middle East and Africa Bleaching Clay Market Revenue Share (%), by Type 2025 & 2033
- Figure 70: Middle East and Africa Bleaching Clay Market Volume Share (%), by Type 2025 & 2033
- Figure 71: Middle East and Africa Bleaching Clay Market Revenue (billion), by Application 2025 & 2033
- Figure 72: Middle East and Africa Bleaching Clay Market Volume (K Tons), by Application 2025 & 2033
- Figure 73: Middle East and Africa Bleaching Clay Market Revenue Share (%), by Application 2025 & 2033
- Figure 74: Middle East and Africa Bleaching Clay Market Volume Share (%), by Application 2025 & 2033
- Figure 75: Middle East and Africa Bleaching Clay Market Revenue (billion), by End-user Industry 2025 & 2033
- Figure 76: Middle East and Africa Bleaching Clay Market Volume (K Tons), by End-user Industry 2025 & 2033
- Figure 77: Middle East and Africa Bleaching Clay Market Revenue Share (%), by End-user Industry 2025 & 2033
- Figure 78: Middle East and Africa Bleaching Clay Market Volume Share (%), by End-user Industry 2025 & 2033
- Figure 79: Middle East and Africa Bleaching Clay Market Revenue (billion), by Country 2025 & 2033
- Figure 80: Middle East and Africa Bleaching Clay Market Volume (K Tons), by Country 2025 & 2033
- Figure 81: Middle East and Africa Bleaching Clay Market Revenue Share (%), by Country 2025 & 2033
- Figure 82: Middle East and Africa Bleaching Clay Market Volume Share (%), by Country 2025 & 2033
List of Tables
- Table 1: Global Bleaching Clay Market Revenue billion Forecast, by Type 2020 & 2033
- Table 2: Global Bleaching Clay Market Volume K Tons Forecast, by Type 2020 & 2033
- Table 3: Global Bleaching Clay Market Revenue billion Forecast, by Application 2020 & 2033
- Table 4: Global Bleaching Clay Market Volume K Tons Forecast, by Application 2020 & 2033
- Table 5: Global Bleaching Clay Market Revenue billion Forecast, by End-user Industry 2020 & 2033
- Table 6: Global Bleaching Clay Market Volume K Tons Forecast, by End-user Industry 2020 & 2033
- Table 7: Global Bleaching Clay Market Revenue billion Forecast, by Region 2020 & 2033
- Table 8: Global Bleaching Clay Market Volume K Tons Forecast, by Region 2020 & 2033
- Table 9: Global Bleaching Clay Market Revenue billion Forecast, by Type 2020 & 2033
- Table 10: Global Bleaching Clay Market Volume K Tons Forecast, by Type 2020 & 2033
- Table 11: Global Bleaching Clay Market Revenue billion Forecast, by Application 2020 & 2033
- Table 12: Global Bleaching Clay Market Volume K Tons Forecast, by Application 2020 & 2033
- Table 13: Global Bleaching Clay Market Revenue billion Forecast, by End-user Industry 2020 & 2033
- Table 14: Global Bleaching Clay Market Volume K Tons Forecast, by End-user Industry 2020 & 2033
- Table 15: Global Bleaching Clay Market Revenue billion Forecast, by Country 2020 & 2033
- Table 16: Global Bleaching Clay Market Volume K Tons Forecast, by Country 2020 & 2033
- Table 17: China Bleaching Clay Market Revenue (billion) Forecast, by Application 2020 & 2033
- Table 18: China Bleaching Clay Market Volume (K Tons) Forecast, by Application 2020 & 2033
- Table 19: India Bleaching Clay Market Revenue (billion) Forecast, by Application 2020 & 2033
- Table 20: India Bleaching Clay Market Volume (K Tons) Forecast, by Application 2020 & 2033
- Table 21: Japan Bleaching Clay Market Revenue (billion) Forecast, by Application 2020 & 2033
- Table 22: Japan Bleaching Clay Market Volume (K Tons) Forecast, by Application 2020 & 2033
- Table 23: South Korea Bleaching Clay Market Revenue (billion) Forecast, by Application 2020 & 2033
- Table 24: South Korea Bleaching Clay Market Volume (K Tons) Forecast, by Application 2020 & 2033
- Table 25: Rest of Asia Pacific Bleaching Clay Market Revenue (billion) Forecast, by Application 2020 & 2033
- Table 26: Rest of Asia Pacific Bleaching Clay Market Volume (K Tons) Forecast, by Application 2020 & 2033
- Table 27: Global Bleaching Clay Market Revenue billion Forecast, by Type 2020 & 2033
- Table 28: Global Bleaching Clay Market Volume K Tons Forecast, by Type 2020 & 2033
- Table 29: Global Bleaching Clay Market Revenue billion Forecast, by Application 2020 & 2033
- Table 30: Global Bleaching Clay Market Volume K Tons Forecast, by Application 2020 & 2033
- Table 31: Global Bleaching Clay Market Revenue billion Forecast, by End-user Industry 2020 & 2033
- Table 32: Global Bleaching Clay Market Volume K Tons Forecast, by End-user Industry 2020 & 2033
- Table 33: Global Bleaching Clay Market Revenue billion Forecast, by Country 2020 & 2033
- Table 34: Global Bleaching Clay Market Volume K Tons Forecast, by Country 2020 & 2033
- Table 35: United States Bleaching Clay Market Revenue (billion) Forecast, by Application 2020 & 2033
- Table 36: United States Bleaching Clay Market Volume (K Tons) Forecast, by Application 2020 & 2033
- Table 37: Canada Bleaching Clay Market Revenue (billion) Forecast, by Application 2020 & 2033
- Table 38: Canada Bleaching Clay Market Volume (K Tons) Forecast, by Application 2020 & 2033
- Table 39: Mexico Bleaching Clay Market Revenue (billion) Forecast, by Application 2020 & 2033
- Table 40: Mexico Bleaching Clay Market Volume (K Tons) Forecast, by Application 2020 & 2033
- Table 41: Global Bleaching Clay Market Revenue billion Forecast, by Type 2020 & 2033
- Table 42: Global Bleaching Clay Market Volume K Tons Forecast, by Type 2020 & 2033
- Table 43: Global Bleaching Clay Market Revenue billion Forecast, by Application 2020 & 2033
- Table 44: Global Bleaching Clay Market Volume K Tons Forecast, by Application 2020 & 2033
- Table 45: Global Bleaching Clay Market Revenue billion Forecast, by End-user Industry 2020 & 2033
- Table 46: Global Bleaching Clay Market Volume K Tons Forecast, by End-user Industry 2020 & 2033
- Table 47: Global Bleaching Clay Market Revenue billion Forecast, by Country 2020 & 2033
- Table 48: Global Bleaching Clay Market Volume K Tons Forecast, by Country 2020 & 2033
- Table 49: Germany Bleaching Clay Market Revenue (billion) Forecast, by Application 2020 & 2033
- Table 50: Germany Bleaching Clay Market Volume (K Tons) Forecast, by Application 2020 & 2033
- Table 51: United Kingdom Bleaching Clay Market Revenue (billion) Forecast, by Application 2020 & 2033
- Table 52: United Kingdom Bleaching Clay Market Volume (K Tons) Forecast, by Application 2020 & 2033
- Table 53: Italy Bleaching Clay Market Revenue (billion) Forecast, by Application 2020 & 2033
- Table 54: Italy Bleaching Clay Market Volume (K Tons) Forecast, by Application 2020 & 2033
- Table 55: France Bleaching Clay Market Revenue (billion) Forecast, by Application 2020 & 2033
- Table 56: France Bleaching Clay Market Volume (K Tons) Forecast, by Application 2020 & 2033
- Table 57: Rest of Europe Bleaching Clay Market Revenue (billion) Forecast, by Application 2020 & 2033
- Table 58: Rest of Europe Bleaching Clay Market Volume (K Tons) Forecast, by Application 2020 & 2033
- Table 59: Global Bleaching Clay Market Revenue billion Forecast, by Type 2020 & 2033
- Table 60: Global Bleaching Clay Market Volume K Tons Forecast, by Type 2020 & 2033
- Table 61: Global Bleaching Clay Market Revenue billion Forecast, by Application 2020 & 2033
- Table 62: Global Bleaching Clay Market Volume K Tons Forecast, by Application 2020 & 2033
- Table 63: Global Bleaching Clay Market Revenue billion Forecast, by End-user Industry 2020 & 2033
- Table 64: Global Bleaching Clay Market Volume K Tons Forecast, by End-user Industry 2020 & 2033
- Table 65: Global Bleaching Clay Market Revenue billion Forecast, by Country 2020 & 2033
- Table 66: Global Bleaching Clay Market Volume K Tons Forecast, by Country 2020 & 2033
- Table 67: Brazil Bleaching Clay Market Revenue (billion) Forecast, by Application 2020 & 2033
- Table 68: Brazil Bleaching Clay Market Volume (K Tons) Forecast, by Application 2020 & 2033
- Table 69: Argentina Bleaching Clay Market Revenue (billion) Forecast, by Application 2020 & 2033
- Table 70: Argentina Bleaching Clay Market Volume (K Tons) Forecast, by Application 2020 & 2033
- Table 71: Rest of South America Bleaching Clay Market Revenue (billion) Forecast, by Application 2020 & 2033
- Table 72: Rest of South America Bleaching Clay Market Volume (K Tons) Forecast, by Application 2020 & 2033
- Table 73: Global Bleaching Clay Market Revenue billion Forecast, by Type 2020 & 2033
- Table 74: Global Bleaching Clay Market Volume K Tons Forecast, by Type 2020 & 2033
- Table 75: Global Bleaching Clay Market Revenue billion Forecast, by Application 2020 & 2033
- Table 76: Global Bleaching Clay Market Volume K Tons Forecast, by Application 2020 & 2033
- Table 77: Global Bleaching Clay Market Revenue billion Forecast, by End-user Industry 2020 & 2033
- Table 78: Global Bleaching Clay Market Volume K Tons Forecast, by End-user Industry 2020 & 2033
- Table 79: Global Bleaching Clay Market Revenue billion Forecast, by Country 2020 & 2033
- Table 80: Global Bleaching Clay Market Volume K Tons Forecast, by Country 2020 & 2033
- Table 81: Saudi Arabia Bleaching Clay Market Revenue (billion) Forecast, by Application 2020 & 2033
- Table 82: Saudi Arabia Bleaching Clay Market Volume (K Tons) Forecast, by Application 2020 & 2033
- Table 83: South Africa Bleaching Clay Market Revenue (billion) Forecast, by Application 2020 & 2033
- Table 84: South Africa Bleaching Clay Market Volume (K Tons) Forecast, by Application 2020 & 2033
- Table 85: Rest of Middle East and Africa Bleaching Clay Market Revenue (billion) Forecast, by Application 2020 & 2033
- Table 86: Rest of Middle East and Africa Bleaching Clay Market Volume (K Tons) Forecast, by Application 2020 & 2033
Frequently Asked Questions
1. What is the projected Compound Annual Growth Rate (CAGR) of the Bleaching Clay Market?
The projected CAGR is approximately 5.5%.
2. Which companies are prominent players in the Bleaching Clay Market?
Key companies in the market include Mineral Technologies Inc, Musim Mas, Clariant, Refoil Earth Pvt Ltd, The W Clay Industries Sdn Bhd, HRP Industries, Ashapura Group, Oil-Dri Corporation of America, EP Minerals, Taiko Clay Marketing Sdn Bhd.
3. What are the main segments of the Bleaching Clay Market?
The market segments include Type, Application, End-user Industry.
4. Can you provide details about the market size?
The market size is estimated to be USD 1.7 billion as of 2022.
5. What are some drivers contributing to market growth?
; Growing Demand for Refined Vegetable Oil; Increasing Demand from the Cosmetics and Personal Care Market.
6. What are the notable trends driving market growth?
Increasing Demand from the Food and Beverage Industry.
7. Are there any restraints impacting market growth?
; Stringent Safety Legislations; Negative Impact of the COVID-19 Pandemic.
8. Can you provide examples of recent developments in the market?
N/A
9. What pricing options are available for accessing the report?
Pricing options include single-user, multi-user, and enterprise licenses priced at USD 4750, USD 5250, and USD 8750 respectively.
10. Is the market size provided in terms of value or volume?
The market size is provided in terms of value, measured in billion and volume, measured in K Tons.
11. Are there any specific market keywords associated with the report?
Yes, the market keyword associated with the report is "Bleaching Clay Market," which aids in identifying and referencing the specific market segment covered.
12. How do I determine which pricing option suits my needs best?
The pricing options vary based on user requirements and access needs. Individual users may opt for single-user licenses, while businesses requiring broader access may choose multi-user or enterprise licenses for cost-effective access to the report.
13. Are there any additional resources or data provided in the Bleaching Clay Market report?
While the report offers comprehensive insights, it's advisable to review the specific contents or supplementary materials provided to ascertain if additional resources or data are available.
14. How can I stay updated on further developments or reports in the Bleaching Clay Market?
To stay informed about further developments, trends, and reports in the Bleaching Clay Market, consider subscribing to industry newsletters, following relevant companies and organizations, or regularly checking reputable industry news sources and publications.
Methodology
Step 1 - Identification of Relevant Samples Size from Population Database


Step 2 - Approaches for Defining Global Market Size (Value, Volume* & Price*)

Note*: In applicable scenarios
Step 3 - Data Sources
Primary Research
- Web Analytics
- Survey Reports
- Research Institute
- Latest Research Reports
- Opinion Leaders
Secondary Research
- Annual Reports
- White Paper
- Latest Press Release
- Industry Association
- Paid Database
- Investor Presentations

Step 4 - Data Triangulation
Involves using different sources of information in order to increase the validity of a study
These sources are likely to be stakeholders in a program - participants, other researchers, program staff, other community members, and so on.
Then we put all data in single framework & apply various statistical tools to find out the dynamic on the market.
During the analysis stage, feedback from the stakeholder groups would be compared to determine areas of agreement as well as areas of divergence