

Key Insights
The global Synthetic Diamond Market is projected for significant expansion, propelled by escalating demand across various sectors and advancements in production technologies. The market size is estimated at USD 42.74 billion in the base year 2025, with an anticipated Compound Annual Growth Rate (CAGR) of 2.7% from 2025 to 2033. Key growth drivers include the increasing integration of synthetic diamonds in electronics for superior thermal management and semiconductor applications, the rising popularity of lab-grown gemstones in jewelry, and their emerging use in specialized medical tools. Innovations in efficient and cost-effective manufacturing methods like High Pressure, High Temperature (HPHT) and Chemical Vapor Deposition (CVD) are enhancing scalability and quality, further supporting market growth.
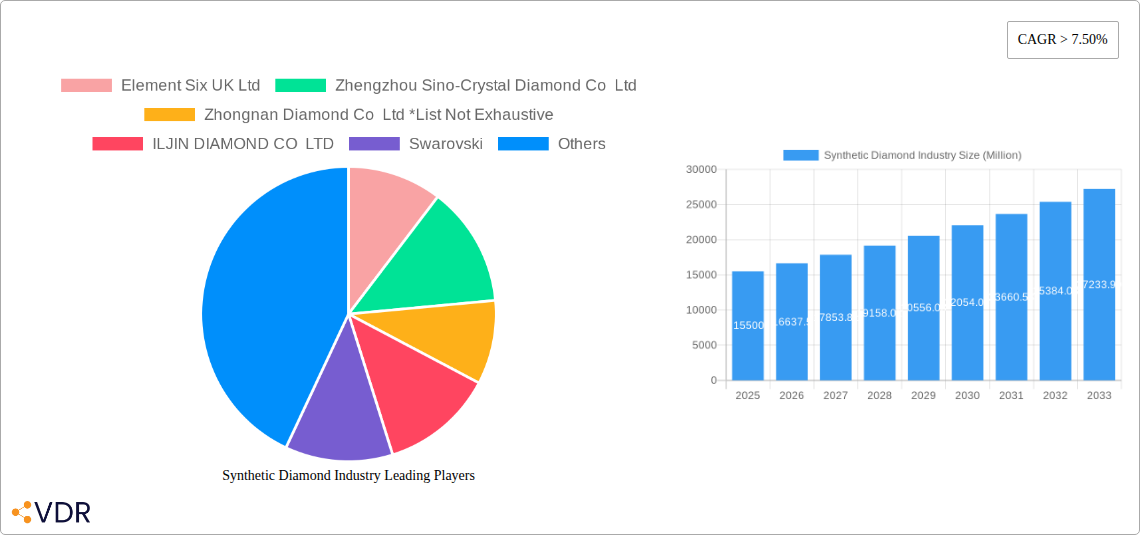
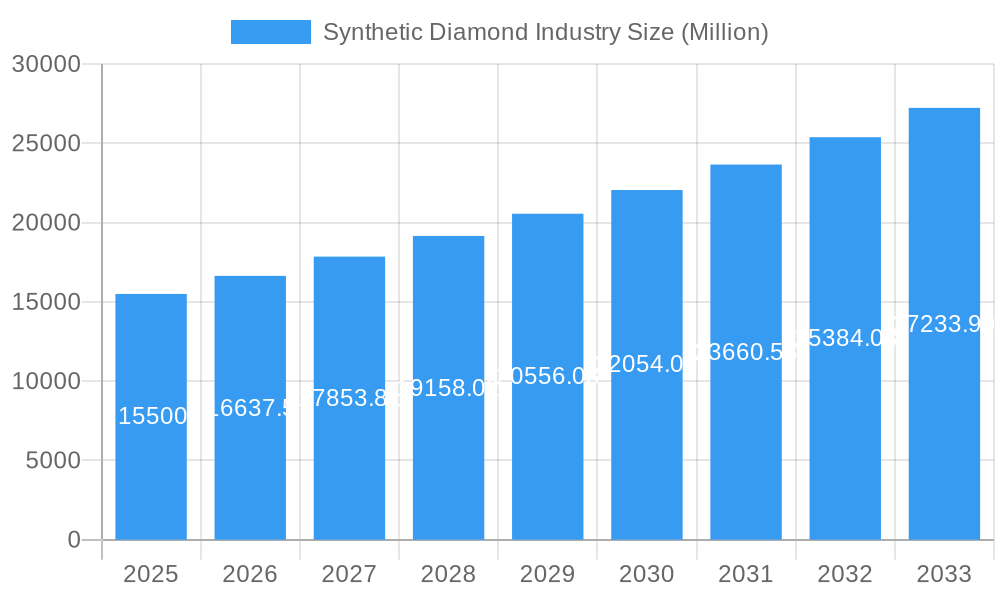
Synthetic Diamond Industry Market Size (In Billion)
The market is segmented by product type, including polished and rough synthetic diamonds. Polished synthetic diamonds serve jewelry, electronics, healthcare, and other specialized applications, while rough synthetic diamonds are utilized in construction, mining, oil and gas, and industrial sectors. The electronics and healthcare segments show notable growth, indicating a trend towards high-performance material adoption. Geographically, the Asia Pacific region, particularly China and India, is expected to lead due to robust manufacturing capabilities and increasing domestic demand. North America and Europe are also significant markets, driven by consumer preference for ethical and affordable gemstones, alongside advanced industrial applications. Potential restraints include production costs for premium synthetic diamonds and consumer perception regarding their value relative to natural diamonds. Despite these factors, the synthetic diamond market outlook is highly promising, signaling a transformative phase for the industry.
Synthetic Diamond Industry Company Market Share
This report offers an in-depth analysis of the global synthetic diamond market, forecasting growth from 2025 to 2033. It examines market dynamics, growth trends, regional leadership, product segmentation, key drivers, challenges, and emerging opportunities. The analysis utilizes relevant keywords to enhance search engine visibility for industry professionals seeking actionable insights. The report provides a detailed examination of market segments and value chains, with all quantitative data presented in billions of units.
Synthetic Diamond Industry Market Dynamics & Structure
The synthetic diamond industry is characterized by a moderate to high market concentration, with key players dominating specific manufacturing processes and application segments. Technological innovation remains the primary driver, fueled by advancements in Chemical Vapor Deposition (CVD) and High Pressure, High Temperature (HPHT) synthesis techniques. These innovations enable the production of diamonds with superior quality and customized properties, expanding their utility beyond traditional jewelry. Regulatory frameworks are evolving, with increasing scrutiny on ethical sourcing and environmental impact, influencing production methods and market access. Competitive product substitutes, including natural diamonds and other advanced materials, pose a constant challenge, necessitating continuous product differentiation and cost optimization. End-user demographics are diversifying, with a growing demand from the electronics, healthcare, and industrial sectors, alongside the established jewelry market. Merger and acquisition (M&A) trends indicate strategic consolidation, with companies aiming to secure intellectual property, expand production capacity, and gain market share. The parent market for synthetic diamonds encompasses the broad applications of diamond materials, while child markets segment into specific end-use industries like electronics, healthcare, and industrial abrasives, each with unique growth trajectories.
- Market Concentration: Dominated by a few key manufacturers in HPHT and CVD technologies, but with increasing fragmentation in niche applications.
- Technological Innovation: Focus on improving crystal quality, reducing production costs, and developing novel applications.
- Regulatory Landscape: Emerging standards for traceability, sustainability, and ethical production impacting global trade.
- Competitive Landscape: Ongoing competition from natural diamonds, albeit with a widening price gap and distinct value propositions.
- End-User Diversification: Significant growth anticipated from high-tech industries requiring specialized diamond properties.
- M&A Activity: Strategic acquisitions aimed at vertical integration and IP acquisition are likely to continue.
Synthetic Diamond Industry Growth Trends & Insights
The global synthetic diamond industry is poised for substantial growth, driven by escalating demand across diverse applications and continuous technological advancements. The market size evolution indicates a consistent upward trajectory, with adoption rates accelerating as the benefits of synthetic diamonds—including cost-effectiveness, ethical sourcing, and customizable properties—become more widely recognized. Technological disruptions are playing a pivotal role, with innovations in both CVD and HPHT processes leading to higher quality, larger-sized, and more defect-free synthetic diamonds. These advancements are not only making synthetic diamonds more accessible for jewelry but also unlocking new frontiers in electronics, quantum computing, and advanced medical devices. Consumer behavior shifts are also contributing to this growth; a younger generation of consumers is increasingly open to lab-grown diamonds, valuing transparency and sustainability. Furthermore, the industrial applications of synthetic diamonds are expanding exponentially. In the electronics sector, synthetic diamonds are being integrated into high-performance components, heat sinks, and substrates due to their exceptional thermal conductivity and dielectric properties. The healthcare industry is exploring their use in surgical tools, biosensors, and advanced imaging. The mining and construction sectors continue to be significant consumers of rough synthetic diamonds for abrasives and cutting tools, driven by their superior hardness and durability. The forecast period (2025–2033) anticipates a compound annual growth rate (CAGR) that reflects the increasing penetration of synthetic diamonds in both traditional and emerging markets. Market penetration for synthetic diamonds in the jewelry sector, while historically lower than natural diamonds, is rapidly closing the gap, fueled by aggressive marketing and a growing acceptance of their value proposition. The development of larger and more pristine synthetic diamonds is further pushing the boundaries of what is possible in scientific research and industrial applications, creating a virtuous cycle of innovation and demand. The parent market is projected to experience a robust CAGR of approximately 8.5%, with the child market for industrial applications exhibiting an even higher growth rate, estimated at 9.2%, due to burgeoning demand in electronics and advanced manufacturing.
Dominant Regions, Countries, or Segments in Synthetic Diamond Industry
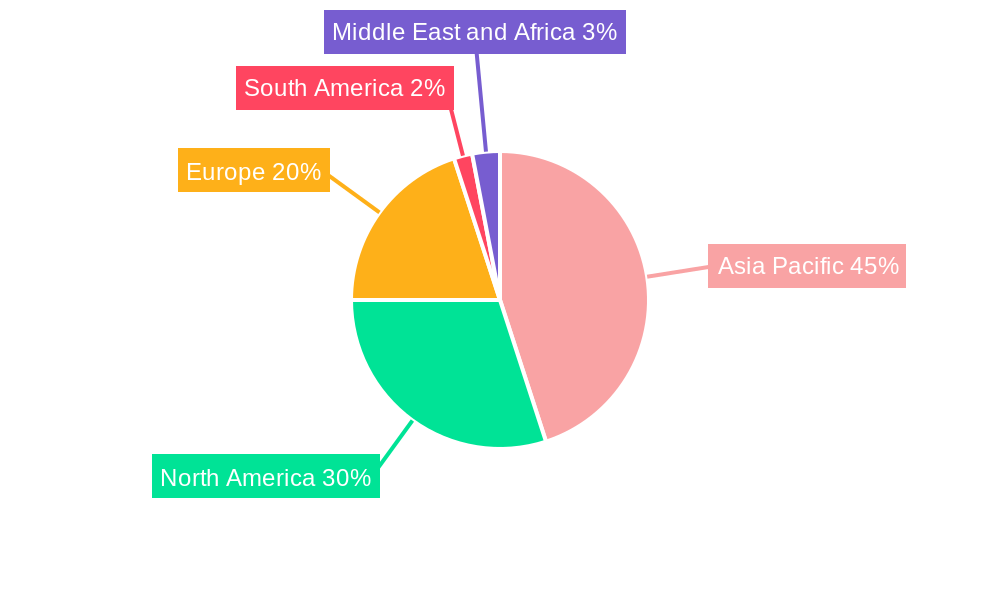
The synthetic diamond industry's dominance is shaped by a confluence of factors, including robust manufacturing capabilities, supportive governmental policies, and significant end-user demand. Asia Pacific, particularly China, has emerged as a leading region, driven by its extensive manufacturing infrastructure for both HPHT and CVD synthetic diamonds and a burgeoning domestic market for industrial applications. The region's ability to produce synthetic diamonds at competitive price points has solidified its position as a global supply hub. Within Asia Pacific, China's dominance is further amplified by its strong presence in the rough synthetic diamond segment, catering to the needs of the construction and mining industries for abrasives and cutting tools. The parent market for rough diamonds, valued at approximately $4,200 million in 2025, sees significant contribution from this region.
The polished synthetic diamond segment is also experiencing substantial growth, with increasing production of high-quality gems for the jewelry market. While the United States and European countries are significant consumers of polished synthetic diamonds, especially in the jewelry and electronics sectors, Asia Pacific remains the primary manufacturing powerhouse. The child market for polished diamonds in jewelry is projected to reach $5,800 million by 2025, with Asia Pacific holding a substantial share in production.
Manufacturing process-wise, both HPHT and CVD technologies are crucial, with specific regions showing strength in each. China and India are major players in HPHT production, benefiting from economies of scale. In contrast, North America and Europe are increasingly investing in advanced CVD technologies, focusing on high-purity, single-crystal diamonds for specialized applications like quantum computing and advanced electronics. The CVD segment, representing a significant child market, is anticipated to grow at a CAGR of 9.5% during the forecast period, driven by its suitability for producing diamonds with tailored electronic and optical properties.
- Regional Dominance: Asia Pacific leads in overall production volume, particularly in rough synthetic diamonds for industrial use.
- Country-Specific Strengths: China leads in HPHT manufacturing; North America and Europe are at the forefront of advanced CVD technology.
- Segment Growth Drivers:
- Polished (Jewelry): Driven by consumer acceptance, ethical concerns, and competitive pricing. Estimated market size of $3,100 million in 2025.
- Polished (Electronics): Fueled by demand for advanced semiconductors, heat sinks, and optical components. Estimated market size of $1,800 million in 2025.
- Rough (Construction & Mining): Continues to be a stable market due to demand for durable abrasives. Estimated market size of $2,500 million in 2025.
- Manufacturing Process (CVD): Experiencing rapid growth due to its precision and ability to create high-value diamonds for tech applications.
Synthetic Diamond Industry Product Landscape
The synthetic diamond product landscape is defined by continuous innovation, leading to a diverse range of applications and performance metrics. Manufacturers are increasingly focusing on producing synthetic diamonds with ultra-high purity, precise crystallographic orientation, and engineered defect structures. This allows for the creation of specialized diamonds for cutting-edge technologies. Product innovations include single-crystal diamonds with exceptional thermal conductivity, vital for advanced cooling solutions in electronics, and diamonds with unique optical properties for quantum information processing. Unique selling propositions revolve around achieving specific material characteristics that are either impossible or prohibitively expensive to obtain with natural diamonds. For instance, diamonds synthesized via CVD can be tailored with specific dopants to create semiconductor-grade materials, enabling smaller, faster, and more energy-efficient electronic devices. The performance metrics being pushed include thermal conductivity exceeding 2,000 W/mK, refractive index stability under extreme conditions, and unprecedented hardness for industrial tooling.
Key Drivers, Barriers & Challenges in Synthetic Diamond Industry
Key Drivers:
The synthetic diamond industry is propelled by several powerful forces. Technological advancements in both HPHT and CVD synthesis methods are continuously improving diamond quality, reducing production costs, and enabling new applications. The growing demand for ethically sourced and sustainable materials, particularly in the jewelry sector, is a significant driver. Furthermore, the increasing adoption of synthetic diamonds in high-growth industries such as electronics, telecommunications, and healthcare, owing to their superior thermal, optical, and mechanical properties, is creating new market avenues. Government initiatives promoting advanced materials research and development also play a crucial role in fostering innovation and market expansion.
Barriers & Challenges:
Despite its strong growth, the industry faces several hurdles. High initial capital investment for advanced manufacturing equipment can be a significant barrier to entry for new players. Public perception and awareness regarding the quality and value of synthetic diamonds, especially in comparison to natural diamonds, can also be a challenge, though this is rapidly improving. Supply chain complexities, particularly for specialized raw materials and equipment, can lead to production bottlenecks. Regulatory compliance regarding production standards and international trade can also present challenges. Lastly, the competitive pressure from established natural diamond markets and the ongoing development of alternative advanced materials require continuous innovation and price optimization. Supply chain disruptions, estimated to impact production by approximately 5-7% in the short term, and the need for stringent quality control for high-value applications are key concerns.
Emerging Opportunities in Synthetic Diamond Industry
Emerging opportunities within the synthetic diamond industry are vast and multifaceted. The burgeoning field of quantum technology presents a significant avenue, with synthetic diamonds being crucial for quantum computing, sensing, and cryptography due to their unique quantum properties. The development of advanced medical devices, including novel surgical tools and highly sensitive biosensors, offers another lucrative area. Furthermore, the increasing focus on sustainable energy solutions is creating demand for synthetic diamonds in high-efficiency solar cells and advanced battery components. Untapped markets in aerospace and defense, requiring materials with extreme durability and performance under harsh conditions, also represent a promising frontier. Evolving consumer preferences for personalized and traceable luxury goods are also opening up new avenues for customized synthetic diamond jewelry.
Growth Accelerators in the Synthetic Diamond Industry Industry
The long-term growth of the synthetic diamond industry is being significantly accelerated by several key factors. Breakthroughs in diamond synthesis technology, such as achieving larger crystal sizes with fewer defects and reduced production times, are directly translating into increased output and lower costs. Strategic partnerships between research institutions and industry leaders, like the collaboration between Element Six UK Ltd and the University of Warwick, are fostering rapid development of next-generation diamond-enabled technologies. Market expansion strategies, including targeted marketing campaigns in emerging economies and the penetration into new industrial sectors, are broadening the customer base. Furthermore, the increasing integration of synthetic diamonds into advanced manufacturing processes, such as in semiconductor fabrication and laser technologies, creates a sustained demand driven by innovation cycles in these high-tech industries.
Key Players Shaping the Synthetic Diamond Industry Market
- Element Six UK Ltd
- Zhengzhou Sino-Crystal Diamond Co Ltd
- Zhongnan Diamond Co Ltd
- ILJIN DIAMOND CO LTD
- Swarovski
- New Diamond Technology
- Pure Grown Diamonds (PGD)
- Applied Diamond Inc
- Henan Huanghe Whirlwind Co Ltd
- Sumitomo Electric Industries Ltd
- Adamas One Corp
Notable Milestones in Synthetic Diamond Industry Sector
- February 2022: Element Six UK Ltd collaborated with II-VI Inc., licensing intellectual property and equipment for high-quality single-crystal diamond production to expand core competencies in diamond technology.
- July 2021: Element Six UK LTD partnered with the University of Warwick to develop next-generation synthetic diamond-enabled technologies, leveraging Element Six's advanced material solutions expertise.
In-Depth Synthetic Diamond Industry Market Outlook
The outlook for the synthetic diamond industry is exceptionally robust, driven by sustained technological innovation and expanding applications. Growth accelerators, including advancements in CVD and HPHT synthesis, the increasing demand for ethically sourced materials, and the critical role of diamonds in emerging technologies like quantum computing and advanced electronics, are collectively shaping a highly optimistic future. Strategic partnerships and market expansion efforts are further solidifying the industry's trajectory. The market is poised for significant value creation as synthetic diamonds move beyond their traditional roles to become indispensable components in high-growth sectors, representing a substantial future market potential and offering compelling strategic opportunities for stakeholders. The overall market is projected to reach approximately $15,000 million by 2033.
Synthetic Diamond Industry Segmentation
-
1. Type
-
1.1. Polished
- 1.1.1. Jewelry
- 1.1.2. Electronics
- 1.1.3. Healthcare
- 1.1.4. Other Polished Types
-
1.2. Rough
- 1.2.1. Construction
- 1.2.2. Mining
- 1.2.3. Oil and Gas
- 1.2.4. Other Rough Types
-
1.1. Polished
-
2. Manufacturing Process
- 2.1. High Pressure, High Temperature (HPHT)
- 2.2. Chemical Vapor Deposition (CVD)
Synthetic Diamond Industry Segmentation By Geography
-
1. Asia Pacific
- 1.1. China
- 1.2. India
- 1.3. Japan
- 1.4. ASEAN Countries
- 1.5. Rest of Asia Pacific
-
2. North America
- 2.1. United States
- 2.2. Rest of North America
-
3. Europe
- 3.1. Germany
- 3.2. France
- 3.3. United Kingdom
- 3.4. Italy
- 3.5. Spain
- 3.6. Rest of Europe
-
4. South America
- 4.1. Brazil
- 4.2. Rest of South America
-
5. Middle East and Africa
- 5.1. GCC Countries
- 5.2. South Africa
- 5.3. Rest of Middle East and Africa
Synthetic Diamond Industry Regional Market Share
Geographic Coverage of Synthetic Diamond Industry
Synthetic Diamond Industry REPORT HIGHLIGHTS
| Aspects | Details |
|---|---|
| Study Period | 2020-2034 |
| Base Year | 2025 |
| Estimated Year | 2026 |
| Forecast Period | 2026-2034 |
| Historical Period | 2020-2025 |
| Growth Rate | CAGR of 2.7% from 2020-2034 |
| Segmentation |
|
Table of Contents
- 1. Introduction
- 1.1. Research Scope
- 1.2. Market Segmentation
- 1.3. Research Objective
- 1.4. Definitions and Assumptions
- 2. Executive Summary
- 2.1. Market Snapshot
- 3. Market Dynamics
- 3.1. Market Drivers
- 3.2. Market Restrains
- 3.3. Market Trends
- 3.4. Market Opportunities
- 4. Market Factor Analysis
- 4.1. Porters Five Forces
- 4.1.1. Bargaining Power of Suppliers
- 4.1.2. Bargaining Power of Buyers
- 4.1.3. Threat of New Entrants
- 4.1.4. Threat of Substitutes
- 4.1.5. Competitive Rivalry
- 4.2. PESTEL analysis
- 4.3. BCG Analysis
- 4.3.1. Stars (High Growth, High Market Share)
- 4.3.2. Cash Cows (Low Growth, High Market Share)
- 4.3.3. Question Mark (High Growth, Low Market Share)
- 4.3.4. Dogs (Low Growth, Low Market Share)
- 4.4. Ansoff Matrix Analysis
- 4.5. Supply Chain Analysis
- 4.6. Regulatory Landscape
- 4.7. Current Market Potential and Opportunity Assessment (TAM–SAM–SOM Framework)
- 4.8. VDR Analyst Note
- 4.1. Porters Five Forces
- 5. Market Analysis, Insights and Forecast 2021-2033
- 5.1. Market Analysis, Insights and Forecast - by Type
- 5.1.1. Polished
- 5.1.1.1. Jewelry
- 5.1.1.2. Electronics
- 5.1.1.3. Healthcare
- 5.1.1.4. Other Polished Types
- 5.1.2. Rough
- 5.1.2.1. Construction
- 5.1.2.2. Mining
- 5.1.2.3. Oil and Gas
- 5.1.2.4. Other Rough Types
- 5.1.1. Polished
- 5.2. Market Analysis, Insights and Forecast - by Manufacturing Process
- 5.2.1. High Pressure, High Temperature (HPHT)
- 5.2.2. Chemical Vapor Deposition (CVD)
- 5.3. Market Analysis, Insights and Forecast - by Region
- 5.3.1. Asia Pacific
- 5.3.2. North America
- 5.3.3. Europe
- 5.3.4. South America
- 5.3.5. Middle East and Africa
- 5.1. Market Analysis, Insights and Forecast - by Type
- 6. Global Synthetic Diamond Industry Analysis, Insights and Forecast, 2021-2033
- 6.1. Market Analysis, Insights and Forecast - by Type
- 6.1.1. Polished
- 6.1.1.1. Jewelry
- 6.1.1.2. Electronics
- 6.1.1.3. Healthcare
- 6.1.1.4. Other Polished Types
- 6.1.2. Rough
- 6.1.2.1. Construction
- 6.1.2.2. Mining
- 6.1.2.3. Oil and Gas
- 6.1.2.4. Other Rough Types
- 6.1.1. Polished
- 6.2. Market Analysis, Insights and Forecast - by Manufacturing Process
- 6.2.1. High Pressure, High Temperature (HPHT)
- 6.2.2. Chemical Vapor Deposition (CVD)
- 6.1. Market Analysis, Insights and Forecast - by Type
- 7. Asia Pacific Synthetic Diamond Industry Analysis, Insights and Forecast, 2021-2033
- 7.1. Market Analysis, Insights and Forecast - by Type
- 7.1.1. Polished
- 7.1.1.1. Jewelry
- 7.1.1.2. Electronics
- 7.1.1.3. Healthcare
- 7.1.1.4. Other Polished Types
- 7.1.2. Rough
- 7.1.2.1. Construction
- 7.1.2.2. Mining
- 7.1.2.3. Oil and Gas
- 7.1.2.4. Other Rough Types
- 7.1.1. Polished
- 7.2. Market Analysis, Insights and Forecast - by Manufacturing Process
- 7.2.1. High Pressure, High Temperature (HPHT)
- 7.2.2. Chemical Vapor Deposition (CVD)
- 7.1. Market Analysis, Insights and Forecast - by Type
- 8. North America Synthetic Diamond Industry Analysis, Insights and Forecast, 2021-2033
- 8.1. Market Analysis, Insights and Forecast - by Type
- 8.1.1. Polished
- 8.1.1.1. Jewelry
- 8.1.1.2. Electronics
- 8.1.1.3. Healthcare
- 8.1.1.4. Other Polished Types
- 8.1.2. Rough
- 8.1.2.1. Construction
- 8.1.2.2. Mining
- 8.1.2.3. Oil and Gas
- 8.1.2.4. Other Rough Types
- 8.1.1. Polished
- 8.2. Market Analysis, Insights and Forecast - by Manufacturing Process
- 8.2.1. High Pressure, High Temperature (HPHT)
- 8.2.2. Chemical Vapor Deposition (CVD)
- 8.1. Market Analysis, Insights and Forecast - by Type
- 9. Europe Synthetic Diamond Industry Analysis, Insights and Forecast, 2021-2033
- 9.1. Market Analysis, Insights and Forecast - by Type
- 9.1.1. Polished
- 9.1.1.1. Jewelry
- 9.1.1.2. Electronics
- 9.1.1.3. Healthcare
- 9.1.1.4. Other Polished Types
- 9.1.2. Rough
- 9.1.2.1. Construction
- 9.1.2.2. Mining
- 9.1.2.3. Oil and Gas
- 9.1.2.4. Other Rough Types
- 9.1.1. Polished
- 9.2. Market Analysis, Insights and Forecast - by Manufacturing Process
- 9.2.1. High Pressure, High Temperature (HPHT)
- 9.2.2. Chemical Vapor Deposition (CVD)
- 9.1. Market Analysis, Insights and Forecast - by Type
- 10. South America Synthetic Diamond Industry Analysis, Insights and Forecast, 2021-2033
- 10.1. Market Analysis, Insights and Forecast - by Type
- 10.1.1. Polished
- 10.1.1.1. Jewelry
- 10.1.1.2. Electronics
- 10.1.1.3. Healthcare
- 10.1.1.4. Other Polished Types
- 10.1.2. Rough
- 10.1.2.1. Construction
- 10.1.2.2. Mining
- 10.1.2.3. Oil and Gas
- 10.1.2.4. Other Rough Types
- 10.1.1. Polished
- 10.2. Market Analysis, Insights and Forecast - by Manufacturing Process
- 10.2.1. High Pressure, High Temperature (HPHT)
- 10.2.2. Chemical Vapor Deposition (CVD)
- 10.1. Market Analysis, Insights and Forecast - by Type
- 11. Middle East and Africa Synthetic Diamond Industry Analysis, Insights and Forecast, 2021-2033
- 11.1. Market Analysis, Insights and Forecast - by Type
- 11.1.1. Polished
- 11.1.1.1. Jewelry
- 11.1.1.2. Electronics
- 11.1.1.3. Healthcare
- 11.1.1.4. Other Polished Types
- 11.1.2. Rough
- 11.1.2.1. Construction
- 11.1.2.2. Mining
- 11.1.2.3. Oil and Gas
- 11.1.2.4. Other Rough Types
- 11.1.1. Polished
- 11.2. Market Analysis, Insights and Forecast - by Manufacturing Process
- 11.2.1. High Pressure, High Temperature (HPHT)
- 11.2.2. Chemical Vapor Deposition (CVD)
- 11.1. Market Analysis, Insights and Forecast - by Type
- 12. Competitive Analysis
- 12.1. Company Profiles
- 12.1.1 Element Six UK Ltd
- 12.1.1.1. Company Overview
- 12.1.1.2. Products
- 12.1.1.3. Company Financials
- 12.1.1.4. SWOT Analysis
- 12.1.2 Zhengzhou Sino-Crystal Diamond Co Ltd
- 12.1.2.1. Company Overview
- 12.1.2.2. Products
- 12.1.2.3. Company Financials
- 12.1.2.4. SWOT Analysis
- 12.1.3 Zhongnan Diamond Co Ltd *List Not Exhaustive
- 12.1.3.1. Company Overview
- 12.1.3.2. Products
- 12.1.3.3. Company Financials
- 12.1.3.4. SWOT Analysis
- 12.1.4 ILJIN DIAMOND CO LTD
- 12.1.4.1. Company Overview
- 12.1.4.2. Products
- 12.1.4.3. Company Financials
- 12.1.4.4. SWOT Analysis
- 12.1.5 Swarovski
- 12.1.5.1. Company Overview
- 12.1.5.2. Products
- 12.1.5.3. Company Financials
- 12.1.5.4. SWOT Analysis
- 12.1.6 New Diamond Technology
- 12.1.6.1. Company Overview
- 12.1.6.2. Products
- 12.1.6.3. Company Financials
- 12.1.6.4. SWOT Analysis
- 12.1.7 Pure Grown Diamonds (PGD)
- 12.1.7.1. Company Overview
- 12.1.7.2. Products
- 12.1.7.3. Company Financials
- 12.1.7.4. SWOT Analysis
- 12.1.8 Applied Diamond Inc
- 12.1.8.1. Company Overview
- 12.1.8.2. Products
- 12.1.8.3. Company Financials
- 12.1.8.4. SWOT Analysis
- 12.1.9 Henan Huanghe Whirlwind Co Ltd
- 12.1.9.1. Company Overview
- 12.1.9.2. Products
- 12.1.9.3. Company Financials
- 12.1.9.4. SWOT Analysis
- 12.1.10 Sumitomo Electric Industries Ltd
- 12.1.10.1. Company Overview
- 12.1.10.2. Products
- 12.1.10.3. Company Financials
- 12.1.10.4. SWOT Analysis
- 12.1.11 Adamas One Corp
- 12.1.11.1. Company Overview
- 12.1.11.2. Products
- 12.1.11.3. Company Financials
- 12.1.11.4. SWOT Analysis
- 12.1.1 Element Six UK Ltd
- 12.2. Market Entropy
- 12.2.1 Company's Key Areas Served
- 12.2.2 Recent Developments
- 12.3. Company Market Share Analysis 2025
- 12.3.1 Top 5 Companies Market Share Analysis
- 12.3.2 Top 3 Companies Market Share Analysis
- 12.4. List of Potential Customers
- 13. Research Methodology
List of Figures
- Figure 1: Global Synthetic Diamond Industry Revenue Breakdown (billion, %) by Region 2025 & 2033
- Figure 2: Asia Pacific Synthetic Diamond Industry Revenue (billion), by Type 2025 & 2033
- Figure 3: Asia Pacific Synthetic Diamond Industry Revenue Share (%), by Type 2025 & 2033
- Figure 4: Asia Pacific Synthetic Diamond Industry Revenue (billion), by Manufacturing Process 2025 & 2033
- Figure 5: Asia Pacific Synthetic Diamond Industry Revenue Share (%), by Manufacturing Process 2025 & 2033
- Figure 6: Asia Pacific Synthetic Diamond Industry Revenue (billion), by Country 2025 & 2033
- Figure 7: Asia Pacific Synthetic Diamond Industry Revenue Share (%), by Country 2025 & 2033
- Figure 8: North America Synthetic Diamond Industry Revenue (billion), by Type 2025 & 2033
- Figure 9: North America Synthetic Diamond Industry Revenue Share (%), by Type 2025 & 2033
- Figure 10: North America Synthetic Diamond Industry Revenue (billion), by Manufacturing Process 2025 & 2033
- Figure 11: North America Synthetic Diamond Industry Revenue Share (%), by Manufacturing Process 2025 & 2033
- Figure 12: North America Synthetic Diamond Industry Revenue (billion), by Country 2025 & 2033
- Figure 13: North America Synthetic Diamond Industry Revenue Share (%), by Country 2025 & 2033
- Figure 14: Europe Synthetic Diamond Industry Revenue (billion), by Type 2025 & 2033
- Figure 15: Europe Synthetic Diamond Industry Revenue Share (%), by Type 2025 & 2033
- Figure 16: Europe Synthetic Diamond Industry Revenue (billion), by Manufacturing Process 2025 & 2033
- Figure 17: Europe Synthetic Diamond Industry Revenue Share (%), by Manufacturing Process 2025 & 2033
- Figure 18: Europe Synthetic Diamond Industry Revenue (billion), by Country 2025 & 2033
- Figure 19: Europe Synthetic Diamond Industry Revenue Share (%), by Country 2025 & 2033
- Figure 20: South America Synthetic Diamond Industry Revenue (billion), by Type 2025 & 2033
- Figure 21: South America Synthetic Diamond Industry Revenue Share (%), by Type 2025 & 2033
- Figure 22: South America Synthetic Diamond Industry Revenue (billion), by Manufacturing Process 2025 & 2033
- Figure 23: South America Synthetic Diamond Industry Revenue Share (%), by Manufacturing Process 2025 & 2033
- Figure 24: South America Synthetic Diamond Industry Revenue (billion), by Country 2025 & 2033
- Figure 25: South America Synthetic Diamond Industry Revenue Share (%), by Country 2025 & 2033
- Figure 26: Middle East and Africa Synthetic Diamond Industry Revenue (billion), by Type 2025 & 2033
- Figure 27: Middle East and Africa Synthetic Diamond Industry Revenue Share (%), by Type 2025 & 2033
- Figure 28: Middle East and Africa Synthetic Diamond Industry Revenue (billion), by Manufacturing Process 2025 & 2033
- Figure 29: Middle East and Africa Synthetic Diamond Industry Revenue Share (%), by Manufacturing Process 2025 & 2033
- Figure 30: Middle East and Africa Synthetic Diamond Industry Revenue (billion), by Country 2025 & 2033
- Figure 31: Middle East and Africa Synthetic Diamond Industry Revenue Share (%), by Country 2025 & 2033
List of Tables
- Table 1: Global Synthetic Diamond Industry Revenue billion Forecast, by Type 2020 & 2033
- Table 2: Global Synthetic Diamond Industry Revenue billion Forecast, by Manufacturing Process 2020 & 2033
- Table 3: Global Synthetic Diamond Industry Revenue billion Forecast, by Region 2020 & 2033
- Table 4: Global Synthetic Diamond Industry Revenue billion Forecast, by Type 2020 & 2033
- Table 5: Global Synthetic Diamond Industry Revenue billion Forecast, by Manufacturing Process 2020 & 2033
- Table 6: Global Synthetic Diamond Industry Revenue billion Forecast, by Country 2020 & 2033
- Table 7: China Synthetic Diamond Industry Revenue (billion) Forecast, by Application 2020 & 2033
- Table 8: India Synthetic Diamond Industry Revenue (billion) Forecast, by Application 2020 & 2033
- Table 9: Japan Synthetic Diamond Industry Revenue (billion) Forecast, by Application 2020 & 2033
- Table 10: ASEAN Countries Synthetic Diamond Industry Revenue (billion) Forecast, by Application 2020 & 2033
- Table 11: Rest of Asia Pacific Synthetic Diamond Industry Revenue (billion) Forecast, by Application 2020 & 2033
- Table 12: Global Synthetic Diamond Industry Revenue billion Forecast, by Type 2020 & 2033
- Table 13: Global Synthetic Diamond Industry Revenue billion Forecast, by Manufacturing Process 2020 & 2033
- Table 14: Global Synthetic Diamond Industry Revenue billion Forecast, by Country 2020 & 2033
- Table 15: United States Synthetic Diamond Industry Revenue (billion) Forecast, by Application 2020 & 2033
- Table 16: Rest of North America Synthetic Diamond Industry Revenue (billion) Forecast, by Application 2020 & 2033
- Table 17: Global Synthetic Diamond Industry Revenue billion Forecast, by Type 2020 & 2033
- Table 18: Global Synthetic Diamond Industry Revenue billion Forecast, by Manufacturing Process 2020 & 2033
- Table 19: Global Synthetic Diamond Industry Revenue billion Forecast, by Country 2020 & 2033
- Table 20: Germany Synthetic Diamond Industry Revenue (billion) Forecast, by Application 2020 & 2033
- Table 21: France Synthetic Diamond Industry Revenue (billion) Forecast, by Application 2020 & 2033
- Table 22: United Kingdom Synthetic Diamond Industry Revenue (billion) Forecast, by Application 2020 & 2033
- Table 23: Italy Synthetic Diamond Industry Revenue (billion) Forecast, by Application 2020 & 2033
- Table 24: Spain Synthetic Diamond Industry Revenue (billion) Forecast, by Application 2020 & 2033
- Table 25: Rest of Europe Synthetic Diamond Industry Revenue (billion) Forecast, by Application 2020 & 2033
- Table 26: Global Synthetic Diamond Industry Revenue billion Forecast, by Type 2020 & 2033
- Table 27: Global Synthetic Diamond Industry Revenue billion Forecast, by Manufacturing Process 2020 & 2033
- Table 28: Global Synthetic Diamond Industry Revenue billion Forecast, by Country 2020 & 2033
- Table 29: Brazil Synthetic Diamond Industry Revenue (billion) Forecast, by Application 2020 & 2033
- Table 30: Rest of South America Synthetic Diamond Industry Revenue (billion) Forecast, by Application 2020 & 2033
- Table 31: Global Synthetic Diamond Industry Revenue billion Forecast, by Type 2020 & 2033
- Table 32: Global Synthetic Diamond Industry Revenue billion Forecast, by Manufacturing Process 2020 & 2033
- Table 33: Global Synthetic Diamond Industry Revenue billion Forecast, by Country 2020 & 2033
- Table 34: GCC Countries Synthetic Diamond Industry Revenue (billion) Forecast, by Application 2020 & 2033
- Table 35: South Africa Synthetic Diamond Industry Revenue (billion) Forecast, by Application 2020 & 2033
- Table 36: Rest of Middle East and Africa Synthetic Diamond Industry Revenue (billion) Forecast, by Application 2020 & 2033
Frequently Asked Questions
1. What is the projected Compound Annual Growth Rate (CAGR) of the Synthetic Diamond Industry?
The projected CAGR is approximately 2.7%.
2. Which companies are prominent players in the Synthetic Diamond Industry?
Key companies in the market include Element Six UK Ltd, Zhengzhou Sino-Crystal Diamond Co Ltd, Zhongnan Diamond Co Ltd *List Not Exhaustive, ILJIN DIAMOND CO LTD, Swarovski, New Diamond Technology, Pure Grown Diamonds (PGD), Applied Diamond Inc, Henan Huanghe Whirlwind Co Ltd, Sumitomo Electric Industries Ltd, Adamas One Corp.
3. What are the main segments of the Synthetic Diamond Industry?
The market segments include Type, Manufacturing Process.
4. Can you provide details about the market size?
The market size is estimated to be USD 42.74 billion as of 2022.
5. What are some drivers contributing to market growth?
Increasing Demand from Electronics and Semiconductors Applications; Growing Demand for Super Abrasives.
6. What are the notable trends driving market growth?
Construction Segment to Dominate the Rough Type.
7. Are there any restraints impacting market growth?
Complex Manufacturing Process.
8. Can you provide examples of recent developments in the market?
In February 2022, Element Six UK Ltd collaborated with II-VI Inc. Through this collaboration, II-VI licenses Element Six's intellectual property and necessary equipment would produce high-quality single-crystal diamonds to expand its core competency in diamond technology.
9. What pricing options are available for accessing the report?
Pricing options include single-user, multi-user, and enterprise licenses priced at USD 4750, USD 5250, and USD 8750 respectively.
10. Is the market size provided in terms of value or volume?
The market size is provided in terms of value, measured in billion.
11. Are there any specific market keywords associated with the report?
Yes, the market keyword associated with the report is "Synthetic Diamond Industry," which aids in identifying and referencing the specific market segment covered.
12. How do I determine which pricing option suits my needs best?
The pricing options vary based on user requirements and access needs. Individual users may opt for single-user licenses, while businesses requiring broader access may choose multi-user or enterprise licenses for cost-effective access to the report.
13. Are there any additional resources or data provided in the Synthetic Diamond Industry report?
While the report offers comprehensive insights, it's advisable to review the specific contents or supplementary materials provided to ascertain if additional resources or data are available.
14. How can I stay updated on further developments or reports in the Synthetic Diamond Industry?
To stay informed about further developments, trends, and reports in the Synthetic Diamond Industry, consider subscribing to industry newsletters, following relevant companies and organizations, or regularly checking reputable industry news sources and publications.
Methodology
Step 1 - Identification of Relevant Samples Size from Population Database


Step 2 - Approaches for Defining Global Market Size (Value, Volume* & Price*)

Note*: In applicable scenarios
Step 3 - Data Sources
Primary Research
- Web Analytics
- Survey Reports
- Research Institute
- Latest Research Reports
- Opinion Leaders
Secondary Research
- Annual Reports
- White Paper
- Latest Press Release
- Industry Association
- Paid Database
- Investor Presentations

Step 4 - Data Triangulation
Involves using different sources of information in order to increase the validity of a study
These sources are likely to be stakeholders in a program - participants, other researchers, program staff, other community members, and so on.
Then we put all data in single framework & apply various statistical tools to find out the dynamic on the market.
During the analysis stage, feedback from the stakeholder groups would be compared to determine areas of agreement as well as areas of divergence