

Key Insights
The global Sizing Agent market is projected to reach $405 million by 2025, with a Compound Annual Growth Rate (CAGR) of 6.1% through 2033. This growth is driven by increasing demand from the textile industry for enhanced yarn strength and durability, and the paper and paperboard sector for improved printability and water resistance. The food and beverage industry's adoption of sizing agents for coatings and emulsifiers also contributes to market expansion. Asia Pacific is anticipated to lead growth due to rapid industrialization and rising consumer spending. Advancements in sustainable and efficient sizing solutions further support market trajectory.
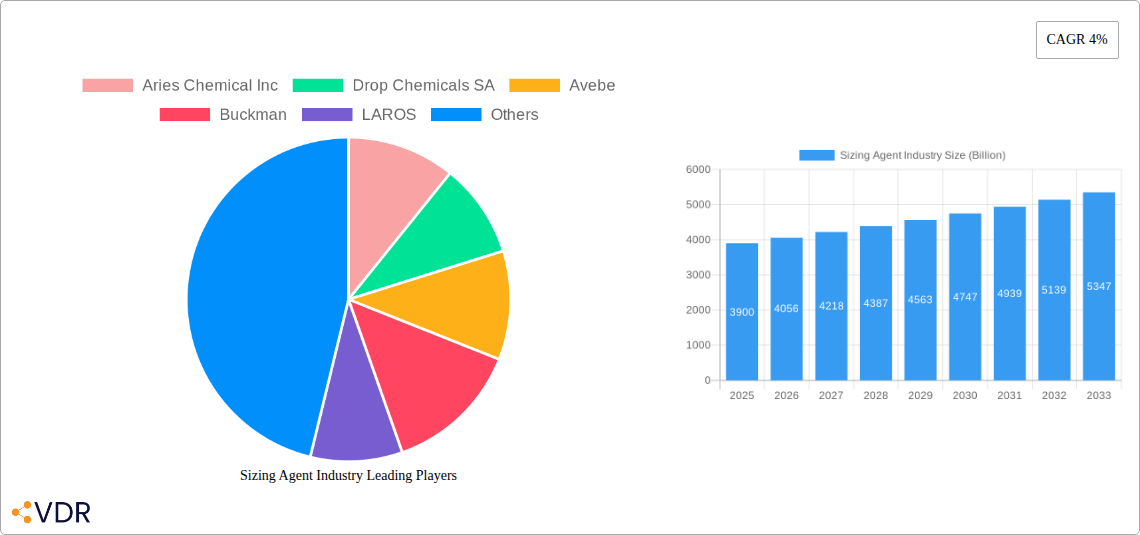
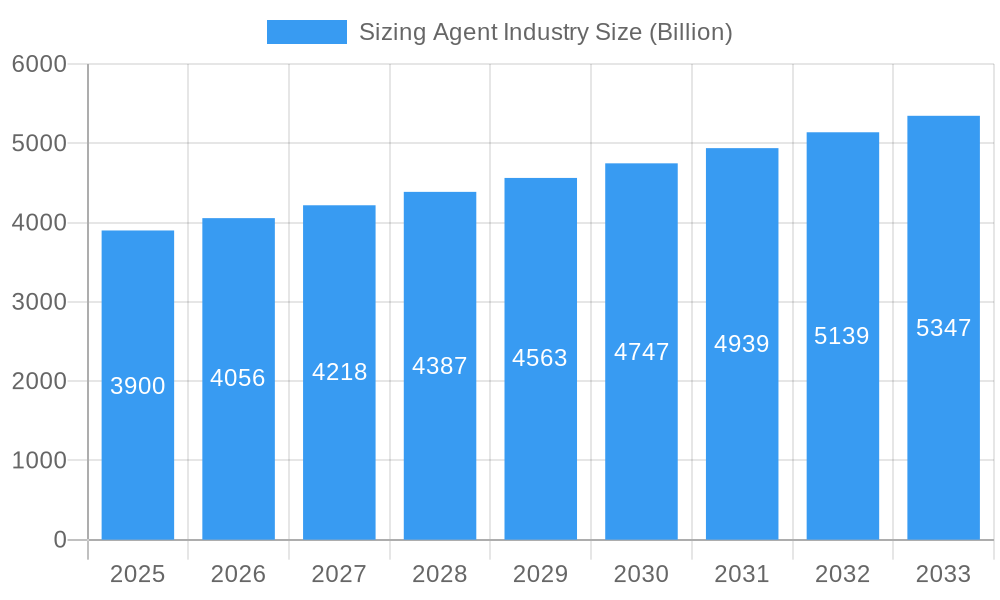
Sizing Agent Industry Market Size (In Million)
Challenges include raw material price volatility and environmental regulations. However, the development of bio-based and eco-friendly sizing agents presents a significant opportunity. Innovations in application technologies and strategic collaborations among key players like Aries Chemical Inc, Avebe, and Solenis will be vital for market success. While synthetic sizing agents are expected to maintain market dominance, natural sizing agents are poised for substantial growth driven by sustainability concerns. Geographic diversification and catering to specialized application needs will shape future market strategies.
Sizing Agent Industry Company Market Share
Sizing Agent Industry: Comprehensive Market Analysis (2019-2033)
This in-depth report provides a thorough analysis of the global Sizing Agent Industry, encompassing market dynamics, growth trends, regional dominance, product landscape, key drivers, challenges, opportunities, and the competitive environment. With a study period from 2019 to 2033, a base year of 2025, and a forecast period extending to 2033, this report offers actionable insights for industry stakeholders. The global sizing agent market size was valued at approximately $18.5 Billion in 2023 and is projected to reach $25.2 Billion by 2033, exhibiting a Compound Annual Growth Rate (CAGR) of 3.2%. The natural sizing agents market is expected to grow at a CAGR of 2.8%, while the synthetic sizing agents market is projected to expand at a CAGR of 3.5% during the forecast period.
Sizing Agent Industry Market Dynamics & Structure
The Sizing Agent Industry exhibits a moderately concentrated market structure, with key players investing significantly in research and development to drive technological innovation. The demand for high-performance and eco-friendly sizing agents is a primary innovation driver, pushing manufacturers to develop advanced formulations. Stringent environmental regulations and increasing consumer preference for sustainable products are shaping the industry's technological roadmap. Competitive product substitutes, particularly the increasing adoption of advanced synthetic polymers, pose a challenge to traditional natural sizing agents. End-user demographics are diverse, with the textiles industry and paper and paper board industry being the largest consumers.
- Market Concentration: Dominated by a mix of large multinational corporations and specialized regional manufacturers, with the top 10 companies holding an estimated 55% of the market share.
- Technological Innovation Drivers: Focus on bio-based and biodegradable sizing agents, improved water resistance, enhanced adhesion properties, and cost-effective production methods.
- Regulatory Frameworks: Growing emphasis on compliance with environmental standards like REACH and biocide regulations, influencing product formulations and raw material sourcing.
- Competitive Product Substitutes: Advancements in synthetic polymers like styrene-butadiene and acrylics are offering superior performance in certain applications, impacting demand for starch and cellulose-based agents.
- End-User Demographics: The paper and paper board segment accounts for an estimated 40% of the market consumption, followed by the textiles segment at 35%. The food and beverage industry represents 15%, and other applications contribute the remaining 10%.
- M&A Trends: Strategic acquisitions and mergers are observed as companies aim to expand their product portfolios, geographical reach, and technological capabilities. The volume of M&A deals has seen a steady increase, with an estimated 5-7 significant transactions annually over the past five years.
Sizing Agent Industry Growth Trends & Insights
The global Sizing Agent Industry is poised for robust growth, driven by burgeoning demand from key end-use sectors and advancements in product technology. Market size evolution is characterized by a steady upward trajectory, fueled by the increasing application of sizing agents in enhancing the properties of materials like paper, textiles, and food products. Adoption rates for advanced and sustainable sizing solutions are rapidly increasing as manufacturers and consumers become more environmentally conscious. Technological disruptions, such as the development of novel bio-based sizing agents derived from renewable resources, are reshaping the product landscape and opening new market avenues.
Shifts in consumer behavior, particularly the growing preference for eco-friendly and high-performance materials, are directly influencing the demand for specific types of sizing agents. The paper and paper board industry continues to be a significant growth engine, with rising demand for packaging materials and specialty papers necessitating improved surface properties. In the textiles industry, the need for enhanced fabric strength, water repellency, and printability drives the adoption of sophisticated sizing agents. The food and beverage sector is also witnessing increased utilization of sizing agents as functional ingredients and processing aids.
The CAGR of the sizing agent market is estimated at 3.2% for the period 2025-2033. Market penetration of synthetic sizing agents is projected to rise due to their superior performance characteristics and cost-effectiveness in specific applications. Natural sizing agents, however, are experiencing a resurgence driven by sustainability trends and their biodegradable nature. Key metrics indicating market growth include an increase in the volume of sizing agents produced and consumed annually, with a projected rise from approximately 8.2 Million Metric Tons in 2023 to 10.5 Million Metric Tons by 2033. The market penetration of specialty sizing agents designed for niche applications is also expanding, reflecting the industry's capacity for innovation and diversification.
Dominant Regions, Countries, or Segments in Sizing Agent Industry
The Paper and Paper Board segment is the dominant force within the global Sizing Agent Industry, driving a significant portion of market demand and growth. This dominance is attributed to the insatiable global appetite for paper products, ranging from packaging and printing paper to specialty papers and cardboard. The inherent need for improved surface characteristics, such as enhanced printability, water resistance, and dimensional stability, in paper and paperboard products directly translates into a substantial and consistent demand for sizing agents. The market share of the paper and paper board segment is estimated to be around 40% of the total sizing agent market.
- Key Drivers for Paper and Paper Board Dominance:
- Growing E-commerce and Packaging Demand: The exponential growth of e-commerce worldwide has dramatically increased the demand for corrugated boxes and other paper-based packaging solutions, a primary consumer of sizing agents.
- Shift Towards Sustainable Packaging: As concerns about plastic pollution mount, paper and paperboard are increasingly favored as sustainable alternatives, further bolstering demand for these materials and, consequently, sizing agents.
- Technological Advancements in Papermaking: Innovations in papermaking processes, including the development of high-speed machines and specialty paper grades, require advanced sizing agents to achieve desired paper properties.
- Government Initiatives and Regulations: Policies promoting the use of paper-based products and recycling efforts indirectly support the growth of the paper and paper board industry.
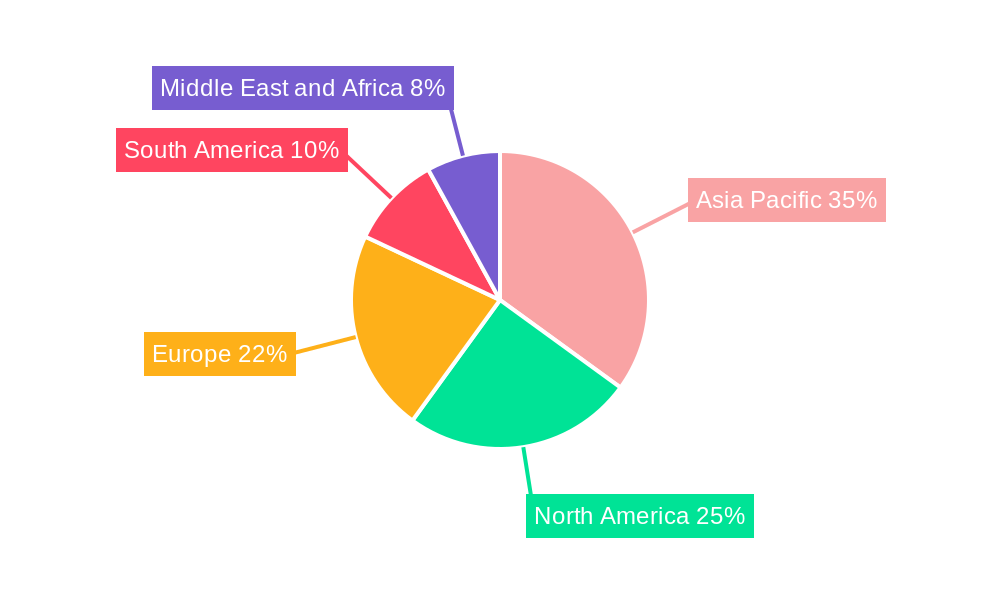
Geographically, Asia Pacific stands out as the leading region in the Sizing Agent Industry, propelled by rapid industrialization, burgeoning manufacturing capabilities, and a large consumer base. Countries like China and India are at the forefront of this regional dominance, owing to their extensive textiles industry and paper and paper board manufacturing hubs. The region's economic policies, robust infrastructure development, and increasing disposable incomes contribute significantly to the heightened demand for various sizing agents across multiple applications. The market share of the Asia Pacific region is estimated to be approximately 38%.
- Key Drivers for Asia Pacific Dominance:
- Largest Manufacturing Hub: Asia Pacific is the global manufacturing powerhouse for textiles and paper products, creating an immense and consistent demand for sizing agents.
- Economic Growth and Urbanization: Rapid economic development and increasing urbanization lead to higher consumption of paper-based products and textile goods.
- Favorable Government Policies: Proactive government initiatives supporting manufacturing and exports in these sectors further fuel market expansion.
- Growing Domestic Consumption: A large and growing middle class in countries like China and India drives domestic demand for finished goods that utilize sizing agents.
Sizing Agent Industry Product Landscape
The Sizing Agent Industry is characterized by continuous product innovation aimed at enhancing performance and sustainability. Key product developments include advanced synthetic polymers offering superior water resistance and durability in textiles and paper, alongside the growing availability of bio-based and biodegradable sizing agents derived from starches, celluloses, and natural resins. These innovations address the increasing demand for eco-friendly solutions without compromising on efficacy. Performance metrics such as improved surface strength, ink holdout, and dimensional stability are crucial selling propositions. Unique selling points often revolve around tailored formulations for specific applications, such as low-VOC (Volatile Organic Compound) sizing agents for the textile industry and specialized agents for high-quality printing papers. Technological advancements are also focusing on easier application processes and reduced environmental impact during manufacturing and use.
Key Drivers, Barriers & Challenges in Sizing Agent Industry
The Sizing Agent Industry is propelled by several key drivers that foster its growth and expansion. The increasing demand for high-performance materials in the textiles and paper sectors, driven by consumer preferences for durability and enhanced properties, is a significant factor. Furthermore, the growing emphasis on sustainable and eco-friendly solutions is boosting the adoption of bio-based and biodegradable sizing agents. Technological advancements leading to more efficient and cost-effective production processes also play a crucial role.
- Key Drivers:
- Growing demand for performance-enhancing materials in textiles and paper.
- Rising preference for sustainable and biodegradable sizing agents.
- Technological innovations leading to improved product efficacy and cost-effectiveness.
- Expansion of end-use industries like packaging and printing.
Conversely, the industry faces several barriers and challenges that can hinder its growth trajectory. Fluctuations in raw material prices, particularly for natural sources like starch and cellulose, can impact profit margins and pricing strategies. Stringent environmental regulations regarding the use and disposal of certain chemicals can also pose compliance challenges and necessitate costly reformulation efforts. Intense competition among manufacturers, leading to price wars, and the availability of functional substitutes can also create market pressures.
- Key Barriers & Challenges:
- Volatility in raw material prices and availability.
- Strict environmental regulations and compliance requirements.
- Intense competition and price sensitivity in the market.
- Availability of alternative functional ingredients.
- Supply chain disruptions and logistical complexities.
Emerging Opportunities in Sizing Agent Industry
Emerging opportunities in the Sizing Agent Industry are largely concentrated around sustainability, advanced material science, and untapped market potential. The burgeoning demand for bio-based and biodegradable sizing agents presents a significant avenue for growth, driven by increasing environmental consciousness and regulatory pressures. Innovations in nanotechnology are also paving the way for novel sizing agents with enhanced functionalities, such as antimicrobial properties or improved barrier characteristics. Furthermore, the expansion of the food and beverage industry, particularly in developing economies, offers opportunities for specialized food-grade sizing agents. Untapped markets in regions with developing textile and paper industries also represent considerable growth potential for established and new entrants.
- Emerging Opportunities:
- Development and commercialization of novel bio-based and biodegradable sizing agents.
- Exploration of nanotechnology for advanced sizing agent functionalities.
- Expansion into emerging markets with growing textile and paper industries.
- Tailored sizing solutions for niche applications in food and beverage and specialty chemicals.
Growth Accelerators in the Sizing Agent Industry Industry
Several catalysts are poised to accelerate the long-term growth of the Sizing Agent Industry. Continued investment in research and development will be crucial for the creation of next-generation sizing agents that offer superior performance, enhanced sustainability, and cost-effectiveness. Strategic partnerships between raw material suppliers, chemical manufacturers, and end-users will foster innovation and streamline the adoption of new technologies. Market expansion strategies, particularly focusing on emerging economies with rapidly growing textile and paper industries, will unlock significant growth potential. The increasing adoption of digital technologies in manufacturing and supply chain management will also contribute to operational efficiencies and market responsiveness.
Key Players Shaping the Sizing Agent Industry Market
- Aries Chemical Inc
- Drop Chemicals SA
- Avebe
- Buckman
- LAROS
- Refnol Resins & Chemicals Ltd
- Eco Polychem Pvt Ltd
- Huixian Tiankai Paper Making Agent Co Ltd
- Angel Starch & Food Private Limited
- Harima Chemicals Group Inc
- Associated Chemical
- Finor Piplaj Chemical Limited
- MATANGI INTERNATIONAL
- Solenis
- Mare SpA
Notable Milestones in Sizing Agent Industry Sector
- 2022/07: Solenis acquires Diversey's global industrial microbial control business, expanding its portfolio in water treatment and hygiene solutions, indirectly impacting sizing agent applications.
- 2021/11: Avebe launches a new range of innovative starch-based sizing agents with improved sustainability profiles for the paper industry.
- 2020/03: Buckman introduces a novel synthetic sizing agent for textiles that offers enhanced water repellency and durability, meeting stringent performance demands.
- 2019/09: Harima Chemicals Group Inc. announces significant investment in R&D for bio-based resins, signaling a shift towards more sustainable sizing agent components.
In-Depth Sizing Agent Industry Market Outlook
The future outlook for the Sizing Agent Industry is exceptionally promising, driven by a confluence of accelerating factors. The relentless pursuit of sustainability will continue to be a dominant theme, fueling innovation in bio-based and biodegradable sizing agents and opening lucrative avenues in environmentally conscious markets. Technological breakthroughs in material science will lead to the development of highly specialized sizing agents with advanced functionalities, catering to niche applications and premium product segments. Strategic market expansion into rapidly developing economies, coupled with collaborations and partnerships, will solidify the industry's growth trajectory. The industry is well-positioned to capitalize on evolving consumer preferences and stringent environmental regulations, ensuring sustained growth and increased market value.
Sizing Agent Industry Segmentation
-
1. Type
- 1.1. Natural
- 1.2. Synthetic
-
2. Application
- 2.1. Textiles
- 2.2. Paper and Paper Board
- 2.3. Food and Beverage
- 2.4. Other Applications
Sizing Agent Industry Segmentation By Geography
-
1. Asia Pacific
- 1.1. China
- 1.2. India
- 1.3. Japan
- 1.4. South Korea
- 1.5. Rest of Asia Pacific
-
2. North America
- 2.1. United States
- 2.2. Canada
- 2.3. Mexico
-
3. Europe
- 3.1. Germany
- 3.2. United Kingdom
- 3.3. Italy
- 3.4. France
- 3.5. Rest of Europe
-
4. South America
- 4.1. Brazil
- 4.2. Argentina
- 4.3. Rest of South America
-
5. Middle East and Africa
- 5.1. Saudi Arabia
- 5.2. South Africa
- 5.3. Rest of Middle East and Africa
Sizing Agent Industry Regional Market Share
Geographic Coverage of Sizing Agent Industry
Sizing Agent Industry REPORT HIGHLIGHTS
| Aspects | Details |
|---|---|
| Study Period | 2020-2034 |
| Base Year | 2025 |
| Estimated Year | 2026 |
| Forecast Period | 2026-2034 |
| Historical Period | 2020-2025 |
| Growth Rate | CAGR of 6.1% from 2020-2034 |
| Segmentation |
|
Table of Contents
- 1. Introduction
- 1.1. Research Scope
- 1.2. Market Segmentation
- 1.3. Research Objective
- 1.4. Definitions and Assumptions
- 2. Executive Summary
- 2.1. Market Snapshot
- 3. Market Dynamics
- 3.1. Market Drivers
- 3.2. Market Restrains
- 3.3. Market Trends
- 3.4. Market Opportunities
- 4. Market Factor Analysis
- 4.1. Porters Five Forces
- 4.1.1. Bargaining Power of Suppliers
- 4.1.2. Bargaining Power of Buyers
- 4.1.3. Threat of New Entrants
- 4.1.4. Threat of Substitutes
- 4.1.5. Competitive Rivalry
- 4.2. PESTEL analysis
- 4.3. BCG Analysis
- 4.3.1. Stars (High Growth, High Market Share)
- 4.3.2. Cash Cows (Low Growth, High Market Share)
- 4.3.3. Question Mark (High Growth, Low Market Share)
- 4.3.4. Dogs (Low Growth, Low Market Share)
- 4.4. Ansoff Matrix Analysis
- 4.5. Supply Chain Analysis
- 4.6. Regulatory Landscape
- 4.7. Current Market Potential and Opportunity Assessment (TAM–SAM–SOM Framework)
- 4.8. VDR Analyst Note
- 4.1. Porters Five Forces
- 5. Market Analysis, Insights and Forecast 2021-2033
- 5.1. Market Analysis, Insights and Forecast - by Type
- 5.1.1. Natural
- 5.1.2. Synthetic
- 5.2. Market Analysis, Insights and Forecast - by Application
- 5.2.1. Textiles
- 5.2.2. Paper and Paper Board
- 5.2.3. Food and Beverage
- 5.2.4. Other Applications
- 5.3. Market Analysis, Insights and Forecast - by Region
- 5.3.1. Asia Pacific
- 5.3.2. North America
- 5.3.3. Europe
- 5.3.4. South America
- 5.3.5. Middle East and Africa
- 5.1. Market Analysis, Insights and Forecast - by Type
- 6. Global Sizing Agent Industry Analysis, Insights and Forecast, 2021-2033
- 6.1. Market Analysis, Insights and Forecast - by Type
- 6.1.1. Natural
- 6.1.2. Synthetic
- 6.2. Market Analysis, Insights and Forecast - by Application
- 6.2.1. Textiles
- 6.2.2. Paper and Paper Board
- 6.2.3. Food and Beverage
- 6.2.4. Other Applications
- 6.1. Market Analysis, Insights and Forecast - by Type
- 7. Asia Pacific Sizing Agent Industry Analysis, Insights and Forecast, 2021-2033
- 7.1. Market Analysis, Insights and Forecast - by Type
- 7.1.1. Natural
- 7.1.2. Synthetic
- 7.2. Market Analysis, Insights and Forecast - by Application
- 7.2.1. Textiles
- 7.2.2. Paper and Paper Board
- 7.2.3. Food and Beverage
- 7.2.4. Other Applications
- 7.1. Market Analysis, Insights and Forecast - by Type
- 8. North America Sizing Agent Industry Analysis, Insights and Forecast, 2021-2033
- 8.1. Market Analysis, Insights and Forecast - by Type
- 8.1.1. Natural
- 8.1.2. Synthetic
- 8.2. Market Analysis, Insights and Forecast - by Application
- 8.2.1. Textiles
- 8.2.2. Paper and Paper Board
- 8.2.3. Food and Beverage
- 8.2.4. Other Applications
- 8.1. Market Analysis, Insights and Forecast - by Type
- 9. Europe Sizing Agent Industry Analysis, Insights and Forecast, 2021-2033
- 9.1. Market Analysis, Insights and Forecast - by Type
- 9.1.1. Natural
- 9.1.2. Synthetic
- 9.2. Market Analysis, Insights and Forecast - by Application
- 9.2.1. Textiles
- 9.2.2. Paper and Paper Board
- 9.2.3. Food and Beverage
- 9.2.4. Other Applications
- 9.1. Market Analysis, Insights and Forecast - by Type
- 10. South America Sizing Agent Industry Analysis, Insights and Forecast, 2021-2033
- 10.1. Market Analysis, Insights and Forecast - by Type
- 10.1.1. Natural
- 10.1.2. Synthetic
- 10.2. Market Analysis, Insights and Forecast - by Application
- 10.2.1. Textiles
- 10.2.2. Paper and Paper Board
- 10.2.3. Food and Beverage
- 10.2.4. Other Applications
- 10.1. Market Analysis, Insights and Forecast - by Type
- 11. Middle East and Africa Sizing Agent Industry Analysis, Insights and Forecast, 2021-2033
- 11.1. Market Analysis, Insights and Forecast - by Type
- 11.1.1. Natural
- 11.1.2. Synthetic
- 11.2. Market Analysis, Insights and Forecast - by Application
- 11.2.1. Textiles
- 11.2.2. Paper and Paper Board
- 11.2.3. Food and Beverage
- 11.2.4. Other Applications
- 11.1. Market Analysis, Insights and Forecast - by Type
- 12. Competitive Analysis
- 12.1. Company Profiles
- 12.1.1 Aries Chemical Inc
- 12.1.1.1. Company Overview
- 12.1.1.2. Products
- 12.1.1.3. Company Financials
- 12.1.1.4. SWOT Analysis
- 12.1.2 Drop Chemicals SA
- 12.1.2.1. Company Overview
- 12.1.2.2. Products
- 12.1.2.3. Company Financials
- 12.1.2.4. SWOT Analysis
- 12.1.3 Avebe
- 12.1.3.1. Company Overview
- 12.1.3.2. Products
- 12.1.3.3. Company Financials
- 12.1.3.4. SWOT Analysis
- 12.1.4 Buckman
- 12.1.4.1. Company Overview
- 12.1.4.2. Products
- 12.1.4.3. Company Financials
- 12.1.4.4. SWOT Analysis
- 12.1.5 LAROS
- 12.1.5.1. Company Overview
- 12.1.5.2. Products
- 12.1.5.3. Company Financials
- 12.1.5.4. SWOT Analysis
- 12.1.6 Refnol Resins & Chemicals Ltd
- 12.1.6.1. Company Overview
- 12.1.6.2. Products
- 12.1.6.3. Company Financials
- 12.1.6.4. SWOT Analysis
- 12.1.7 Eco Polychem Pvt Ltd
- 12.1.7.1. Company Overview
- 12.1.7.2. Products
- 12.1.7.3. Company Financials
- 12.1.7.4. SWOT Analysis
- 12.1.8 Huixian Tiankai Paper Making Agent Co Ltd
- 12.1.8.1. Company Overview
- 12.1.8.2. Products
- 12.1.8.3. Company Financials
- 12.1.8.4. SWOT Analysis
- 12.1.9 Angel Starch & Food Private Limited
- 12.1.9.1. Company Overview
- 12.1.9.2. Products
- 12.1.9.3. Company Financials
- 12.1.9.4. SWOT Analysis
- 12.1.10 Harima Chemicals Group Inc
- 12.1.10.1. Company Overview
- 12.1.10.2. Products
- 12.1.10.3. Company Financials
- 12.1.10.4. SWOT Analysis
- 12.1.11 Associated Chemical
- 12.1.11.1. Company Overview
- 12.1.11.2. Products
- 12.1.11.3. Company Financials
- 12.1.11.4. SWOT Analysis
- 12.1.12 Finor Piplaj Chemical Limited
- 12.1.12.1. Company Overview
- 12.1.12.2. Products
- 12.1.12.3. Company Financials
- 12.1.12.4. SWOT Analysis
- 12.1.13 MATANGI INTERNATIONAL
- 12.1.13.1. Company Overview
- 12.1.13.2. Products
- 12.1.13.3. Company Financials
- 12.1.13.4. SWOT Analysis
- 12.1.14 Solenis
- 12.1.14.1. Company Overview
- 12.1.14.2. Products
- 12.1.14.3. Company Financials
- 12.1.14.4. SWOT Analysis
- 12.1.15 Mare SpA
- 12.1.15.1. Company Overview
- 12.1.15.2. Products
- 12.1.15.3. Company Financials
- 12.1.15.4. SWOT Analysis
- 12.1.1 Aries Chemical Inc
- 12.2. Market Entropy
- 12.2.1 Company's Key Areas Served
- 12.2.2 Recent Developments
- 12.3. Company Market Share Analysis 2025
- 12.3.1 Top 5 Companies Market Share Analysis
- 12.3.2 Top 3 Companies Market Share Analysis
- 12.4. List of Potential Customers
- 13. Research Methodology
List of Figures
- Figure 1: Global Sizing Agent Industry Revenue Breakdown (million, %) by Region 2025 & 2033
- Figure 2: Global Sizing Agent Industry Volume Breakdown (K Tons, %) by Region 2025 & 2033
- Figure 3: Asia Pacific Sizing Agent Industry Revenue (million), by Type 2025 & 2033
- Figure 4: Asia Pacific Sizing Agent Industry Volume (K Tons), by Type 2025 & 2033
- Figure 5: Asia Pacific Sizing Agent Industry Revenue Share (%), by Type 2025 & 2033
- Figure 6: Asia Pacific Sizing Agent Industry Volume Share (%), by Type 2025 & 2033
- Figure 7: Asia Pacific Sizing Agent Industry Revenue (million), by Application 2025 & 2033
- Figure 8: Asia Pacific Sizing Agent Industry Volume (K Tons), by Application 2025 & 2033
- Figure 9: Asia Pacific Sizing Agent Industry Revenue Share (%), by Application 2025 & 2033
- Figure 10: Asia Pacific Sizing Agent Industry Volume Share (%), by Application 2025 & 2033
- Figure 11: Asia Pacific Sizing Agent Industry Revenue (million), by Country 2025 & 2033
- Figure 12: Asia Pacific Sizing Agent Industry Volume (K Tons), by Country 2025 & 2033
- Figure 13: Asia Pacific Sizing Agent Industry Revenue Share (%), by Country 2025 & 2033
- Figure 14: Asia Pacific Sizing Agent Industry Volume Share (%), by Country 2025 & 2033
- Figure 15: North America Sizing Agent Industry Revenue (million), by Type 2025 & 2033
- Figure 16: North America Sizing Agent Industry Volume (K Tons), by Type 2025 & 2033
- Figure 17: North America Sizing Agent Industry Revenue Share (%), by Type 2025 & 2033
- Figure 18: North America Sizing Agent Industry Volume Share (%), by Type 2025 & 2033
- Figure 19: North America Sizing Agent Industry Revenue (million), by Application 2025 & 2033
- Figure 20: North America Sizing Agent Industry Volume (K Tons), by Application 2025 & 2033
- Figure 21: North America Sizing Agent Industry Revenue Share (%), by Application 2025 & 2033
- Figure 22: North America Sizing Agent Industry Volume Share (%), by Application 2025 & 2033
- Figure 23: North America Sizing Agent Industry Revenue (million), by Country 2025 & 2033
- Figure 24: North America Sizing Agent Industry Volume (K Tons), by Country 2025 & 2033
- Figure 25: North America Sizing Agent Industry Revenue Share (%), by Country 2025 & 2033
- Figure 26: North America Sizing Agent Industry Volume Share (%), by Country 2025 & 2033
- Figure 27: Europe Sizing Agent Industry Revenue (million), by Type 2025 & 2033
- Figure 28: Europe Sizing Agent Industry Volume (K Tons), by Type 2025 & 2033
- Figure 29: Europe Sizing Agent Industry Revenue Share (%), by Type 2025 & 2033
- Figure 30: Europe Sizing Agent Industry Volume Share (%), by Type 2025 & 2033
- Figure 31: Europe Sizing Agent Industry Revenue (million), by Application 2025 & 2033
- Figure 32: Europe Sizing Agent Industry Volume (K Tons), by Application 2025 & 2033
- Figure 33: Europe Sizing Agent Industry Revenue Share (%), by Application 2025 & 2033
- Figure 34: Europe Sizing Agent Industry Volume Share (%), by Application 2025 & 2033
- Figure 35: Europe Sizing Agent Industry Revenue (million), by Country 2025 & 2033
- Figure 36: Europe Sizing Agent Industry Volume (K Tons), by Country 2025 & 2033
- Figure 37: Europe Sizing Agent Industry Revenue Share (%), by Country 2025 & 2033
- Figure 38: Europe Sizing Agent Industry Volume Share (%), by Country 2025 & 2033
- Figure 39: South America Sizing Agent Industry Revenue (million), by Type 2025 & 2033
- Figure 40: South America Sizing Agent Industry Volume (K Tons), by Type 2025 & 2033
- Figure 41: South America Sizing Agent Industry Revenue Share (%), by Type 2025 & 2033
- Figure 42: South America Sizing Agent Industry Volume Share (%), by Type 2025 & 2033
- Figure 43: South America Sizing Agent Industry Revenue (million), by Application 2025 & 2033
- Figure 44: South America Sizing Agent Industry Volume (K Tons), by Application 2025 & 2033
- Figure 45: South America Sizing Agent Industry Revenue Share (%), by Application 2025 & 2033
- Figure 46: South America Sizing Agent Industry Volume Share (%), by Application 2025 & 2033
- Figure 47: South America Sizing Agent Industry Revenue (million), by Country 2025 & 2033
- Figure 48: South America Sizing Agent Industry Volume (K Tons), by Country 2025 & 2033
- Figure 49: South America Sizing Agent Industry Revenue Share (%), by Country 2025 & 2033
- Figure 50: South America Sizing Agent Industry Volume Share (%), by Country 2025 & 2033
- Figure 51: Middle East and Africa Sizing Agent Industry Revenue (million), by Type 2025 & 2033
- Figure 52: Middle East and Africa Sizing Agent Industry Volume (K Tons), by Type 2025 & 2033
- Figure 53: Middle East and Africa Sizing Agent Industry Revenue Share (%), by Type 2025 & 2033
- Figure 54: Middle East and Africa Sizing Agent Industry Volume Share (%), by Type 2025 & 2033
- Figure 55: Middle East and Africa Sizing Agent Industry Revenue (million), by Application 2025 & 2033
- Figure 56: Middle East and Africa Sizing Agent Industry Volume (K Tons), by Application 2025 & 2033
- Figure 57: Middle East and Africa Sizing Agent Industry Revenue Share (%), by Application 2025 & 2033
- Figure 58: Middle East and Africa Sizing Agent Industry Volume Share (%), by Application 2025 & 2033
- Figure 59: Middle East and Africa Sizing Agent Industry Revenue (million), by Country 2025 & 2033
- Figure 60: Middle East and Africa Sizing Agent Industry Volume (K Tons), by Country 2025 & 2033
- Figure 61: Middle East and Africa Sizing Agent Industry Revenue Share (%), by Country 2025 & 2033
- Figure 62: Middle East and Africa Sizing Agent Industry Volume Share (%), by Country 2025 & 2033
List of Tables
- Table 1: Global Sizing Agent Industry Revenue million Forecast, by Type 2020 & 2033
- Table 2: Global Sizing Agent Industry Volume K Tons Forecast, by Type 2020 & 2033
- Table 3: Global Sizing Agent Industry Revenue million Forecast, by Application 2020 & 2033
- Table 4: Global Sizing Agent Industry Volume K Tons Forecast, by Application 2020 & 2033
- Table 5: Global Sizing Agent Industry Revenue million Forecast, by Region 2020 & 2033
- Table 6: Global Sizing Agent Industry Volume K Tons Forecast, by Region 2020 & 2033
- Table 7: Global Sizing Agent Industry Revenue million Forecast, by Type 2020 & 2033
- Table 8: Global Sizing Agent Industry Volume K Tons Forecast, by Type 2020 & 2033
- Table 9: Global Sizing Agent Industry Revenue million Forecast, by Application 2020 & 2033
- Table 10: Global Sizing Agent Industry Volume K Tons Forecast, by Application 2020 & 2033
- Table 11: Global Sizing Agent Industry Revenue million Forecast, by Country 2020 & 2033
- Table 12: Global Sizing Agent Industry Volume K Tons Forecast, by Country 2020 & 2033
- Table 13: China Sizing Agent Industry Revenue (million) Forecast, by Application 2020 & 2033
- Table 14: China Sizing Agent Industry Volume (K Tons) Forecast, by Application 2020 & 2033
- Table 15: India Sizing Agent Industry Revenue (million) Forecast, by Application 2020 & 2033
- Table 16: India Sizing Agent Industry Volume (K Tons) Forecast, by Application 2020 & 2033
- Table 17: Japan Sizing Agent Industry Revenue (million) Forecast, by Application 2020 & 2033
- Table 18: Japan Sizing Agent Industry Volume (K Tons) Forecast, by Application 2020 & 2033
- Table 19: South Korea Sizing Agent Industry Revenue (million) Forecast, by Application 2020 & 2033
- Table 20: South Korea Sizing Agent Industry Volume (K Tons) Forecast, by Application 2020 & 2033
- Table 21: Rest of Asia Pacific Sizing Agent Industry Revenue (million) Forecast, by Application 2020 & 2033
- Table 22: Rest of Asia Pacific Sizing Agent Industry Volume (K Tons) Forecast, by Application 2020 & 2033
- Table 23: Global Sizing Agent Industry Revenue million Forecast, by Type 2020 & 2033
- Table 24: Global Sizing Agent Industry Volume K Tons Forecast, by Type 2020 & 2033
- Table 25: Global Sizing Agent Industry Revenue million Forecast, by Application 2020 & 2033
- Table 26: Global Sizing Agent Industry Volume K Tons Forecast, by Application 2020 & 2033
- Table 27: Global Sizing Agent Industry Revenue million Forecast, by Country 2020 & 2033
- Table 28: Global Sizing Agent Industry Volume K Tons Forecast, by Country 2020 & 2033
- Table 29: United States Sizing Agent Industry Revenue (million) Forecast, by Application 2020 & 2033
- Table 30: United States Sizing Agent Industry Volume (K Tons) Forecast, by Application 2020 & 2033
- Table 31: Canada Sizing Agent Industry Revenue (million) Forecast, by Application 2020 & 2033
- Table 32: Canada Sizing Agent Industry Volume (K Tons) Forecast, by Application 2020 & 2033
- Table 33: Mexico Sizing Agent Industry Revenue (million) Forecast, by Application 2020 & 2033
- Table 34: Mexico Sizing Agent Industry Volume (K Tons) Forecast, by Application 2020 & 2033
- Table 35: Global Sizing Agent Industry Revenue million Forecast, by Type 2020 & 2033
- Table 36: Global Sizing Agent Industry Volume K Tons Forecast, by Type 2020 & 2033
- Table 37: Global Sizing Agent Industry Revenue million Forecast, by Application 2020 & 2033
- Table 38: Global Sizing Agent Industry Volume K Tons Forecast, by Application 2020 & 2033
- Table 39: Global Sizing Agent Industry Revenue million Forecast, by Country 2020 & 2033
- Table 40: Global Sizing Agent Industry Volume K Tons Forecast, by Country 2020 & 2033
- Table 41: Germany Sizing Agent Industry Revenue (million) Forecast, by Application 2020 & 2033
- Table 42: Germany Sizing Agent Industry Volume (K Tons) Forecast, by Application 2020 & 2033
- Table 43: United Kingdom Sizing Agent Industry Revenue (million) Forecast, by Application 2020 & 2033
- Table 44: United Kingdom Sizing Agent Industry Volume (K Tons) Forecast, by Application 2020 & 2033
- Table 45: Italy Sizing Agent Industry Revenue (million) Forecast, by Application 2020 & 2033
- Table 46: Italy Sizing Agent Industry Volume (K Tons) Forecast, by Application 2020 & 2033
- Table 47: France Sizing Agent Industry Revenue (million) Forecast, by Application 2020 & 2033
- Table 48: France Sizing Agent Industry Volume (K Tons) Forecast, by Application 2020 & 2033
- Table 49: Rest of Europe Sizing Agent Industry Revenue (million) Forecast, by Application 2020 & 2033
- Table 50: Rest of Europe Sizing Agent Industry Volume (K Tons) Forecast, by Application 2020 & 2033
- Table 51: Global Sizing Agent Industry Revenue million Forecast, by Type 2020 & 2033
- Table 52: Global Sizing Agent Industry Volume K Tons Forecast, by Type 2020 & 2033
- Table 53: Global Sizing Agent Industry Revenue million Forecast, by Application 2020 & 2033
- Table 54: Global Sizing Agent Industry Volume K Tons Forecast, by Application 2020 & 2033
- Table 55: Global Sizing Agent Industry Revenue million Forecast, by Country 2020 & 2033
- Table 56: Global Sizing Agent Industry Volume K Tons Forecast, by Country 2020 & 2033
- Table 57: Brazil Sizing Agent Industry Revenue (million) Forecast, by Application 2020 & 2033
- Table 58: Brazil Sizing Agent Industry Volume (K Tons) Forecast, by Application 2020 & 2033
- Table 59: Argentina Sizing Agent Industry Revenue (million) Forecast, by Application 2020 & 2033
- Table 60: Argentina Sizing Agent Industry Volume (K Tons) Forecast, by Application 2020 & 2033
- Table 61: Rest of South America Sizing Agent Industry Revenue (million) Forecast, by Application 2020 & 2033
- Table 62: Rest of South America Sizing Agent Industry Volume (K Tons) Forecast, by Application 2020 & 2033
- Table 63: Global Sizing Agent Industry Revenue million Forecast, by Type 2020 & 2033
- Table 64: Global Sizing Agent Industry Volume K Tons Forecast, by Type 2020 & 2033
- Table 65: Global Sizing Agent Industry Revenue million Forecast, by Application 2020 & 2033
- Table 66: Global Sizing Agent Industry Volume K Tons Forecast, by Application 2020 & 2033
- Table 67: Global Sizing Agent Industry Revenue million Forecast, by Country 2020 & 2033
- Table 68: Global Sizing Agent Industry Volume K Tons Forecast, by Country 2020 & 2033
- Table 69: Saudi Arabia Sizing Agent Industry Revenue (million) Forecast, by Application 2020 & 2033
- Table 70: Saudi Arabia Sizing Agent Industry Volume (K Tons) Forecast, by Application 2020 & 2033
- Table 71: South Africa Sizing Agent Industry Revenue (million) Forecast, by Application 2020 & 2033
- Table 72: South Africa Sizing Agent Industry Volume (K Tons) Forecast, by Application 2020 & 2033
- Table 73: Rest of Middle East and Africa Sizing Agent Industry Revenue (million) Forecast, by Application 2020 & 2033
- Table 74: Rest of Middle East and Africa Sizing Agent Industry Volume (K Tons) Forecast, by Application 2020 & 2033
Frequently Asked Questions
1. What is the projected Compound Annual Growth Rate (CAGR) of the Sizing Agent Industry?
The projected CAGR is approximately 6.1%.
2. Which companies are prominent players in the Sizing Agent Industry?
Key companies in the market include Aries Chemical Inc, Drop Chemicals SA, Avebe, Buckman, LAROS, Refnol Resins & Chemicals Ltd, Eco Polychem Pvt Ltd, Huixian Tiankai Paper Making Agent Co Ltd, Angel Starch & Food Private Limited, Harima Chemicals Group Inc, Associated Chemical, Finor Piplaj Chemical Limited, MATANGI INTERNATIONAL, Solenis, Mare SpA.
3. What are the main segments of the Sizing Agent Industry?
The market segments include Type, Application.
4. Can you provide details about the market size?
The market size is estimated to be USD 405 million as of 2022.
5. What are some drivers contributing to market growth?
; Growing Demand from the Textile Industry; Increasing Demand from the Paper Manufacturing Industries.
6. What are the notable trends driving market growth?
Growing Demand from the Textile Manufacturing Industry.
7. Are there any restraints impacting market growth?
; Stringent Environmental Regulations; Unfavorable Conditions Arising Due to the COVID-19 Outbreak.
8. Can you provide examples of recent developments in the market?
N/A
9. What pricing options are available for accessing the report?
Pricing options include single-user, multi-user, and enterprise licenses priced at USD 4750, USD 5250, and USD 8750 respectively.
10. Is the market size provided in terms of value or volume?
The market size is provided in terms of value, measured in million and volume, measured in K Tons.
11. Are there any specific market keywords associated with the report?
Yes, the market keyword associated with the report is "Sizing Agent Industry," which aids in identifying and referencing the specific market segment covered.
12. How do I determine which pricing option suits my needs best?
The pricing options vary based on user requirements and access needs. Individual users may opt for single-user licenses, while businesses requiring broader access may choose multi-user or enterprise licenses for cost-effective access to the report.
13. Are there any additional resources or data provided in the Sizing Agent Industry report?
While the report offers comprehensive insights, it's advisable to review the specific contents or supplementary materials provided to ascertain if additional resources or data are available.
14. How can I stay updated on further developments or reports in the Sizing Agent Industry?
To stay informed about further developments, trends, and reports in the Sizing Agent Industry, consider subscribing to industry newsletters, following relevant companies and organizations, or regularly checking reputable industry news sources and publications.
Methodology
Step 1 - Identification of Relevant Samples Size from Population Database


Step 2 - Approaches for Defining Global Market Size (Value, Volume* & Price*)

Note*: In applicable scenarios
Step 3 - Data Sources
Primary Research
- Web Analytics
- Survey Reports
- Research Institute
- Latest Research Reports
- Opinion Leaders
Secondary Research
- Annual Reports
- White Paper
- Latest Press Release
- Industry Association
- Paid Database
- Investor Presentations

Step 4 - Data Triangulation
Involves using different sources of information in order to increase the validity of a study
These sources are likely to be stakeholders in a program - participants, other researchers, program staff, other community members, and so on.
Then we put all data in single framework & apply various statistical tools to find out the dynamic on the market.
During the analysis stage, feedback from the stakeholder groups would be compared to determine areas of agreement as well as areas of divergence