

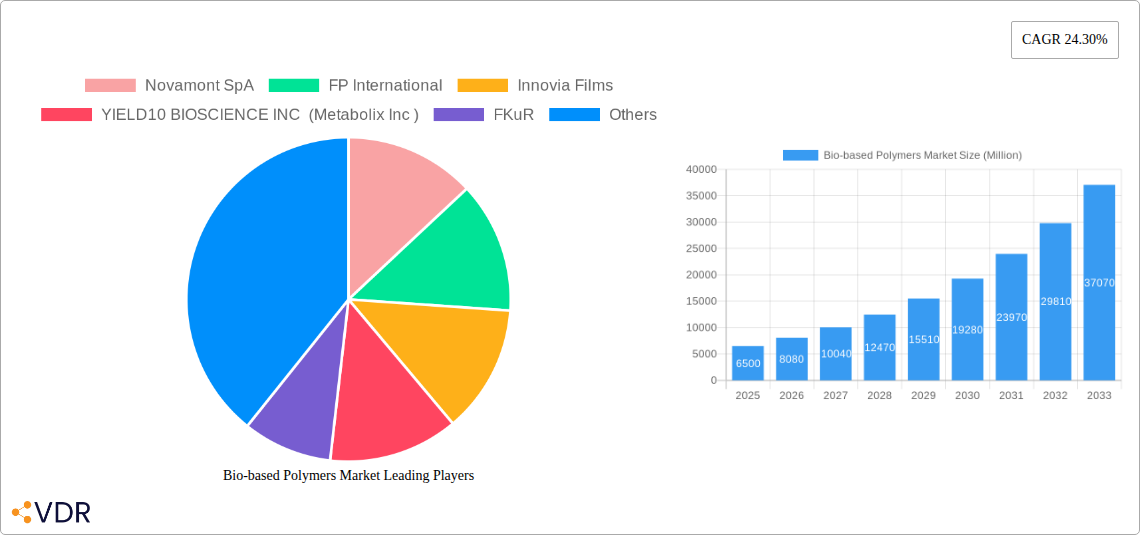
Key Insights
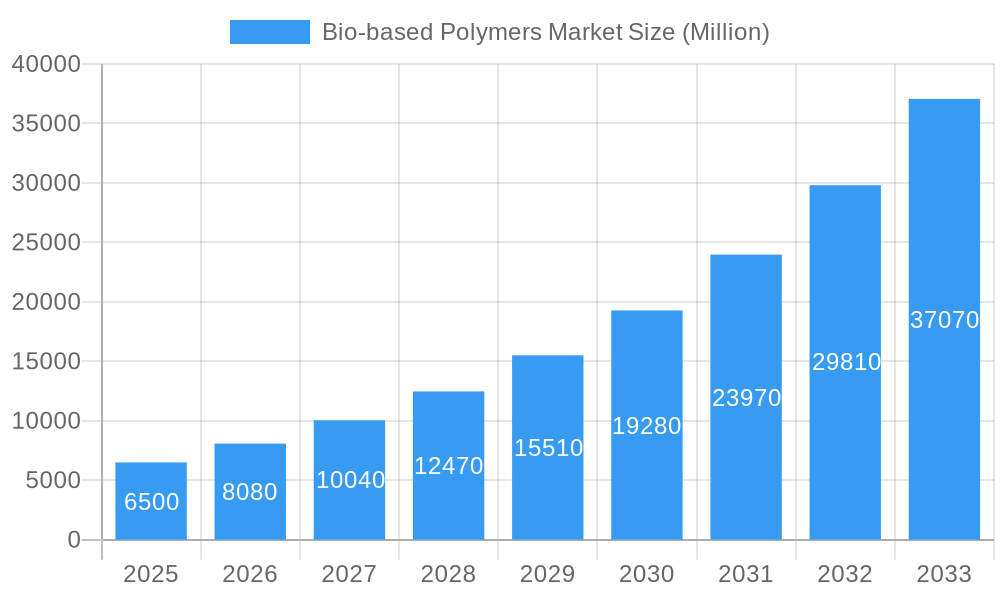
The global bio-based polymers market is experiencing robust growth, projected to reach a substantial market size of approximately $6,500 million by 2025, driven by a remarkable Compound Annual Growth Rate (CAGR) of 24.30%. This significant expansion is fueled by increasing consumer demand for sustainable products and stringent government regulations aimed at reducing plastic waste and promoting environmentally friendly alternatives. Key market drivers include the growing awareness of the environmental impact of traditional petroleum-based plastics, advancements in biopolymer production technologies leading to improved performance and cost-effectiveness, and the expanding applications across diverse industries. Packaging and agriculture are expected to remain dominant application segments, benefiting from the inherent biodegradability and compostability of many bio-based polymers. Innovations in material science are continually expanding the performance capabilities and application scope of these materials, making them viable substitutes for conventional plastics in demanding sectors.
Bio-based Polymers Market Market Size (In Billion)
The market is characterized by a dynamic competitive landscape with a blend of established chemical giants and specialized biopolymer manufacturers. Companies like NatureWorks LLC, Novamont SpA, and BASF SE are actively investing in research and development to introduce novel bio-based materials and expand their production capacities. The market is segmented by type, with Polylactic Acid (PLA), Polyhydroxyalkanoates (PHA), and starch-based plastics leading the adoption. Emerging trends indicate a focus on developing bio-based polymers with enhanced mechanical properties, thermal resistance, and barrier functionalities to cater to more sophisticated applications. Despite the strong growth trajectory, challenges such as the relatively higher cost of some bio-based polymers compared to conventional plastics and the need for improved end-of-life infrastructure for biodegradable materials continue to be addressed. The Asia Pacific region is anticipated to emerge as a key growth hub, propelled by rapid industrialization and supportive government initiatives.
Bio-based Polymers Market Company Market Share
This comprehensive report offers an in-depth analysis of the global bio-based polymers market, a sector experiencing significant growth driven by increasing environmental consciousness, regulatory mandates, and technological advancements. We provide detailed insights into market dynamics, growth trends, regional dominance, product landscape, key challenges, and emerging opportunities, all crucial for stakeholders seeking to navigate this evolving industry. The report covers the Study Period: 2019–2033, with Base Year: 2025 and Forecast Period: 2025–2033, building upon Historical Period: 2019–2024. All quantitative values are presented in Million units.
Bio-based Polymers Market Market Dynamics & Structure
The bio-based polymers market is characterized by a dynamic interplay of factors influencing its structure and growth. Technological innovation is a primary driver, with ongoing research and development leading to improved material properties, novel production methods, and cost reductions, thereby expanding the application scope for bio-based alternatives. Regulatory frameworks, such as bans on single-use plastics and mandates for sustainable sourcing, are increasingly shaping market demand and encouraging widespread adoption of bio-based solutions. Competitive product substitutes, primarily conventional petroleum-based plastics, pose a challenge, but the growing preference for eco-friendly materials is steadily eroding their dominance. End-user demographics are shifting, with a growing segment of environmentally aware consumers and businesses actively seeking sustainable product options. Mergers and acquisitions (M&A) trends indicate strategic consolidation within the industry as larger players seek to expand their bio-based portfolios and secure market share. For instance, recent M&A activity has seen established chemical companies investing in or acquiring smaller bio-based polymer producers to integrate sustainable offerings into their product lines. Market concentration varies across segments, with certain bio-based polymer types, like Poly Lactic Acid (PLA), exhibiting higher degrees of consolidation due to mature production technologies and established supply chains. However, newer materials like PolyHydroxy Alkanoates (PHA) are still in a nascent stage, offering broader opportunities for new entrants and innovation.
- Technological Innovation Drivers: Advancements in fermentation processes, enzyme technology, and polymer synthesis are key to enhancing material performance and reducing production costs.
- Regulatory Frameworks: Government incentives, plastic reduction targets, and extended producer responsibility schemes are creating a favorable environment for bio-based polymer adoption.
- Competitive Product Substitutes: The persistent cost advantage and performance parity of traditional plastics remain a significant barrier, requiring bio-based alternatives to demonstrate clear value propositions.
- End-User Demographics: Increasing consumer demand for sustainable products, coupled with corporate social responsibility initiatives, is driving B2B and B2C adoption.
- M&A Trends: Strategic partnerships and acquisitions are consolidating market share and fostering innovation through knowledge and resource sharing.
Bio-based Polymers Market Growth Trends & Insights
The global bio-based polymers market is projected to experience robust growth, driven by an escalating demand for sustainable materials across diverse industries. The market size is anticipated to expand significantly from an estimated xx million units in 2025 to reach xx million units by 2033, reflecting a compelling Compound Annual Growth Rate (CAGR) of xx%. This expansion is fueled by a confluence of factors, including heightened environmental awareness among consumers and businesses, stringent government regulations phasing out single-use plastics, and continuous technological advancements that are improving the performance and cost-effectiveness of bio-based polymers. Adoption rates are steadily increasing, particularly in the packaging sector, where the push for compostable and biodegradable alternatives is paramount. Consumer behavior is undergoing a discernible shift, with a growing preference for products that align with their sustainability values, prompting manufacturers to integrate bio-based materials into their product lines. Technological disruptions, such as the development of novel bio-based feedstocks and more efficient polymerization techniques, are further accelerating market penetration. For example, advancements in genetically modified microorganisms for PHA production are significantly boosting its viability and scalability. The increasing availability of bio-based alternatives with comparable or superior properties to conventional plastics is also a key growth driver. Furthermore, the circular economy principles are gaining traction, positioning bio-based polymers as a crucial component in achieving sustainable material flows. The market is witnessing a diversification of applications, moving beyond traditional uses to innovative sectors like electronics and healthcare, which are actively seeking greener material solutions. The forecast period is expected to be characterized by a sustained upward trajectory, as the industry matures and overcomes existing challenges related to cost competitiveness and scalability.
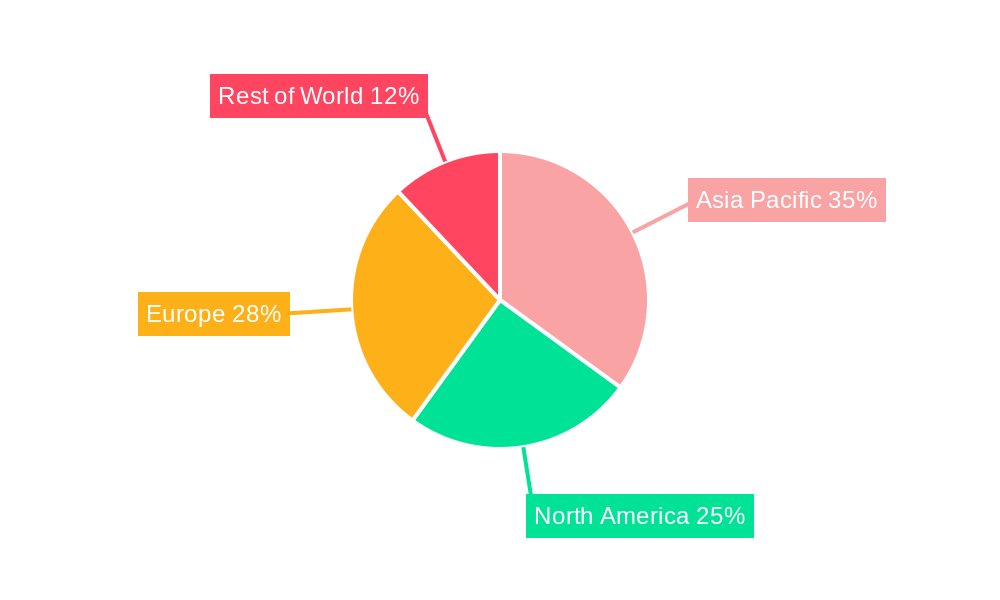
Dominant Regions, Countries, or Segments in Bio-based Polymers Market
The global bio-based polymers market is experiencing dynamic growth, with specific regions and segments demonstrating exceptional leadership. Europe currently stands as a dominant force, driven by stringent environmental regulations, robust government support for sustainability initiatives, and a highly conscious consumer base. The region's commitment to reducing plastic waste and transitioning towards a circular economy has fostered a fertile ground for bio-based polymers, particularly in packaging and agriculture applications. Countries like Germany, France, and the Netherlands are at the forefront, with significant investments in research and development and the establishment of robust bio-based production facilities. Asia Pacific is emerging as a rapidly growing hub, fueled by its vast manufacturing base, increasing environmental awareness, and supportive government policies aimed at promoting sustainable alternatives. China, in particular, is a significant player, with a growing demand for bio-based plastics in packaging and textiles, coupled with substantial investments in domestic production capabilities.
Within the Type segment, Poly Lactic Acid (PLA) is currently a leading player, owing to its established production technology, wide range of applications (packaging, textiles, 3D printing), and relatively good biodegradability and compostability. Its market share is substantial, driven by its versatility and increasing acceptance. Polyesters (PBS, PBAT, and PCL) are also experiencing significant traction, particularly PBAT (Polybutylene Adipate Terephthalate) for its excellent flexibility and processability in film applications. Starch-based plastics continue to hold a significant share due to their cost-effectiveness and availability, especially in disposable applications. PolyHydroxy Alkanoates (PHA), though still a niche market, is poised for substantial growth due to its superior biodegradability in diverse environments, including marine.
In terms of Application, the Packaging segment is the undisputed leader, accounting for a substantial portion of the bio-based polymers market. This dominance is propelled by global efforts to curb plastic pollution, reduce carbon footprints, and meet consumer demand for sustainable packaging solutions. The increasing use of bio-based polymers in food packaging, disposable cutlery, and flexible packaging films underscores this trend. The Agriculture sector is another key driver, with bio-based polymers being utilized in mulch films, controlled-release fertilizers, and plant pots, contributing to sustainable farming practices and soil health.
- Leading Region: Europe, due to its advanced regulatory frameworks and strong consumer demand for sustainability.
- Dominant Type: Poly Lactic Acid (PLA), benefiting from established production and diverse applications.
- Dominant Application: Packaging, driven by global efforts to combat plastic pollution.
- Key Drivers in Dominant Segments: Supportive government policies, consumer preference for eco-friendly products, and continuous technological advancements improving material performance and cost-effectiveness.
Bio-based Polymers Market Product Landscape
The bio-based polymers market is characterized by a vibrant landscape of innovative products designed to meet specific performance requirements and sustainability goals. Leading manufacturers are continuously enhancing the properties of bio-based polymers, focusing on improved strength, flexibility, heat resistance, and barrier properties, thereby broadening their applicability. Poly Lactic Acid (PLA) grades are now available with enhanced toughness and clarity, making them suitable for a wider range of packaging formats and consumer goods. PolyHydroxy Alkanoates (PHA) are emerging with tailored biodegradability profiles, catering to applications requiring degradation in specific environments. Innovations in polyester blends are yielding materials with excellent compostability and mechanical performance for flexible packaging and agricultural films. Cellulose derivatives are finding new applications in advanced composites and biomedical devices, leveraging their unique properties. The focus is on developing bio-based polymers that can directly substitute or outperform their petroleum-based counterparts, offering unique selling propositions such as reduced carbon footprint, biodegradability, and compostability without compromising on functionality.
Key Drivers, Barriers & Challenges in Bio-based Polymers Market
Key Drivers: The bio-based polymers market is propelled by a powerful combination of factors. Growing environmental consciousness and consumer demand for sustainable products are creating a strong market pull. Stringent government regulations, including plastic bans and mandates for recycled or bio-based content, are providing significant policy-driven support. Technological advancements in feedstock production, polymerization processes, and material science are enhancing the performance and cost-competitiveness of bio-based alternatives. Furthermore, corporate sustainability goals and the pursuit of a circular economy are driving widespread adoption across various industries.
Key Barriers & Challenges: Despite the positive growth trajectory, the bio-based polymers market faces several significant challenges. The primary barrier remains the cost competitiveness compared to conventional petroleum-based plastics, which often have established, large-scale production efficiencies. Scalability of production for certain novel bio-based polymers can be a constraint, impacting supply chain reliability. The availability and sustainability of feedstocks are also critical considerations, requiring careful sourcing to avoid competition with food crops and ensuring responsible land use. Consumer awareness and understanding of bio-based materials, particularly regarding their end-of-life options (e.g., industrial composting), can also be a barrier to effective disposal. Regulatory fragmentation and the lack of harmonized standards across different regions can create complexity for global manufacturers.
Emerging Opportunities in Bio-based Polymers Market
Emerging opportunities in the bio-based polymers market are numerous and diverse. The development of advanced bio-based materials with enhanced functionalities, such as improved heat resistance and biodegradability in specific environments (e.g., marine), presents a significant growth avenue. Untapped markets in developing economies, where the demand for sustainable solutions is rising, offer substantial potential. Innovative applications in sectors like biodegradable electronics, sustainable textiles with enhanced performance, and advanced biomedical devices are creating new demand. The growing trend of bioplastics for 3D printing and additive manufacturing is another promising area. Furthermore, the development of robust end-of-life solutions, including advanced composting infrastructure and chemical recycling technologies for bio-based polymers, will unlock further market potential and address current disposal challenges.
Growth Accelerators in the Bio-based Polymers Market Industry
Several catalysts are accelerating the long-term growth of the bio-based polymers market. Continuous breakthroughs in biotechnology, particularly in the development of more efficient and cost-effective fermentation processes for producing bio-monomers, are crucial. Strategic partnerships between raw material suppliers, polymer manufacturers, and end-users are fostering innovation and market penetration. For instance, collaborations to develop customized bio-based polymer grades for specific packaging applications are gaining momentum. Market expansion strategies, including geographical diversification and the development of targeted product portfolios for emerging markets, are also driving growth. Investments in research and development aimed at improving the performance and reducing the cost of bio-based polymers, making them more competitive with traditional plastics, are vital for sustained expansion. The increasing emphasis on the circular economy and sustainable sourcing further solidifies the long-term growth prospects.
Key Players Shaping the Bio-based Polymers Market Market
- Novamont SpA
- FP International
- Innovia Films
- YIELD10 BIOSCIENCE INC (Metabolix Inc )
- FKuR
- Merck KGaA
- Cardia Bioplastics
- Rodenburg Biopolymers
- Covestro AG
- NatureWorks LLC
- thyssenkrupp AG
- DuPont de Nemours Inc
- Biologische Naturverpackungen GmbH & Co KG
- Corbion
- Cortec Group Management Services LLC
- SHOWA DENKO K K
- BASF SE
Notable Milestones in Bio-based Polymers Market Sector
- 2020: NatureWorks LLC launches its new 3D printing filament based on Ingeo PLA, expanding its application portfolio.
- 2021: Novamont SpA announces a significant investment in expanding its Mater-Bi production capacity to meet growing demand for its compostable bioplastics.
- 2021: Corbion introduces a new grade of Poly Lactic Acid (PLA) with enhanced properties for rigid food packaging applications.
- 2022: FKuR invests in new production lines for biodegradable and compostable polymers to cater to the increasing European market demand.
- 2022: YIELD10 BIOSCIENCE INC (Metabolix Inc) announces progress in its PHA production technology, signaling potential for cost reduction and scalability.
- 2023: Covestro AG expands its portfolio of bio-based polyols for coatings and adhesives, further integrating sustainable solutions into industrial applications.
- 2023: BASF SE showcases its new portfolio of bio-based polymers designed for agricultural applications, focusing on sustainability and soil health.
- 2024: Innovia Films introduces a new range of compostable films for flexible packaging, meeting stringent regulatory and consumer demands.
In-Depth Bio-based Polymers Market Market Outlook
The future outlook for the bio-based polymers market is exceptionally promising, characterized by sustained growth and innovation. Growth accelerators such as advancements in biochemical conversion technologies, leading to more efficient and cost-effective production of bio-monomers, will be pivotal. Strategic collaborations and partnerships across the value chain will continue to drive market penetration and product development. The increasing focus on circular economy principles and government initiatives promoting sustainable materials will create a favorable operating environment. Furthermore, the development of advanced bio-based polymers with tailored functionalities and improved performance will unlock new applications and expand market reach. The ongoing transition towards a bio-based economy, coupled with rising consumer and industry demand for environmentally responsible solutions, positions the bio-based polymers market for substantial and long-term expansion, representing a significant opportunity for stakeholders to capitalize on the growing sustainability imperative.
Bio-based Polymers Market Segmentation
-
1. Type
- 1.1. Starch-based Plastics
- 1.2. Poly Lactic Acid (PLA)
- 1.3. PolyHydroxy Alkanoates (PHA)
- 1.4. Polyesters (PBS, PBAT, and PCL)
- 1.5. Cellulose Derivatives
-
2. Application
- 2.1. Agriculture
- 2.2. Textile
- 2.3. Electronics
- 2.4. Packaging
- 2.5. Healthcare
- 2.6. Other Applications
Bio-based Polymers Market Segmentation By Geography
-
1. Asia Pacific
- 1.1. China
- 1.2. India
- 1.3. Japan
- 1.4. South Korea
- 1.5. Rest of Asia Pacific
-
2. North America
- 2.1. United States
- 2.2. Canada
- 2.3. Mexico
-
3. Europe
- 3.1. Germany
- 3.2. United Kingdom
- 3.3. Italy
- 3.4. France
- 3.5. Rest of Europe
-
4. Rest of World
- 4.1. Brazil
- 4.2. Saudi Arabia
- 4.3. Rest of the World
Bio-based Polymers Market Regional Market Share
Geographic Coverage of Bio-based Polymers Market
Bio-based Polymers Market REPORT HIGHLIGHTS
| Aspects | Details |
|---|---|
| Study Period | 2020-2034 |
| Base Year | 2025 |
| Estimated Year | 2026 |
| Forecast Period | 2026-2034 |
| Historical Period | 2020-2025 |
| Growth Rate | CAGR of 24.30% from 2020-2034 |
| Segmentation |
|
Table of Contents
- 1. Introduction
- 1.1. Research Scope
- 1.2. Market Segmentation
- 1.3. Research Objective
- 1.4. Definitions and Assumptions
- 2. Executive Summary
- 2.1. Market Snapshot
- 3. Market Dynamics
- 3.1. Market Drivers
- 3.2. Market Restrains
- 3.3. Market Trends
- 3.4. Market Opportunities
- 4. Market Factor Analysis
- 4.1. Porters Five Forces
- 4.1.1. Bargaining Power of Suppliers
- 4.1.2. Bargaining Power of Buyers
- 4.1.3. Threat of New Entrants
- 4.1.4. Threat of Substitutes
- 4.1.5. Competitive Rivalry
- 4.2. PESTEL analysis
- 4.3. BCG Analysis
- 4.3.1. Stars (High Growth, High Market Share)
- 4.3.2. Cash Cows (Low Growth, High Market Share)
- 4.3.3. Question Mark (High Growth, Low Market Share)
- 4.3.4. Dogs (Low Growth, Low Market Share)
- 4.4. Ansoff Matrix Analysis
- 4.5. Supply Chain Analysis
- 4.6. Regulatory Landscape
- 4.7. Current Market Potential and Opportunity Assessment (TAM–SAM–SOM Framework)
- 4.8. VDR Analyst Note
- 4.1. Porters Five Forces
- 5. Market Analysis, Insights and Forecast 2021-2033
- 5.1. Market Analysis, Insights and Forecast - by Type
- 5.1.1. Starch-based Plastics
- 5.1.2. Poly Lactic Acid (PLA)
- 5.1.3. PolyHydroxy Alkanoates (PHA)
- 5.1.4. Polyesters (PBS, PBAT, and PCL)
- 5.1.5. Cellulose Derivatives
- 5.2. Market Analysis, Insights and Forecast - by Application
- 5.2.1. Agriculture
- 5.2.2. Textile
- 5.2.3. Electronics
- 5.2.4. Packaging
- 5.2.5. Healthcare
- 5.2.6. Other Applications
- 5.3. Market Analysis, Insights and Forecast - by Region
- 5.3.1. Asia Pacific
- 5.3.2. North America
- 5.3.3. Europe
- 5.3.4. Rest of World
- 5.1. Market Analysis, Insights and Forecast - by Type
- 6. Global Bio-based Polymers Market Analysis, Insights and Forecast, 2021-2033
- 6.1. Market Analysis, Insights and Forecast - by Type
- 6.1.1. Starch-based Plastics
- 6.1.2. Poly Lactic Acid (PLA)
- 6.1.3. PolyHydroxy Alkanoates (PHA)
- 6.1.4. Polyesters (PBS, PBAT, and PCL)
- 6.1.5. Cellulose Derivatives
- 6.2. Market Analysis, Insights and Forecast - by Application
- 6.2.1. Agriculture
- 6.2.2. Textile
- 6.2.3. Electronics
- 6.2.4. Packaging
- 6.2.5. Healthcare
- 6.2.6. Other Applications
- 6.1. Market Analysis, Insights and Forecast - by Type
- 7. Asia Pacific Bio-based Polymers Market Analysis, Insights and Forecast, 2021-2033
- 7.1. Market Analysis, Insights and Forecast - by Type
- 7.1.1. Starch-based Plastics
- 7.1.2. Poly Lactic Acid (PLA)
- 7.1.3. PolyHydroxy Alkanoates (PHA)
- 7.1.4. Polyesters (PBS, PBAT, and PCL)
- 7.1.5. Cellulose Derivatives
- 7.2. Market Analysis, Insights and Forecast - by Application
- 7.2.1. Agriculture
- 7.2.2. Textile
- 7.2.3. Electronics
- 7.2.4. Packaging
- 7.2.5. Healthcare
- 7.2.6. Other Applications
- 7.1. Market Analysis, Insights and Forecast - by Type
- 8. North America Bio-based Polymers Market Analysis, Insights and Forecast, 2021-2033
- 8.1. Market Analysis, Insights and Forecast - by Type
- 8.1.1. Starch-based Plastics
- 8.1.2. Poly Lactic Acid (PLA)
- 8.1.3. PolyHydroxy Alkanoates (PHA)
- 8.1.4. Polyesters (PBS, PBAT, and PCL)
- 8.1.5. Cellulose Derivatives
- 8.2. Market Analysis, Insights and Forecast - by Application
- 8.2.1. Agriculture
- 8.2.2. Textile
- 8.2.3. Electronics
- 8.2.4. Packaging
- 8.2.5. Healthcare
- 8.2.6. Other Applications
- 8.1. Market Analysis, Insights and Forecast - by Type
- 9. Europe Bio-based Polymers Market Analysis, Insights and Forecast, 2021-2033
- 9.1. Market Analysis, Insights and Forecast - by Type
- 9.1.1. Starch-based Plastics
- 9.1.2. Poly Lactic Acid (PLA)
- 9.1.3. PolyHydroxy Alkanoates (PHA)
- 9.1.4. Polyesters (PBS, PBAT, and PCL)
- 9.1.5. Cellulose Derivatives
- 9.2. Market Analysis, Insights and Forecast - by Application
- 9.2.1. Agriculture
- 9.2.2. Textile
- 9.2.3. Electronics
- 9.2.4. Packaging
- 9.2.5. Healthcare
- 9.2.6. Other Applications
- 9.1. Market Analysis, Insights and Forecast - by Type
- 10. Rest of World Bio-based Polymers Market Analysis, Insights and Forecast, 2021-2033
- 10.1. Market Analysis, Insights and Forecast - by Type
- 10.1.1. Starch-based Plastics
- 10.1.2. Poly Lactic Acid (PLA)
- 10.1.3. PolyHydroxy Alkanoates (PHA)
- 10.1.4. Polyesters (PBS, PBAT, and PCL)
- 10.1.5. Cellulose Derivatives
- 10.2. Market Analysis, Insights and Forecast - by Application
- 10.2.1. Agriculture
- 10.2.2. Textile
- 10.2.3. Electronics
- 10.2.4. Packaging
- 10.2.5. Healthcare
- 10.2.6. Other Applications
- 10.1. Market Analysis, Insights and Forecast - by Type
- 11. Competitive Analysis
- 11.1. Company Profiles
- 11.1.1 Novamont SpA
- 11.1.1.1. Company Overview
- 11.1.1.2. Products
- 11.1.1.3. Company Financials
- 11.1.1.4. SWOT Analysis
- 11.1.2 FP International
- 11.1.2.1. Company Overview
- 11.1.2.2. Products
- 11.1.2.3. Company Financials
- 11.1.2.4. SWOT Analysis
- 11.1.3 Innovia Films
- 11.1.3.1. Company Overview
- 11.1.3.2. Products
- 11.1.3.3. Company Financials
- 11.1.3.4. SWOT Analysis
- 11.1.4 YIELD10 BIOSCIENCE INC (Metabolix Inc )
- 11.1.4.1. Company Overview
- 11.1.4.2. Products
- 11.1.4.3. Company Financials
- 11.1.4.4. SWOT Analysis
- 11.1.5 FKuR
- 11.1.5.1. Company Overview
- 11.1.5.2. Products
- 11.1.5.3. Company Financials
- 11.1.5.4. SWOT Analysis
- 11.1.6 Merck KGaA
- 11.1.6.1. Company Overview
- 11.1.6.2. Products
- 11.1.6.3. Company Financials
- 11.1.6.4. SWOT Analysis
- 11.1.7 Cardia Bioplastics
- 11.1.7.1. Company Overview
- 11.1.7.2. Products
- 11.1.7.3. Company Financials
- 11.1.7.4. SWOT Analysis
- 11.1.8 Rodenburg Biopolymers
- 11.1.8.1. Company Overview
- 11.1.8.2. Products
- 11.1.8.3. Company Financials
- 11.1.8.4. SWOT Analysis
- 11.1.9 Covestro AG
- 11.1.9.1. Company Overview
- 11.1.9.2. Products
- 11.1.9.3. Company Financials
- 11.1.9.4. SWOT Analysis
- 11.1.10 NatureWorks LLC
- 11.1.10.1. Company Overview
- 11.1.10.2. Products
- 11.1.10.3. Company Financials
- 11.1.10.4. SWOT Analysis
- 11.1.11 thyssenkrupp AG*List Not Exhaustive
- 11.1.11.1. Company Overview
- 11.1.11.2. Products
- 11.1.11.3. Company Financials
- 11.1.11.4. SWOT Analysis
- 11.1.12 DuPont de Nemours Inc
- 11.1.12.1. Company Overview
- 11.1.12.2. Products
- 11.1.12.3. Company Financials
- 11.1.12.4. SWOT Analysis
- 11.1.13 Biologische Naturverpackungen GmbH & Co KG
- 11.1.13.1. Company Overview
- 11.1.13.2. Products
- 11.1.13.3. Company Financials
- 11.1.13.4. SWOT Analysis
- 11.1.14 Corbion
- 11.1.14.1. Company Overview
- 11.1.14.2. Products
- 11.1.14.3. Company Financials
- 11.1.14.4. SWOT Analysis
- 11.1.15 Cortec Group Management Services LLC
- 11.1.15.1. Company Overview
- 11.1.15.2. Products
- 11.1.15.3. Company Financials
- 11.1.15.4. SWOT Analysis
- 11.1.16 SHOWA DENKO K K
- 11.1.16.1. Company Overview
- 11.1.16.2. Products
- 11.1.16.3. Company Financials
- 11.1.16.4. SWOT Analysis
- 11.1.17 BASF SE
- 11.1.17.1. Company Overview
- 11.1.17.2. Products
- 11.1.17.3. Company Financials
- 11.1.17.4. SWOT Analysis
- 11.1.1 Novamont SpA
- 11.2. Market Entropy
- 11.2.1 Company's Key Areas Served
- 11.2.2 Recent Developments
- 11.3. Company Market Share Analysis 2025
- 11.3.1 Top 5 Companies Market Share Analysis
- 11.3.2 Top 3 Companies Market Share Analysis
- 11.4. List of Potential Customers
- 12. Research Methodology
List of Figures
- Figure 1: Global Bio-based Polymers Market Revenue Breakdown (Million, %) by Region 2025 & 2033
- Figure 2: Global Bio-based Polymers Market Volume Breakdown (Million, %) by Region 2025 & 2033
- Figure 3: Asia Pacific Bio-based Polymers Market Revenue (Million), by Type 2025 & 2033
- Figure 4: Asia Pacific Bio-based Polymers Market Volume (Million), by Type 2025 & 2033
- Figure 5: Asia Pacific Bio-based Polymers Market Revenue Share (%), by Type 2025 & 2033
- Figure 6: Asia Pacific Bio-based Polymers Market Volume Share (%), by Type 2025 & 2033
- Figure 7: Asia Pacific Bio-based Polymers Market Revenue (Million), by Application 2025 & 2033
- Figure 8: Asia Pacific Bio-based Polymers Market Volume (Million), by Application 2025 & 2033
- Figure 9: Asia Pacific Bio-based Polymers Market Revenue Share (%), by Application 2025 & 2033
- Figure 10: Asia Pacific Bio-based Polymers Market Volume Share (%), by Application 2025 & 2033
- Figure 11: Asia Pacific Bio-based Polymers Market Revenue (Million), by Country 2025 & 2033
- Figure 12: Asia Pacific Bio-based Polymers Market Volume (Million), by Country 2025 & 2033
- Figure 13: Asia Pacific Bio-based Polymers Market Revenue Share (%), by Country 2025 & 2033
- Figure 14: Asia Pacific Bio-based Polymers Market Volume Share (%), by Country 2025 & 2033
- Figure 15: North America Bio-based Polymers Market Revenue (Million), by Type 2025 & 2033
- Figure 16: North America Bio-based Polymers Market Volume (Million), by Type 2025 & 2033
- Figure 17: North America Bio-based Polymers Market Revenue Share (%), by Type 2025 & 2033
- Figure 18: North America Bio-based Polymers Market Volume Share (%), by Type 2025 & 2033
- Figure 19: North America Bio-based Polymers Market Revenue (Million), by Application 2025 & 2033
- Figure 20: North America Bio-based Polymers Market Volume (Million), by Application 2025 & 2033
- Figure 21: North America Bio-based Polymers Market Revenue Share (%), by Application 2025 & 2033
- Figure 22: North America Bio-based Polymers Market Volume Share (%), by Application 2025 & 2033
- Figure 23: North America Bio-based Polymers Market Revenue (Million), by Country 2025 & 2033
- Figure 24: North America Bio-based Polymers Market Volume (Million), by Country 2025 & 2033
- Figure 25: North America Bio-based Polymers Market Revenue Share (%), by Country 2025 & 2033
- Figure 26: North America Bio-based Polymers Market Volume Share (%), by Country 2025 & 2033
- Figure 27: Europe Bio-based Polymers Market Revenue (Million), by Type 2025 & 2033
- Figure 28: Europe Bio-based Polymers Market Volume (Million), by Type 2025 & 2033
- Figure 29: Europe Bio-based Polymers Market Revenue Share (%), by Type 2025 & 2033
- Figure 30: Europe Bio-based Polymers Market Volume Share (%), by Type 2025 & 2033
- Figure 31: Europe Bio-based Polymers Market Revenue (Million), by Application 2025 & 2033
- Figure 32: Europe Bio-based Polymers Market Volume (Million), by Application 2025 & 2033
- Figure 33: Europe Bio-based Polymers Market Revenue Share (%), by Application 2025 & 2033
- Figure 34: Europe Bio-based Polymers Market Volume Share (%), by Application 2025 & 2033
- Figure 35: Europe Bio-based Polymers Market Revenue (Million), by Country 2025 & 2033
- Figure 36: Europe Bio-based Polymers Market Volume (Million), by Country 2025 & 2033
- Figure 37: Europe Bio-based Polymers Market Revenue Share (%), by Country 2025 & 2033
- Figure 38: Europe Bio-based Polymers Market Volume Share (%), by Country 2025 & 2033
- Figure 39: Rest of World Bio-based Polymers Market Revenue (Million), by Type 2025 & 2033
- Figure 40: Rest of World Bio-based Polymers Market Volume (Million), by Type 2025 & 2033
- Figure 41: Rest of World Bio-based Polymers Market Revenue Share (%), by Type 2025 & 2033
- Figure 42: Rest of World Bio-based Polymers Market Volume Share (%), by Type 2025 & 2033
- Figure 43: Rest of World Bio-based Polymers Market Revenue (Million), by Application 2025 & 2033
- Figure 44: Rest of World Bio-based Polymers Market Volume (Million), by Application 2025 & 2033
- Figure 45: Rest of World Bio-based Polymers Market Revenue Share (%), by Application 2025 & 2033
- Figure 46: Rest of World Bio-based Polymers Market Volume Share (%), by Application 2025 & 2033
- Figure 47: Rest of World Bio-based Polymers Market Revenue (Million), by Country 2025 & 2033
- Figure 48: Rest of World Bio-based Polymers Market Volume (Million), by Country 2025 & 2033
- Figure 49: Rest of World Bio-based Polymers Market Revenue Share (%), by Country 2025 & 2033
- Figure 50: Rest of World Bio-based Polymers Market Volume Share (%), by Country 2025 & 2033
List of Tables
- Table 1: Global Bio-based Polymers Market Revenue Million Forecast, by Type 2020 & 2033
- Table 2: Global Bio-based Polymers Market Volume Million Forecast, by Type 2020 & 2033
- Table 3: Global Bio-based Polymers Market Revenue Million Forecast, by Application 2020 & 2033
- Table 4: Global Bio-based Polymers Market Volume Million Forecast, by Application 2020 & 2033
- Table 5: Global Bio-based Polymers Market Revenue Million Forecast, by Region 2020 & 2033
- Table 6: Global Bio-based Polymers Market Volume Million Forecast, by Region 2020 & 2033
- Table 7: Global Bio-based Polymers Market Revenue Million Forecast, by Type 2020 & 2033
- Table 8: Global Bio-based Polymers Market Volume Million Forecast, by Type 2020 & 2033
- Table 9: Global Bio-based Polymers Market Revenue Million Forecast, by Application 2020 & 2033
- Table 10: Global Bio-based Polymers Market Volume Million Forecast, by Application 2020 & 2033
- Table 11: Global Bio-based Polymers Market Revenue Million Forecast, by Country 2020 & 2033
- Table 12: Global Bio-based Polymers Market Volume Million Forecast, by Country 2020 & 2033
- Table 13: China Bio-based Polymers Market Revenue (Million) Forecast, by Application 2020 & 2033
- Table 14: China Bio-based Polymers Market Volume (Million) Forecast, by Application 2020 & 2033
- Table 15: India Bio-based Polymers Market Revenue (Million) Forecast, by Application 2020 & 2033
- Table 16: India Bio-based Polymers Market Volume (Million) Forecast, by Application 2020 & 2033
- Table 17: Japan Bio-based Polymers Market Revenue (Million) Forecast, by Application 2020 & 2033
- Table 18: Japan Bio-based Polymers Market Volume (Million) Forecast, by Application 2020 & 2033
- Table 19: South Korea Bio-based Polymers Market Revenue (Million) Forecast, by Application 2020 & 2033
- Table 20: South Korea Bio-based Polymers Market Volume (Million) Forecast, by Application 2020 & 2033
- Table 21: Rest of Asia Pacific Bio-based Polymers Market Revenue (Million) Forecast, by Application 2020 & 2033
- Table 22: Rest of Asia Pacific Bio-based Polymers Market Volume (Million) Forecast, by Application 2020 & 2033
- Table 23: Global Bio-based Polymers Market Revenue Million Forecast, by Type 2020 & 2033
- Table 24: Global Bio-based Polymers Market Volume Million Forecast, by Type 2020 & 2033
- Table 25: Global Bio-based Polymers Market Revenue Million Forecast, by Application 2020 & 2033
- Table 26: Global Bio-based Polymers Market Volume Million Forecast, by Application 2020 & 2033
- Table 27: Global Bio-based Polymers Market Revenue Million Forecast, by Country 2020 & 2033
- Table 28: Global Bio-based Polymers Market Volume Million Forecast, by Country 2020 & 2033
- Table 29: United States Bio-based Polymers Market Revenue (Million) Forecast, by Application 2020 & 2033
- Table 30: United States Bio-based Polymers Market Volume (Million) Forecast, by Application 2020 & 2033
- Table 31: Canada Bio-based Polymers Market Revenue (Million) Forecast, by Application 2020 & 2033
- Table 32: Canada Bio-based Polymers Market Volume (Million) Forecast, by Application 2020 & 2033
- Table 33: Mexico Bio-based Polymers Market Revenue (Million) Forecast, by Application 2020 & 2033
- Table 34: Mexico Bio-based Polymers Market Volume (Million) Forecast, by Application 2020 & 2033
- Table 35: Global Bio-based Polymers Market Revenue Million Forecast, by Type 2020 & 2033
- Table 36: Global Bio-based Polymers Market Volume Million Forecast, by Type 2020 & 2033
- Table 37: Global Bio-based Polymers Market Revenue Million Forecast, by Application 2020 & 2033
- Table 38: Global Bio-based Polymers Market Volume Million Forecast, by Application 2020 & 2033
- Table 39: Global Bio-based Polymers Market Revenue Million Forecast, by Country 2020 & 2033
- Table 40: Global Bio-based Polymers Market Volume Million Forecast, by Country 2020 & 2033
- Table 41: Germany Bio-based Polymers Market Revenue (Million) Forecast, by Application 2020 & 2033
- Table 42: Germany Bio-based Polymers Market Volume (Million) Forecast, by Application 2020 & 2033
- Table 43: United Kingdom Bio-based Polymers Market Revenue (Million) Forecast, by Application 2020 & 2033
- Table 44: United Kingdom Bio-based Polymers Market Volume (Million) Forecast, by Application 2020 & 2033
- Table 45: Italy Bio-based Polymers Market Revenue (Million) Forecast, by Application 2020 & 2033
- Table 46: Italy Bio-based Polymers Market Volume (Million) Forecast, by Application 2020 & 2033
- Table 47: France Bio-based Polymers Market Revenue (Million) Forecast, by Application 2020 & 2033
- Table 48: France Bio-based Polymers Market Volume (Million) Forecast, by Application 2020 & 2033
- Table 49: Rest of Europe Bio-based Polymers Market Revenue (Million) Forecast, by Application 2020 & 2033
- Table 50: Rest of Europe Bio-based Polymers Market Volume (Million) Forecast, by Application 2020 & 2033
- Table 51: Global Bio-based Polymers Market Revenue Million Forecast, by Type 2020 & 2033
- Table 52: Global Bio-based Polymers Market Volume Million Forecast, by Type 2020 & 2033
- Table 53: Global Bio-based Polymers Market Revenue Million Forecast, by Application 2020 & 2033
- Table 54: Global Bio-based Polymers Market Volume Million Forecast, by Application 2020 & 2033
- Table 55: Global Bio-based Polymers Market Revenue Million Forecast, by Country 2020 & 2033
- Table 56: Global Bio-based Polymers Market Volume Million Forecast, by Country 2020 & 2033
- Table 57: Brazil Bio-based Polymers Market Revenue (Million) Forecast, by Application 2020 & 2033
- Table 58: Brazil Bio-based Polymers Market Volume (Million) Forecast, by Application 2020 & 2033
- Table 59: Saudi Arabia Bio-based Polymers Market Revenue (Million) Forecast, by Application 2020 & 2033
- Table 60: Saudi Arabia Bio-based Polymers Market Volume (Million) Forecast, by Application 2020 & 2033
- Table 61: Rest of the World Bio-based Polymers Market Revenue (Million) Forecast, by Application 2020 & 2033
- Table 62: Rest of the World Bio-based Polymers Market Volume (Million) Forecast, by Application 2020 & 2033
Frequently Asked Questions
1. What is the projected Compound Annual Growth Rate (CAGR) of the Bio-based Polymers Market?
The projected CAGR is approximately 24.30%.
2. Which companies are prominent players in the Bio-based Polymers Market?
Key companies in the market include Novamont SpA, FP International, Innovia Films, YIELD10 BIOSCIENCE INC (Metabolix Inc ), FKuR, Merck KGaA, Cardia Bioplastics, Rodenburg Biopolymers, Covestro AG, NatureWorks LLC, thyssenkrupp AG*List Not Exhaustive, DuPont de Nemours Inc, Biologische Naturverpackungen GmbH & Co KG, Corbion, Cortec Group Management Services LLC, SHOWA DENKO K K, BASF SE.
3. What are the main segments of the Bio-based Polymers Market?
The market segments include Type, Application.
4. Can you provide details about the market size?
The market size is estimated to be USD XX Million as of 2022.
5. What are some drivers contributing to market growth?
Preference toward Eco-friendly Polymers to Preserve Environment; Regulation on Non-degradable Polymers in Many Countries; Increasing Consumer Awareness in Developed and Developing Nations; Non-toxic Nature of Biodegradable Polymers.
6. What are the notable trends driving market growth?
Increasing Demand from Packaging Industry.
7. Are there any restraints impacting market growth?
Higher Price Compared to Petroleum-based polymers; Low Awareness in Low Income Countries.
8. Can you provide examples of recent developments in the market?
N/A
9. What pricing options are available for accessing the report?
Pricing options include single-user, multi-user, and enterprise licenses priced at USD 4750, USD 5250, and USD 8750 respectively.
10. Is the market size provided in terms of value or volume?
The market size is provided in terms of value, measured in Million and volume, measured in Million.
11. Are there any specific market keywords associated with the report?
Yes, the market keyword associated with the report is "Bio-based Polymers Market," which aids in identifying and referencing the specific market segment covered.
12. How do I determine which pricing option suits my needs best?
The pricing options vary based on user requirements and access needs. Individual users may opt for single-user licenses, while businesses requiring broader access may choose multi-user or enterprise licenses for cost-effective access to the report.
13. Are there any additional resources or data provided in the Bio-based Polymers Market report?
While the report offers comprehensive insights, it's advisable to review the specific contents or supplementary materials provided to ascertain if additional resources or data are available.
14. How can I stay updated on further developments or reports in the Bio-based Polymers Market?
To stay informed about further developments, trends, and reports in the Bio-based Polymers Market, consider subscribing to industry newsletters, following relevant companies and organizations, or regularly checking reputable industry news sources and publications.
Methodology
Step 1 - Identification of Relevant Samples Size from Population Database


Step 2 - Approaches for Defining Global Market Size (Value, Volume* & Price*)

Note*: In applicable scenarios
Step 3 - Data Sources
Primary Research
- Web Analytics
- Survey Reports
- Research Institute
- Latest Research Reports
- Opinion Leaders
Secondary Research
- Annual Reports
- White Paper
- Latest Press Release
- Industry Association
- Paid Database
- Investor Presentations

Step 4 - Data Triangulation
Involves using different sources of information in order to increase the validity of a study
These sources are likely to be stakeholders in a program - participants, other researchers, program staff, other community members, and so on.
Then we put all data in single framework & apply various statistical tools to find out the dynamic on the market.
During the analysis stage, feedback from the stakeholder groups would be compared to determine areas of agreement as well as areas of divergence