

Key Insights
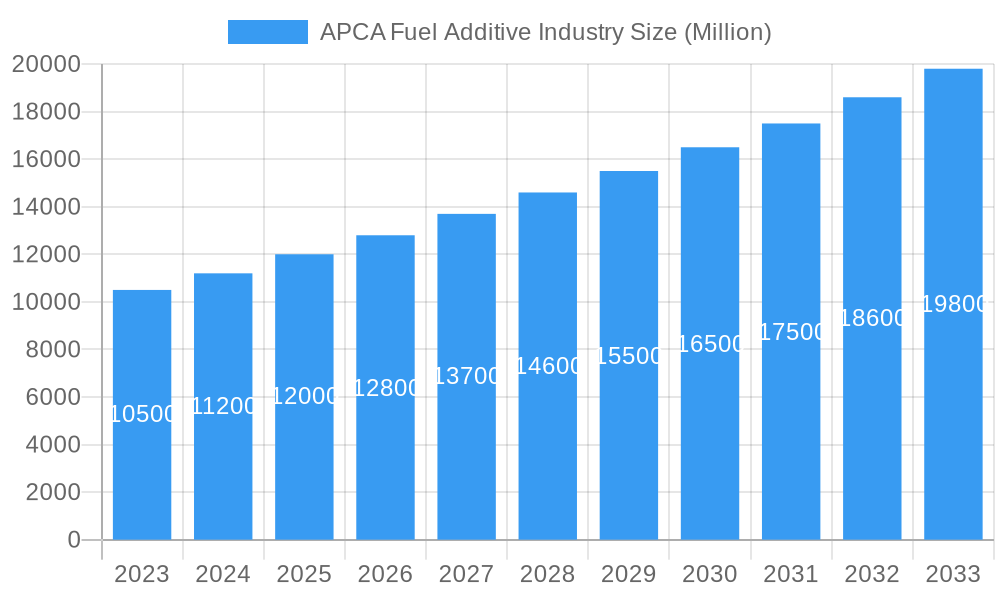
The Asia-Pacific (APCA) Fuel Additive Market is projected for significant expansion, estimated to reach over USD 15,000 million by 2033. This growth trajectory is driven by a robust Compound Annual Growth Rate (CAGR) exceeding 6.50%. Key growth catalysts include rising transportation demands and increasingly stringent environmental regulations promoting fuel efficiency and emission reduction across the region. The imperative for cleaner, more efficient fuels stimulates innovation and adoption of advanced additive technologies, such as deposit control and cetane improvers, which enhance engine performance and durability. Furthermore, the escalating emphasis on lubricant quality and environmental sustainability is boosting the demand for lubricity additives and antioxidants, thereby substantially contributing to market value. Emerging economies, particularly China and India, are at the forefront of this expansion due to their rapidly developing automotive and industrial sectors.
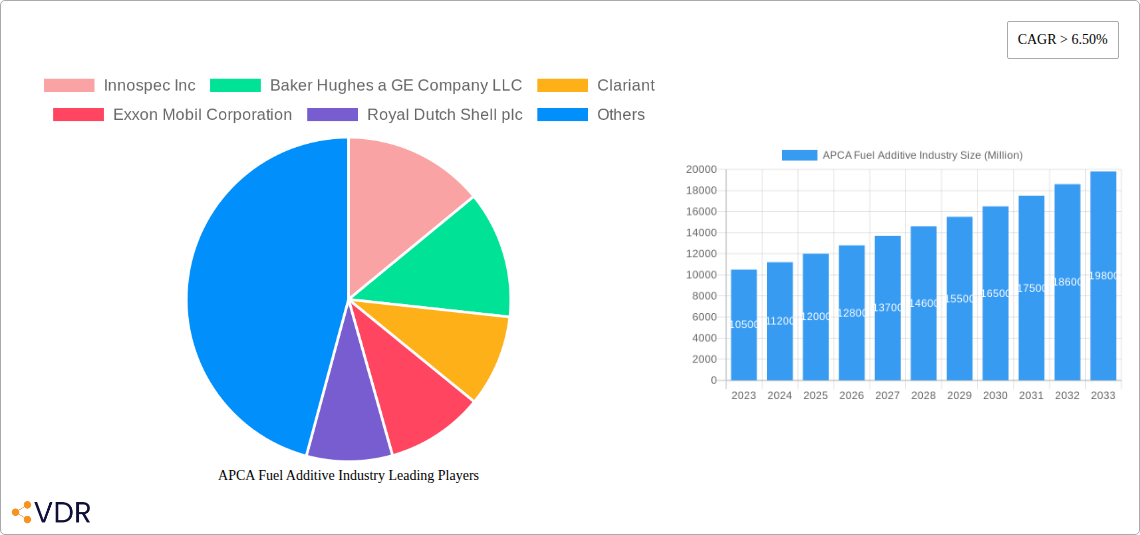
APCA Fuel Additive Industry Market Size (In Million)
Primary market drivers encompass the escalating demand for premium fuels, necessitated by evolving engine technologies requiring superior additive performance. The drive towards compliance with stringent environmental mandates, including Euro VI and BS VI emission standards, compels refiners and fuel manufacturers to integrate high-performance additives. While these favorable trends propel market growth, challenges such as volatile crude oil prices impacting fuel demand and additive costs, alongside the increasing adoption of electric vehicles (EVs) in certain segments, warrant consideration. Nevertheless, traditional internal combustion engine vehicles are anticipated to maintain dominance in the APCA region for the foreseeable future. The broad spectrum of applications, including diesel, gasoline, and jet fuel, ensures a wide market base, with substantial growth prospects identified in developing economies within the Rest of Asia-Pacific.
APCA Fuel Additive Industry Company Market Share
Comprehensive APCA Fuel Additive Industry Report: Market Dynamics, Growth Trends, and Regional Dominance (2019-2033)
This in-depth market research report provides a comprehensive analysis of the APCA Fuel Additive Industry, covering market dynamics, growth trends, regional insights, product landscape, key players, and future outlook. With a study period spanning from 2019 to 2033, including historical data, a base year of 2025, an estimated year of 2025, and a forecast period from 2025 to 2033, this report is designed to equip industry professionals with actionable intelligence for strategic decision-making. We integrate high-traffic keywords such as "fuel additives market," "diesel additives," "gasoline additives," "engine performance additives," "emissions reduction," and "Asia-Pacific fuel additives" to ensure maximum SEO visibility. The report meticulously dissects parent and child market segments, offering unparalleled insight into market structure and opportunities. All values are presented in Million units for clarity and ease of understanding.
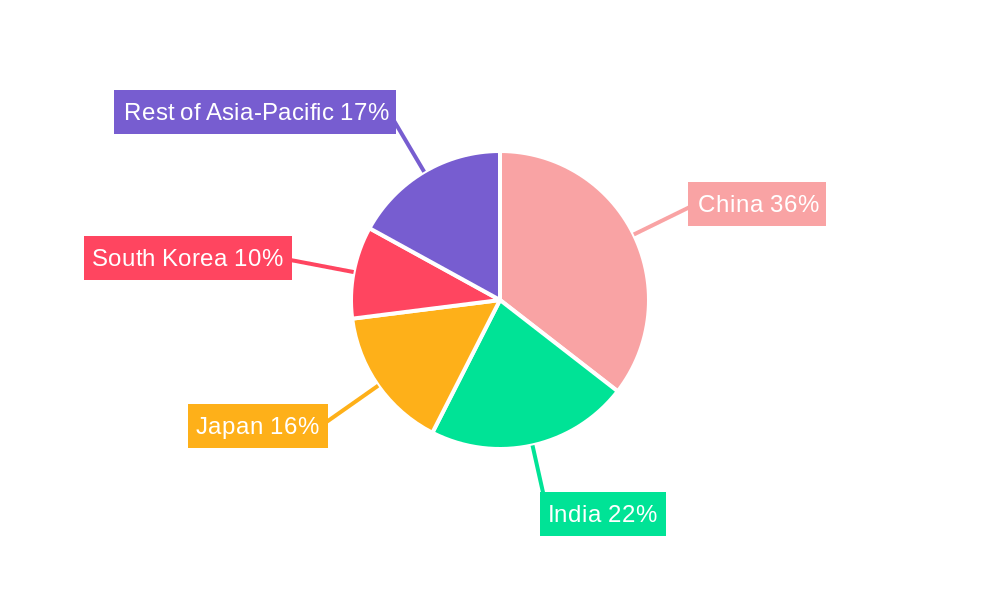
APCA Fuel Additive Industry Regional Market Share
APCA Fuel Additive Industry Market Dynamics & Structure
The APCA Fuel Additive Industry is characterized by a moderately concentrated market, with leading players investing heavily in research and development to drive technological innovation. Key drivers include increasingly stringent environmental regulations aimed at reducing emissions and improving fuel efficiency, pushing demand for advanced additive formulations. The regulatory framework, particularly in China and India, plays a pivotal role in shaping market growth through emissions standards and fuel quality mandates. Competitive product substitutes are relatively limited due to the specialized nature of fuel additives, but manufacturers continuously strive for enhanced performance and cost-effectiveness. End-user demographics are diverse, spanning individual vehicle owners, fleet operators, and industrial consumers across the automotive, aviation, and marine sectors. Mergers and acquisitions (M&A) trends are observed as larger companies seek to consolidate market share and expand their product portfolios. For instance, the past five years have witnessed an average of 3-5 significant M&A deals annually, with an estimated aggregate deal volume of over $500 Million. Barriers to innovation include the high cost of R&D, long product development cycles, and the need for extensive field testing and regulatory approvals.
- Market Concentration: Moderate, with key players holding significant market shares.
- Technological Innovation Drivers: Emission control mandates, fuel efficiency improvements, engine longevity enhancement.
- Regulatory Frameworks: Stringent emission standards (e.g., Euro VI, BS VI), fuel quality specifications, government incentives for cleaner fuels.
- Competitive Product Substitutes: Limited, focus on additive performance and specialization.
- End-User Demographics: Automotive (passenger cars, commercial vehicles), aviation, marine, industrial machinery.
- M&A Trends: Strategic acquisitions to expand product lines and market reach, consolidation of smaller players.
APCA Fuel Additive Industry Growth Trends & Insights
The APCA Fuel Additive Industry is poised for substantial growth, projected to witness a Compound Annual Growth Rate (CAGR) of approximately 5.2% during the forecast period. This upward trajectory is fueled by a confluence of factors, including the increasing global demand for cleaner and more efficient fuels, coupled with evolving automotive and industrial technologies. The adoption rates of fuel additives are steadily rising as consumers and industries become more aware of their benefits, ranging from improved engine performance and reduced maintenance costs to enhanced fuel economy and minimized environmental impact. Technological disruptions, such as the development of advanced multifunctional additives and bio-based fuel additives, are further stimulating market expansion. Consumer behavior shifts are also playing a crucial role, with a growing preference for premium fuels and additives that offer superior protection and performance. The market penetration of sophisticated fuel additives is expected to climb from an estimated 35% in 2025 to over 50% by 2033, particularly in emerging economies where vehicle parc is rapidly expanding. The increasing focus on reducing greenhouse gas emissions and improving air quality globally acts as a significant impetus for the adoption of fuel additives that aid in combustion efficiency and cleaner exhaust. Furthermore, the growing demand for lubricants and the inherent need for their additive components to enhance performance under extreme conditions contribute to market expansion. The evolution of engine technology, necessitating more specialized fuel formulations, also drives innovation and market growth.
Dominant Regions, Countries, or Segments in APCA Fuel Additive Industry
Within the APCA Fuel Additive Industry, China emerges as the dominant region, driven by its massive automotive market, burgeoning industrial sector, and proactive government policies aimed at improving fuel quality and reducing emissions. The Diesel application segment, particularly in commercial transportation and heavy-duty machinery, commands a significant market share, propelled by the extensive use of diesel engines across the region. Deposit Control Additives are expected to be a leading product type, addressing the increasing concerns about engine cleanliness and fuel efficiency in a rapidly growing vehicle parc.
- Geographic Dominance: China leads due to its vast industrial base and automotive market.
- Application Dominance: Diesel fuel application, driven by commercial vehicles and industrial machinery.
- Product Type Dominance: Deposit Control Additives, crucial for maintaining engine performance and fuel economy.
Key drivers for China's dominance include:
- Economic Policies: Government initiatives promoting cleaner energy and stricter emissions standards (e.g., China VI).
- Infrastructure Development: Significant investments in transportation infrastructure, leading to increased fuel consumption.
- Rapid Industrialization: Growing demand for fuel additives in heavy industries, manufacturing, and power generation.
- Automotive Growth: One of the world's largest automotive markets, with a substantial and growing vehicle fleet.
- Technological Adoption: Increasing uptake of advanced fuel additives to meet performance and environmental requirements.
The Rest of Asia-Pacific region, encompassing countries like India, Indonesia, and Thailand, also presents substantial growth potential, fueled by expanding economies, increasing disposable incomes, and a growing middle class driving automotive sales.
APCA Fuel Additive Industry Product Landscape
The product landscape of the APCA Fuel Additive Industry is characterized by continuous innovation aimed at enhancing fuel performance, engine longevity, and environmental compliance. Key product types include Deposit Control Additives, which prevent and remove harmful engine deposits for optimal performance; Cetane Improvers, crucial for improving diesel fuel ignition quality; Lubricity Additives, essential for protecting fuel systems from wear, especially in low-sulfur fuels; Antioxidants, preventing fuel degradation and gum formation; Anticorrosion additives, safeguarding fuel tanks and lines from rust; Cold Flow Improvers, critical for maintaining fuel fluidity in low temperatures; and Antiknock Agents, used in gasoline to prevent engine knocking. These additives are formulated for diverse applications, including Diesel, Gasoline, and Jet Fuel. Unique selling propositions often revolve around multifunctional additives offering a combination of benefits, enhanced biodegradability, and compliance with the latest environmental regulations. Technological advancements are focused on developing more effective and sustainable additive chemistries.
Key Drivers, Barriers & Challenges in APCA Fuel Additive Industry
Key Drivers:
- Stringent Environmental Regulations: Increasing global pressure to reduce emissions and improve fuel efficiency drives demand for advanced additives.
- Growing Automotive Parc: Expansion of vehicle ownership, particularly in emerging economies, directly translates to higher fuel consumption and additive usage.
- Demand for Enhanced Performance: Consumers and industries seek improved engine performance, fuel economy, and reduced maintenance costs.
- Technological Advancements: Development of innovative additive formulations with multifunctional capabilities.
Key Barriers & Challenges:
- High R&D Costs: Developing and testing new additive formulations require significant investment.
- Regulatory Hurdles: Navigating complex and evolving environmental regulations across different regions can be challenging.
- Supply Chain Disruptions: Geopolitical factors and raw material availability can impact production and pricing.
- Price Sensitivity: While performance is key, price remains a crucial factor for many consumers, especially in price-sensitive markets.
- Competition from Alternative Fuels: The long-term shift towards electric vehicles poses a potential challenge to traditional fuel additive markets.
Emerging Opportunities in APCA Fuel Additive Industry
Emerging opportunities in the APCA Fuel Additive Industry lie in the development of biodegradable and eco-friendly fuel additives, catering to the growing demand for sustainable solutions. The untapped potential in off-road and industrial applications, such as agricultural machinery and heavy-duty construction equipment, presents a significant growth avenue. Furthermore, the development of smart additives that can monitor and adapt to engine conditions offers innovative application possibilities. Evolving consumer preferences for enhanced fuel performance and extended engine life will continue to drive demand for specialized, high-performance additive packages. The increasing adoption of biofuels also necessitates the development of compatible fuel additives to ensure optimal performance and stability.
Growth Accelerators in the APCA Fuel Additive Industry Industry
Catalysts driving long-term growth in the APCA Fuel Additive Industry include significant investments in technological breakthroughs, such as the development of advanced nano-additives and multifunctional formulations that offer superior performance and environmental benefits. Strategic partnerships and collaborations between additive manufacturers and fuel producers or automotive OEMs are crucial for co-developing tailored solutions and expanding market reach. Furthermore, market expansion strategies focusing on emerging economies with rapidly growing automotive sectors and increasing fuel consumption will accelerate overall industry growth. The continuous evolution of engine technologies also necessitates the development of new and improved fuel additives, creating a sustained demand for innovation.
Key Players Shaping the APCA Fuel Additive Industry Market
- Innospec Inc
- Baker Hughes a GE Company LLC
- Clariant
- Exxon Mobil Corporation
- Royal Dutch Shell plc
- Evonik Industries AG
- LANXESS
- Croda International Plc
- BASF SE
- Chevron Corporation
- The Lubrizol Corporation
- Dorfketal Chemicals (I) Pvt Ltd
- Eni SpA
- Total
- Afton Chemical
Notable Milestones in APCA Fuel Additive Industry Sector
- 2019: Introduction of new generation deposit control additives by major players, offering enhanced cleaning capabilities for modern engines.
- 2020: Increased focus on R&D for bio-based fuel additives due to growing environmental concerns.
- 2021: Several key players expand their production capacities in the Asia-Pacific region to meet rising demand.
- 2022: Launch of multifunctional fuel additives combining lubrication, cleaning, and anticorrosion properties.
- 2023: Advancements in cold flow improvers to enhance the performance of diesel fuels in extreme weather conditions.
- 2024: Growing interest and investment in additives for synthetic fuels and alternative energy sources.
In-Depth APCA Fuel Additive Industry Market Outlook
The future outlook for the APCA Fuel Additive Industry is exceptionally positive, driven by a confluence of accelerating factors. Continued stringent emission regulations worldwide will undoubtedly push for the development and adoption of more sophisticated and environmentally friendly fuel additives. The expanding global vehicle parc, particularly in emerging markets, will sustain demand for fuel additives that improve engine efficiency and longevity. Innovations in additive chemistry, including multifunctional and bio-based formulations, will unlock new market segments and enhance product value propositions. Strategic collaborations and market expansion into high-growth regions will be key for sustained success. The industry is well-positioned to benefit from the ongoing need for optimizing existing internal combustion engine technologies while simultaneously exploring solutions for future alternative fuel landscapes, ensuring robust and dynamic growth for years to come.
APCA Fuel Additive Industry Segmentation
-
1. Product Type
- 1.1. Deposit Control
- 1.2. Cetane Improvers
- 1.3. Lubricity Additives
- 1.4. Antioxidants
- 1.5. Anticorrosion
- 1.6. Cold Flow Improvers
- 1.7. Antiknock Agents
- 1.8. Other Product Types
-
2. Application
- 2.1. Diesel
- 2.2. Gasoline
- 2.3. Jet Fuel
- 2.4. Other Applications
-
3. Geography
- 3.1. China
- 3.2. India
- 3.3. Japan
- 3.4. South Korea
- 3.5. Rest of Asia-Pacific
APCA Fuel Additive Industry Segmentation By Geography
- 1. China
- 2. India
- 3. Japan
- 4. South Korea
- 5. Rest of Asia Pacific
APCA Fuel Additive Industry Regional Market Share
Geographic Coverage of APCA Fuel Additive Industry
APCA Fuel Additive Industry REPORT HIGHLIGHTS
| Aspects | Details |
|---|---|
| Study Period | 2020-2034 |
| Base Year | 2025 |
| Estimated Year | 2026 |
| Forecast Period | 2026-2034 |
| Historical Period | 2020-2025 |
| Growth Rate | CAGR of 4.5% from 2020-2034 |
| Segmentation |
|
Table of Contents
- 1. Introduction
- 1.1. Research Scope
- 1.2. Market Segmentation
- 1.3. Research Objective
- 1.4. Definitions and Assumptions
- 2. Executive Summary
- 2.1. Market Snapshot
- 3. Market Dynamics
- 3.1. Market Drivers
- 3.2. Market Restrains
- 3.3. Market Trends
- 3.4. Market Opportunities
- 4. Market Factor Analysis
- 4.1. Porters Five Forces
- 4.1.1. Bargaining Power of Suppliers
- 4.1.2. Bargaining Power of Buyers
- 4.1.3. Threat of New Entrants
- 4.1.4. Threat of Substitutes
- 4.1.5. Competitive Rivalry
- 4.2. PESTEL analysis
- 4.3. BCG Analysis
- 4.3.1. Stars (High Growth, High Market Share)
- 4.3.2. Cash Cows (Low Growth, High Market Share)
- 4.3.3. Question Mark (High Growth, Low Market Share)
- 4.3.4. Dogs (Low Growth, Low Market Share)
- 4.4. Ansoff Matrix Analysis
- 4.5. Supply Chain Analysis
- 4.6. Regulatory Landscape
- 4.7. Current Market Potential and Opportunity Assessment (TAM–SAM–SOM Framework)
- 4.8. VDR Analyst Note
- 4.1. Porters Five Forces
- 5. Market Analysis, Insights and Forecast 2021-2033
- 5.1. Market Analysis, Insights and Forecast - by Product Type
- 5.1.1. Deposit Control
- 5.1.2. Cetane Improvers
- 5.1.3. Lubricity Additives
- 5.1.4. Antioxidants
- 5.1.5. Anticorrosion
- 5.1.6. Cold Flow Improvers
- 5.1.7. Antiknock Agents
- 5.1.8. Other Product Types
- 5.2. Market Analysis, Insights and Forecast - by Application
- 5.2.1. Diesel
- 5.2.2. Gasoline
- 5.2.3. Jet Fuel
- 5.2.4. Other Applications
- 5.3. Market Analysis, Insights and Forecast - by Geography
- 5.3.1. China
- 5.3.2. India
- 5.3.3. Japan
- 5.3.4. South Korea
- 5.3.5. Rest of Asia-Pacific
- 5.4. Market Analysis, Insights and Forecast - by Region
- 5.4.1. China
- 5.4.2. India
- 5.4.3. Japan
- 5.4.4. South Korea
- 5.4.5. Rest of Asia Pacific
- 5.1. Market Analysis, Insights and Forecast - by Product Type
- 6. Global APCA Fuel Additive Industry Analysis, Insights and Forecast, 2021-2033
- 6.1. Market Analysis, Insights and Forecast - by Product Type
- 6.1.1. Deposit Control
- 6.1.2. Cetane Improvers
- 6.1.3. Lubricity Additives
- 6.1.4. Antioxidants
- 6.1.5. Anticorrosion
- 6.1.6. Cold Flow Improvers
- 6.1.7. Antiknock Agents
- 6.1.8. Other Product Types
- 6.2. Market Analysis, Insights and Forecast - by Application
- 6.2.1. Diesel
- 6.2.2. Gasoline
- 6.2.3. Jet Fuel
- 6.2.4. Other Applications
- 6.3. Market Analysis, Insights and Forecast - by Geography
- 6.3.1. China
- 6.3.2. India
- 6.3.3. Japan
- 6.3.4. South Korea
- 6.3.5. Rest of Asia-Pacific
- 6.1. Market Analysis, Insights and Forecast - by Product Type
- 7. China APCA Fuel Additive Industry Analysis, Insights and Forecast, 2021-2033
- 7.1. Market Analysis, Insights and Forecast - by Product Type
- 7.1.1. Deposit Control
- 7.1.2. Cetane Improvers
- 7.1.3. Lubricity Additives
- 7.1.4. Antioxidants
- 7.1.5. Anticorrosion
- 7.1.6. Cold Flow Improvers
- 7.1.7. Antiknock Agents
- 7.1.8. Other Product Types
- 7.2. Market Analysis, Insights and Forecast - by Application
- 7.2.1. Diesel
- 7.2.2. Gasoline
- 7.2.3. Jet Fuel
- 7.2.4. Other Applications
- 7.3. Market Analysis, Insights and Forecast - by Geography
- 7.3.1. China
- 7.3.2. India
- 7.3.3. Japan
- 7.3.4. South Korea
- 7.3.5. Rest of Asia-Pacific
- 7.1. Market Analysis, Insights and Forecast - by Product Type
- 8. India APCA Fuel Additive Industry Analysis, Insights and Forecast, 2021-2033
- 8.1. Market Analysis, Insights and Forecast - by Product Type
- 8.1.1. Deposit Control
- 8.1.2. Cetane Improvers
- 8.1.3. Lubricity Additives
- 8.1.4. Antioxidants
- 8.1.5. Anticorrosion
- 8.1.6. Cold Flow Improvers
- 8.1.7. Antiknock Agents
- 8.1.8. Other Product Types
- 8.2. Market Analysis, Insights and Forecast - by Application
- 8.2.1. Diesel
- 8.2.2. Gasoline
- 8.2.3. Jet Fuel
- 8.2.4. Other Applications
- 8.3. Market Analysis, Insights and Forecast - by Geography
- 8.3.1. China
- 8.3.2. India
- 8.3.3. Japan
- 8.3.4. South Korea
- 8.3.5. Rest of Asia-Pacific
- 8.1. Market Analysis, Insights and Forecast - by Product Type
- 9. Japan APCA Fuel Additive Industry Analysis, Insights and Forecast, 2021-2033
- 9.1. Market Analysis, Insights and Forecast - by Product Type
- 9.1.1. Deposit Control
- 9.1.2. Cetane Improvers
- 9.1.3. Lubricity Additives
- 9.1.4. Antioxidants
- 9.1.5. Anticorrosion
- 9.1.6. Cold Flow Improvers
- 9.1.7. Antiknock Agents
- 9.1.8. Other Product Types
- 9.2. Market Analysis, Insights and Forecast - by Application
- 9.2.1. Diesel
- 9.2.2. Gasoline
- 9.2.3. Jet Fuel
- 9.2.4. Other Applications
- 9.3. Market Analysis, Insights and Forecast - by Geography
- 9.3.1. China
- 9.3.2. India
- 9.3.3. Japan
- 9.3.4. South Korea
- 9.3.5. Rest of Asia-Pacific
- 9.1. Market Analysis, Insights and Forecast - by Product Type
- 10. South Korea APCA Fuel Additive Industry Analysis, Insights and Forecast, 2021-2033
- 10.1. Market Analysis, Insights and Forecast - by Product Type
- 10.1.1. Deposit Control
- 10.1.2. Cetane Improvers
- 10.1.3. Lubricity Additives
- 10.1.4. Antioxidants
- 10.1.5. Anticorrosion
- 10.1.6. Cold Flow Improvers
- 10.1.7. Antiknock Agents
- 10.1.8. Other Product Types
- 10.2. Market Analysis, Insights and Forecast - by Application
- 10.2.1. Diesel
- 10.2.2. Gasoline
- 10.2.3. Jet Fuel
- 10.2.4. Other Applications
- 10.3. Market Analysis, Insights and Forecast - by Geography
- 10.3.1. China
- 10.3.2. India
- 10.3.3. Japan
- 10.3.4. South Korea
- 10.3.5. Rest of Asia-Pacific
- 10.1. Market Analysis, Insights and Forecast - by Product Type
- 11. Rest of Asia Pacific APCA Fuel Additive Industry Analysis, Insights and Forecast, 2021-2033
- 11.1. Market Analysis, Insights and Forecast - by Product Type
- 11.1.1. Deposit Control
- 11.1.2. Cetane Improvers
- 11.1.3. Lubricity Additives
- 11.1.4. Antioxidants
- 11.1.5. Anticorrosion
- 11.1.6. Cold Flow Improvers
- 11.1.7. Antiknock Agents
- 11.1.8. Other Product Types
- 11.2. Market Analysis, Insights and Forecast - by Application
- 11.2.1. Diesel
- 11.2.2. Gasoline
- 11.2.3. Jet Fuel
- 11.2.4. Other Applications
- 11.3. Market Analysis, Insights and Forecast - by Geography
- 11.3.1. China
- 11.3.2. India
- 11.3.3. Japan
- 11.3.4. South Korea
- 11.3.5. Rest of Asia-Pacific
- 11.1. Market Analysis, Insights and Forecast - by Product Type
- 12. Competitive Analysis
- 12.1. Company Profiles
- 12.1.1 Innospec Inc
- 12.1.1.1. Company Overview
- 12.1.1.2. Products
- 12.1.1.3. Company Financials
- 12.1.1.4. SWOT Analysis
- 12.1.2 Baker Hughes a GE Company LLC
- 12.1.2.1. Company Overview
- 12.1.2.2. Products
- 12.1.2.3. Company Financials
- 12.1.2.4. SWOT Analysis
- 12.1.3 Clariant
- 12.1.3.1. Company Overview
- 12.1.3.2. Products
- 12.1.3.3. Company Financials
- 12.1.3.4. SWOT Analysis
- 12.1.4 Exxon Mobil Corporation
- 12.1.4.1. Company Overview
- 12.1.4.2. Products
- 12.1.4.3. Company Financials
- 12.1.4.4. SWOT Analysis
- 12.1.5 Royal Dutch Shell plc
- 12.1.5.1. Company Overview
- 12.1.5.2. Products
- 12.1.5.3. Company Financials
- 12.1.5.4. SWOT Analysis
- 12.1.6 Evonik Industries AG
- 12.1.6.1. Company Overview
- 12.1.6.2. Products
- 12.1.6.3. Company Financials
- 12.1.6.4. SWOT Analysis
- 12.1.7 LANXESS
- 12.1.7.1. Company Overview
- 12.1.7.2. Products
- 12.1.7.3. Company Financials
- 12.1.7.4. SWOT Analysis
- 12.1.8 Croda International Plc
- 12.1.8.1. Company Overview
- 12.1.8.2. Products
- 12.1.8.3. Company Financials
- 12.1.8.4. SWOT Analysis
- 12.1.9 BASF SE
- 12.1.9.1. Company Overview
- 12.1.9.2. Products
- 12.1.9.3. Company Financials
- 12.1.9.4. SWOT Analysis
- 12.1.10 Chevron Corporation
- 12.1.10.1. Company Overview
- 12.1.10.2. Products
- 12.1.10.3. Company Financials
- 12.1.10.4. SWOT Analysis
- 12.1.11 The Lubrizol Corporation
- 12.1.11.1. Company Overview
- 12.1.11.2. Products
- 12.1.11.3. Company Financials
- 12.1.11.4. SWOT Analysis
- 12.1.12 Dorfketal Chemicals (I) Pvt Ltd
- 12.1.12.1. Company Overview
- 12.1.12.2. Products
- 12.1.12.3. Company Financials
- 12.1.12.4. SWOT Analysis
- 12.1.13 Eni SpA
- 12.1.13.1. Company Overview
- 12.1.13.2. Products
- 12.1.13.3. Company Financials
- 12.1.13.4. SWOT Analysis
- 12.1.14 Total*List Not Exhaustive
- 12.1.14.1. Company Overview
- 12.1.14.2. Products
- 12.1.14.3. Company Financials
- 12.1.14.4. SWOT Analysis
- 12.1.15 Afton Chemical
- 12.1.15.1. Company Overview
- 12.1.15.2. Products
- 12.1.15.3. Company Financials
- 12.1.15.4. SWOT Analysis
- 12.1.1 Innospec Inc
- 12.2. Market Entropy
- 12.2.1 Company's Key Areas Served
- 12.2.2 Recent Developments
- 12.3. Company Market Share Analysis 2025
- 12.3.1 Top 5 Companies Market Share Analysis
- 12.3.2 Top 3 Companies Market Share Analysis
- 12.4. List of Potential Customers
- 13. Research Methodology
List of Figures
- Figure 1: Global APCA Fuel Additive Industry Revenue Breakdown (million, %) by Region 2025 & 2033
- Figure 2: China APCA Fuel Additive Industry Revenue (million), by Product Type 2025 & 2033
- Figure 3: China APCA Fuel Additive Industry Revenue Share (%), by Product Type 2025 & 2033
- Figure 4: China APCA Fuel Additive Industry Revenue (million), by Application 2025 & 2033
- Figure 5: China APCA Fuel Additive Industry Revenue Share (%), by Application 2025 & 2033
- Figure 6: China APCA Fuel Additive Industry Revenue (million), by Geography 2025 & 2033
- Figure 7: China APCA Fuel Additive Industry Revenue Share (%), by Geography 2025 & 2033
- Figure 8: China APCA Fuel Additive Industry Revenue (million), by Country 2025 & 2033
- Figure 9: China APCA Fuel Additive Industry Revenue Share (%), by Country 2025 & 2033
- Figure 10: India APCA Fuel Additive Industry Revenue (million), by Product Type 2025 & 2033
- Figure 11: India APCA Fuel Additive Industry Revenue Share (%), by Product Type 2025 & 2033
- Figure 12: India APCA Fuel Additive Industry Revenue (million), by Application 2025 & 2033
- Figure 13: India APCA Fuel Additive Industry Revenue Share (%), by Application 2025 & 2033
- Figure 14: India APCA Fuel Additive Industry Revenue (million), by Geography 2025 & 2033
- Figure 15: India APCA Fuel Additive Industry Revenue Share (%), by Geography 2025 & 2033
- Figure 16: India APCA Fuel Additive Industry Revenue (million), by Country 2025 & 2033
- Figure 17: India APCA Fuel Additive Industry Revenue Share (%), by Country 2025 & 2033
- Figure 18: Japan APCA Fuel Additive Industry Revenue (million), by Product Type 2025 & 2033
- Figure 19: Japan APCA Fuel Additive Industry Revenue Share (%), by Product Type 2025 & 2033
- Figure 20: Japan APCA Fuel Additive Industry Revenue (million), by Application 2025 & 2033
- Figure 21: Japan APCA Fuel Additive Industry Revenue Share (%), by Application 2025 & 2033
- Figure 22: Japan APCA Fuel Additive Industry Revenue (million), by Geography 2025 & 2033
- Figure 23: Japan APCA Fuel Additive Industry Revenue Share (%), by Geography 2025 & 2033
- Figure 24: Japan APCA Fuel Additive Industry Revenue (million), by Country 2025 & 2033
- Figure 25: Japan APCA Fuel Additive Industry Revenue Share (%), by Country 2025 & 2033
- Figure 26: South Korea APCA Fuel Additive Industry Revenue (million), by Product Type 2025 & 2033
- Figure 27: South Korea APCA Fuel Additive Industry Revenue Share (%), by Product Type 2025 & 2033
- Figure 28: South Korea APCA Fuel Additive Industry Revenue (million), by Application 2025 & 2033
- Figure 29: South Korea APCA Fuel Additive Industry Revenue Share (%), by Application 2025 & 2033
- Figure 30: South Korea APCA Fuel Additive Industry Revenue (million), by Geography 2025 & 2033
- Figure 31: South Korea APCA Fuel Additive Industry Revenue Share (%), by Geography 2025 & 2033
- Figure 32: South Korea APCA Fuel Additive Industry Revenue (million), by Country 2025 & 2033
- Figure 33: South Korea APCA Fuel Additive Industry Revenue Share (%), by Country 2025 & 2033
- Figure 34: Rest of Asia Pacific APCA Fuel Additive Industry Revenue (million), by Product Type 2025 & 2033
- Figure 35: Rest of Asia Pacific APCA Fuel Additive Industry Revenue Share (%), by Product Type 2025 & 2033
- Figure 36: Rest of Asia Pacific APCA Fuel Additive Industry Revenue (million), by Application 2025 & 2033
- Figure 37: Rest of Asia Pacific APCA Fuel Additive Industry Revenue Share (%), by Application 2025 & 2033
- Figure 38: Rest of Asia Pacific APCA Fuel Additive Industry Revenue (million), by Geography 2025 & 2033
- Figure 39: Rest of Asia Pacific APCA Fuel Additive Industry Revenue Share (%), by Geography 2025 & 2033
- Figure 40: Rest of Asia Pacific APCA Fuel Additive Industry Revenue (million), by Country 2025 & 2033
- Figure 41: Rest of Asia Pacific APCA Fuel Additive Industry Revenue Share (%), by Country 2025 & 2033
List of Tables
- Table 1: Global APCA Fuel Additive Industry Revenue million Forecast, by Product Type 2020 & 2033
- Table 2: Global APCA Fuel Additive Industry Revenue million Forecast, by Application 2020 & 2033
- Table 3: Global APCA Fuel Additive Industry Revenue million Forecast, by Geography 2020 & 2033
- Table 4: Global APCA Fuel Additive Industry Revenue million Forecast, by Region 2020 & 2033
- Table 5: Global APCA Fuel Additive Industry Revenue million Forecast, by Product Type 2020 & 2033
- Table 6: Global APCA Fuel Additive Industry Revenue million Forecast, by Application 2020 & 2033
- Table 7: Global APCA Fuel Additive Industry Revenue million Forecast, by Geography 2020 & 2033
- Table 8: Global APCA Fuel Additive Industry Revenue million Forecast, by Country 2020 & 2033
- Table 9: Global APCA Fuel Additive Industry Revenue million Forecast, by Product Type 2020 & 2033
- Table 10: Global APCA Fuel Additive Industry Revenue million Forecast, by Application 2020 & 2033
- Table 11: Global APCA Fuel Additive Industry Revenue million Forecast, by Geography 2020 & 2033
- Table 12: Global APCA Fuel Additive Industry Revenue million Forecast, by Country 2020 & 2033
- Table 13: Global APCA Fuel Additive Industry Revenue million Forecast, by Product Type 2020 & 2033
- Table 14: Global APCA Fuel Additive Industry Revenue million Forecast, by Application 2020 & 2033
- Table 15: Global APCA Fuel Additive Industry Revenue million Forecast, by Geography 2020 & 2033
- Table 16: Global APCA Fuel Additive Industry Revenue million Forecast, by Country 2020 & 2033
- Table 17: Global APCA Fuel Additive Industry Revenue million Forecast, by Product Type 2020 & 2033
- Table 18: Global APCA Fuel Additive Industry Revenue million Forecast, by Application 2020 & 2033
- Table 19: Global APCA Fuel Additive Industry Revenue million Forecast, by Geography 2020 & 2033
- Table 20: Global APCA Fuel Additive Industry Revenue million Forecast, by Country 2020 & 2033
- Table 21: Global APCA Fuel Additive Industry Revenue million Forecast, by Product Type 2020 & 2033
- Table 22: Global APCA Fuel Additive Industry Revenue million Forecast, by Application 2020 & 2033
- Table 23: Global APCA Fuel Additive Industry Revenue million Forecast, by Geography 2020 & 2033
- Table 24: Global APCA Fuel Additive Industry Revenue million Forecast, by Country 2020 & 2033
Frequently Asked Questions
1. What is the projected Compound Annual Growth Rate (CAGR) of the APCA Fuel Additive Industry?
The projected CAGR is approximately 4.5%.
2. Which companies are prominent players in the APCA Fuel Additive Industry?
Key companies in the market include Innospec Inc, Baker Hughes a GE Company LLC, Clariant, Exxon Mobil Corporation, Royal Dutch Shell plc, Evonik Industries AG, LANXESS, Croda International Plc, BASF SE, Chevron Corporation, The Lubrizol Corporation, Dorfketal Chemicals (I) Pvt Ltd, Eni SpA, Total*List Not Exhaustive, Afton Chemical.
3. What are the main segments of the APCA Fuel Additive Industry?
The market segments include Product Type, Application, Geography.
4. Can you provide details about the market size?
The market size is estimated to be USD 768 million as of 2022.
5. What are some drivers contributing to market growth?
; Enactment of Stringent Environmental Regulations; Rising Passenger Traffic Contributing to the Growth of the Aviation Market.
6. What are the notable trends driving market growth?
Gasoline to Dominate the Market.
7. Are there any restraints impacting market growth?
; Increasing Demand and Penetration of Battery Electric Vehicles (BEVs); High Costs of R&D Activities.
8. Can you provide examples of recent developments in the market?
N/A
9. What pricing options are available for accessing the report?
Pricing options include single-user, multi-user, and enterprise licenses priced at USD 4750, USD 5250, and USD 8750 respectively.
10. Is the market size provided in terms of value or volume?
The market size is provided in terms of value, measured in million.
11. Are there any specific market keywords associated with the report?
Yes, the market keyword associated with the report is "APCA Fuel Additive Industry," which aids in identifying and referencing the specific market segment covered.
12. How do I determine which pricing option suits my needs best?
The pricing options vary based on user requirements and access needs. Individual users may opt for single-user licenses, while businesses requiring broader access may choose multi-user or enterprise licenses for cost-effective access to the report.
13. Are there any additional resources or data provided in the APCA Fuel Additive Industry report?
While the report offers comprehensive insights, it's advisable to review the specific contents or supplementary materials provided to ascertain if additional resources or data are available.
14. How can I stay updated on further developments or reports in the APCA Fuel Additive Industry?
To stay informed about further developments, trends, and reports in the APCA Fuel Additive Industry, consider subscribing to industry newsletters, following relevant companies and organizations, or regularly checking reputable industry news sources and publications.
Methodology
Step 1 - Identification of Relevant Samples Size from Population Database


Step 2 - Approaches for Defining Global Market Size (Value, Volume* & Price*)

Note*: In applicable scenarios
Step 3 - Data Sources
Primary Research
- Web Analytics
- Survey Reports
- Research Institute
- Latest Research Reports
- Opinion Leaders
Secondary Research
- Annual Reports
- White Paper
- Latest Press Release
- Industry Association
- Paid Database
- Investor Presentations

Step 4 - Data Triangulation
Involves using different sources of information in order to increase the validity of a study
These sources are likely to be stakeholders in a program - participants, other researchers, program staff, other community members, and so on.
Then we put all data in single framework & apply various statistical tools to find out the dynamic on the market.
During the analysis stage, feedback from the stakeholder groups would be compared to determine areas of agreement as well as areas of divergence