
Key Insights
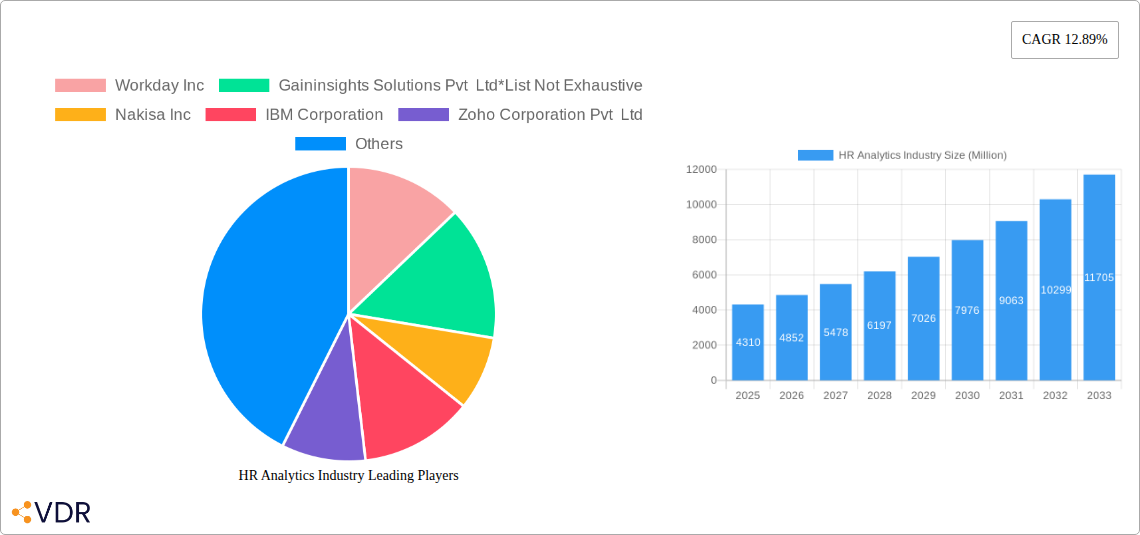
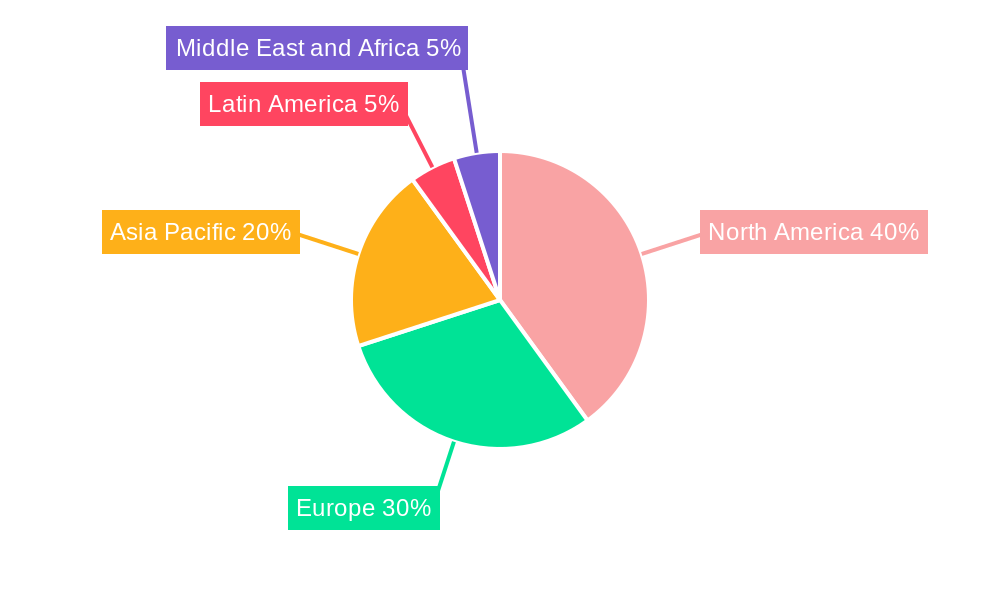
The HR analytics market, valued at $4.31 billion in 2025, is experiencing robust growth, projected to expand at a compound annual growth rate (CAGR) of 12.89% from 2025 to 2033. This expansion is fueled by several key drivers. Increasing adoption of cloud-based HR solutions facilitates data accessibility and analysis, leading to improved decision-making. The growing need for data-driven insights to optimize workforce planning, enhance employee engagement, and reduce employee turnover is significantly impacting market growth. Furthermore, advancements in artificial intelligence (AI) and machine learning (ML) are enabling more sophisticated predictive analytics, allowing HR departments to anticipate future trends and proactively address potential challenges. The market is segmented by component (solutions and services), deployment mode (on-premise and cloud – with cloud expected to dominate due to scalability and cost-effectiveness), and end-user industry (Telecom & IT, BFSI, Consumer Goods & Retail, Healthcare, Manufacturing, and Others). North America currently holds a significant market share due to early adoption of advanced technologies and a robust IT infrastructure, but the Asia-Pacific region is expected to witness substantial growth in the coming years driven by increasing digitalization and a large, expanding workforce.
Competition in the HR analytics market is intense, with established players like Workday, IBM, Oracle, and SAP competing with specialized providers such as Gainsights Solutions and Nakisa. The market's future hinges on the continued development and adoption of innovative technologies, including predictive modeling, sentiment analysis, and people analytics dashboards. Challenges include data security concerns, the need for skilled professionals to interpret complex data, and the integration of HR analytics with existing HR systems. Despite these hurdles, the overall outlook for the HR analytics market remains positive, driven by the increasing strategic importance of data-driven decision-making in human resource management. The focus will shift towards more personalized employee experiences and the use of analytics to improve diversity, equity, and inclusion initiatives.
This comprehensive report provides an in-depth analysis of the HR Analytics industry, encompassing market size, growth trends, competitive landscape, and future outlook. With a study period spanning 2019-2033, a base year of 2025, and a forecast period of 2025-2033, this report is an invaluable resource for industry professionals, investors, and strategic decision-makers. The parent market is the broader Human Resources (HR) technology market, while the child market is specifically HR Analytics. The market size in 2025 is estimated at XX Million.
HR Analytics Industry Market Dynamics & Structure
The HR Analytics market is characterized by moderate concentration, with key players such as Workday Inc, IBM Corporation, SAP SE, Oracle Corporation, and Zoho Corporation Pvt Ltd holding significant market share. However, the emergence of several smaller, specialized firms like Gaininsights Solutions Pvt Ltd and Nakisa Inc signifies a dynamic and competitive environment. Technological innovation, particularly in AI and ML, is a major driver, pushing the adoption of predictive analytics and advanced data visualization. Regulatory frameworks concerning data privacy (e.g., GDPR) are shaping market practices and driving demand for compliant solutions. Competitive substitutes include traditional HR reporting methods, but the increasing need for data-driven decision-making is steadily reducing their relevance. The end-user demographics are expanding beyond large enterprises to encompass SMEs, driven by cloud-based solutions offering accessible and affordable analytics capabilities. M&A activity remains robust, with XX deals recorded in the historical period (2019-2024), signaling consolidation and expansion efforts.
- Market Concentration: Moderately concentrated, with top 5 players holding approximately xx% market share in 2025.
- Technological Innovation: AI, ML, and big data analytics are key drivers.
- Regulatory Landscape: Data privacy regulations (GDPR, CCPA) influence market practices.
- Competitive Substitutes: Traditional HR reporting methods, but with declining relevance.
- M&A Activity: XX deals recorded between 2019 and 2024, with an estimated xx Million in value.
- Innovation Barriers: High initial investment costs, data integration challenges, and skills gap in analytics expertise.
HR Analytics Industry Growth Trends & Insights
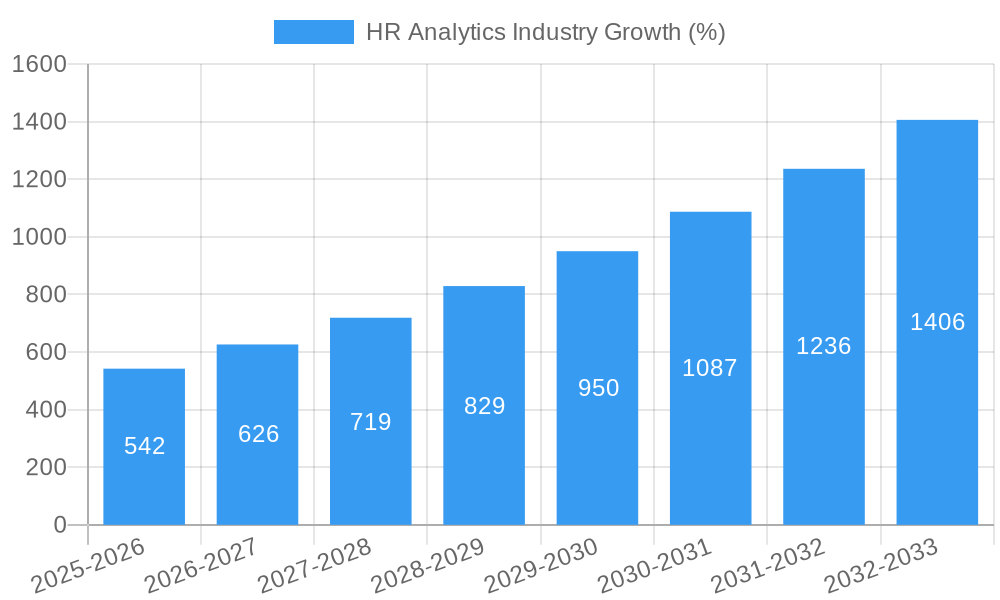
The HR Analytics market witnessed robust growth during the historical period (2019-2024), expanding from XX Million in 2019 to XX Million in 2024, reflecting a CAGR of xx%. This growth is attributed to increasing organizational focus on data-driven HR strategies, rising adoption of cloud-based solutions, and the growing need for workforce optimization. Technological disruptions, including the rise of AI and ML in HR, are transforming the industry landscape, facilitating predictive analytics and automation of HR processes. Shifting consumer behavior, with organizations prioritizing proactive HR strategies, further fuels market expansion. The market is expected to continue this growth trajectory, reaching XX Million by 2033, with a projected CAGR of xx% during the forecast period (2025-2033). Market penetration is expected to increase from xx% in 2025 to xx% in 2033, driven by wider adoption across various industries.
Dominant Regions, Countries, or Segments in HR Analytics Industry
North America currently dominates the HR Analytics market, holding the largest market share (approximately xx%) in 2025, driven by high technological adoption rates, significant investments in HR technology, and a mature market for data analytics. Europe follows with a market share of approximately xx%, driven by stringent data privacy regulations pushing adoption of compliant solutions. Within segments, the Cloud deployment mode is projected to capture the largest share (xx%) in 2025, fueled by its scalability, cost-effectiveness, and accessibility. The Solutions component will retain a larger market share compared to Services. In terms of end-user industries, BFSI and Telecom & IT currently lead in adoption and spending, owing to their data-intensive operations and focus on employee productivity. However, the Healthcare and Manufacturing sectors are expected to exhibit strong growth throughout the forecast period, as businesses in these sectors realize the potential of data-driven insights for optimized workforce management.
- Key Drivers for North America: High technological adoption, significant investments in HR technology.
- Key Drivers for Europe: Stringent data privacy regulations driving demand for compliant solutions.
- Cloud Deployment Mode Dominance: Scalability, cost-effectiveness, and accessibility.
- BFSI & Telecom/IT: High adoption due to data-intensive operations and focus on employee productivity.
- High Growth Potential: Healthcare and Manufacturing industries showing strong growth potential.
HR Analytics Industry Product Landscape
The HR Analytics product landscape is characterized by a wide range of solutions, including talent management platforms, workforce analytics dashboards, predictive modeling tools, and HR service delivery platforms. These products leverage advanced technologies like AI, ML, and big data analytics to provide actionable insights for improved recruitment, employee engagement, performance management, and succession planning. Key differentiators include the level of automation, integration capabilities, predictive accuracy, and the user-friendliness of the interface. Technological advancements are focused on enhancing data visualization, automating predictive modeling, and incorporating advanced analytics capabilities for enhanced decision-making.
Key Drivers, Barriers & Challenges in HR Analytics Industry
Key Drivers:
- The increasing need for data-driven decision-making in HR.
- The rise of cloud-based HR solutions, enabling easier access and affordability.
- Technological advancements, particularly in AI, ML, and big data.
- Growing regulatory pressure around data privacy and compliance.
Challenges & Restraints:
- High initial investment costs for implementing HR analytics solutions.
- Integration challenges with existing HR systems.
- Lack of skilled professionals to manage and interpret HR data effectively.
- Data security and privacy concerns. The market faces a potential xx% reduction in growth if data breach incidents increase significantly.
Emerging Opportunities in HR Analytics Industry
- Expansion into untapped markets, such as SMEs in developing economies.
- Growing demand for specialized HR analytics solutions catering to specific industry needs.
- Development of predictive analytics models for talent acquisition and retention.
- Integration of HR analytics with other business intelligence platforms.
- The growing focus on employee experience and well-being presents an opportunity for HR analytics to play a crucial role in measuring and improving employee engagement.
Growth Accelerators in the HR Analytics Industry
The long-term growth of the HR Analytics industry will be significantly boosted by continued technological innovation, particularly the development of more sophisticated AI and ML algorithms capable of handling complex HR data. Strategic partnerships between HR technology providers and consulting firms will expand market reach and adoption. Market expansion into emerging economies and the increasing focus on people analytics will be key drivers.
Key Players Shaping the HR Analytics Industry Market
- Workday Inc
- Gaininsights Solutions Pvt Ltd
- Nakisa Inc
- IBM Corporation
- Zoho Corporation Pvt Ltd
- Tableau Software Inc
- Oracle Corporation
- Kronos Inc
- SAP SE
Notable Milestones in HR Analytics Industry Sector
- June 2022: GainInsights partnered with DataSwitch to accelerate analytics modernization.
- May 2022: Visier and Deloitte established a strategic agreement to offer comprehensive HR analytics services.
In-Depth HR Analytics Industry Market Outlook
The HR Analytics market is poised for sustained growth over the next decade, driven by continuous technological advancements, increasing adoption across various sectors, and a greater focus on data-driven decision-making in HR. Strategic partnerships, market expansions into new regions, and the development of innovative applications will further contribute to market expansion and create significant opportunities for both established players and new entrants. The market's future hinges on overcoming challenges related to data integration, skills gaps, and data security concerns. The forecast points towards a strong and sustained growth trajectory, solidifying HR Analytics as a crucial component of modern HR management.
HR Analytics Industry Segmentation
-
1. Component
- 1.1. Solutions
- 1.2. Services
-
2. Deployment Mode
- 2.1. On-Premise
- 2.2. Cloud
-
3. End-User Industry
- 3.1. Telecom and IT
- 3.2. BFSI
- 3.3. Consumer Goods and Retail
- 3.4. Healthcare
- 3.5. Manufacturing
- 3.6. Other End-user Industries
HR Analytics Industry Segmentation By Geography
-
1. North America
- 1.1. United States
- 1.2. Canada
-
2. Europe
- 2.1. Germany
- 2.2. United Kingdom
- 2.3. France
- 2.4. Rest of Europe
-
3. Asia Pacific
- 3.1. India
- 3.2. China
- 3.3. Japan
- 3.4. Rest of Asia Pacific
-
4. Latin America
- 4.1. Brazil
- 4.2. Argentina
- 4.3. Rest of Latin America
-
5. Middle East and Africa
- 5.1. United Arab Emirates
- 5.2. Saudi Arabia
- 5.3. Rest of Middle East and Africa
HR Analytics Industry REPORT HIGHLIGHTS
| Aspects | Details |
|---|---|
| Study Period | 2019-2033 |
| Base Year | 2024 |
| Estimated Year | 2025 |
| Forecast Period | 2025-2033 |
| Historical Period | 2019-2024 |
| Growth Rate | CAGR of 12.89% from 2019-2033 |
| Segmentation |
|
Table of Contents
- 1. Introduction
- 1.1. Research Scope
- 1.2. Market Segmentation
- 1.3. Research Methodology
- 1.4. Definitions and Assumptions
- 2. Executive Summary
- 2.1. Introduction
- 3. Market Dynamics
- 3.1. Introduction
- 3.2. Market Drivers
- 3.2.1. Increase in Trends in Cloud-based Solutions; Increase in Workforce and Need for Reduction in Attrition Rate
- 3.3. Market Restrains
- 3.3.1. 7.1 Increasing Security and Privacy Concerns
- 3.4. Market Trends
- 3.4.1. Telecom and IT Industry is Witnessing a Significant Share in the Market
- 4. Market Factor Analysis
- 4.1. Porters Five Forces
- 4.2. Supply/Value Chain
- 4.3. PESTEL analysis
- 4.4. Market Entropy
- 4.5. Patent/Trademark Analysis
- 5. Global HR Analytics Industry Analysis, Insights and Forecast, 2019-2031
- 5.1. Market Analysis, Insights and Forecast - by Component
- 5.1.1. Solutions
- 5.1.2. Services
- 5.2. Market Analysis, Insights and Forecast - by Deployment Mode
- 5.2.1. On-Premise
- 5.2.2. Cloud
- 5.3. Market Analysis, Insights and Forecast - by End-User Industry
- 5.3.1. Telecom and IT
- 5.3.2. BFSI
- 5.3.3. Consumer Goods and Retail
- 5.3.4. Healthcare
- 5.3.5. Manufacturing
- 5.3.6. Other End-user Industries
- 5.4. Market Analysis, Insights and Forecast - by Region
- 5.4.1. North America
- 5.4.2. Europe
- 5.4.3. Asia Pacific
- 5.4.4. Latin America
- 5.4.5. Middle East and Africa
- 5.1. Market Analysis, Insights and Forecast - by Component
- 6. North America HR Analytics Industry Analysis, Insights and Forecast, 2019-2031
- 6.1. Market Analysis, Insights and Forecast - by Component
- 6.1.1. Solutions
- 6.1.2. Services
- 6.2. Market Analysis, Insights and Forecast - by Deployment Mode
- 6.2.1. On-Premise
- 6.2.2. Cloud
- 6.3. Market Analysis, Insights and Forecast - by End-User Industry
- 6.3.1. Telecom and IT
- 6.3.2. BFSI
- 6.3.3. Consumer Goods and Retail
- 6.3.4. Healthcare
- 6.3.5. Manufacturing
- 6.3.6. Other End-user Industries
- 6.1. Market Analysis, Insights and Forecast - by Component
- 7. Europe HR Analytics Industry Analysis, Insights and Forecast, 2019-2031
- 7.1. Market Analysis, Insights and Forecast - by Component
- 7.1.1. Solutions
- 7.1.2. Services
- 7.2. Market Analysis, Insights and Forecast - by Deployment Mode
- 7.2.1. On-Premise
- 7.2.2. Cloud
- 7.3. Market Analysis, Insights and Forecast - by End-User Industry
- 7.3.1. Telecom and IT
- 7.3.2. BFSI
- 7.3.3. Consumer Goods and Retail
- 7.3.4. Healthcare
- 7.3.5. Manufacturing
- 7.3.6. Other End-user Industries
- 7.1. Market Analysis, Insights and Forecast - by Component
- 8. Asia Pacific HR Analytics Industry Analysis, Insights and Forecast, 2019-2031
- 8.1. Market Analysis, Insights and Forecast - by Component
- 8.1.1. Solutions
- 8.1.2. Services
- 8.2. Market Analysis, Insights and Forecast - by Deployment Mode
- 8.2.1. On-Premise
- 8.2.2. Cloud
- 8.3. Market Analysis, Insights and Forecast - by End-User Industry
- 8.3.1. Telecom and IT
- 8.3.2. BFSI
- 8.3.3. Consumer Goods and Retail
- 8.3.4. Healthcare
- 8.3.5. Manufacturing
- 8.3.6. Other End-user Industries
- 8.1. Market Analysis, Insights and Forecast - by Component
- 9. Latin America HR Analytics Industry Analysis, Insights and Forecast, 2019-2031
- 9.1. Market Analysis, Insights and Forecast - by Component
- 9.1.1. Solutions
- 9.1.2. Services
- 9.2. Market Analysis, Insights and Forecast - by Deployment Mode
- 9.2.1. On-Premise
- 9.2.2. Cloud
- 9.3. Market Analysis, Insights and Forecast - by End-User Industry
- 9.3.1. Telecom and IT
- 9.3.2. BFSI
- 9.3.3. Consumer Goods and Retail
- 9.3.4. Healthcare
- 9.3.5. Manufacturing
- 9.3.6. Other End-user Industries
- 9.1. Market Analysis, Insights and Forecast - by Component
- 10. Middle East and Africa HR Analytics Industry Analysis, Insights and Forecast, 2019-2031
- 10.1. Market Analysis, Insights and Forecast - by Component
- 10.1.1. Solutions
- 10.1.2. Services
- 10.2. Market Analysis, Insights and Forecast - by Deployment Mode
- 10.2.1. On-Premise
- 10.2.2. Cloud
- 10.3. Market Analysis, Insights and Forecast - by End-User Industry
- 10.3.1. Telecom and IT
- 10.3.2. BFSI
- 10.3.3. Consumer Goods and Retail
- 10.3.4. Healthcare
- 10.3.5. Manufacturing
- 10.3.6. Other End-user Industries
- 10.1. Market Analysis, Insights and Forecast - by Component
- 11. North America HR Analytics Industry Analysis, Insights and Forecast, 2019-2031
- 11.1. Market Analysis, Insights and Forecast - By Country/Sub-region
- 11.1.1 United States
- 11.1.2 Canada
- 12. Europe HR Analytics Industry Analysis, Insights and Forecast, 2019-2031
- 12.1. Market Analysis, Insights and Forecast - By Country/Sub-region
- 12.1.1 Germany
- 12.1.2 United Kingdom
- 12.1.3 France
- 12.1.4 Rest of Europe
- 13. Asia Pacific HR Analytics Industry Analysis, Insights and Forecast, 2019-2031
- 13.1. Market Analysis, Insights and Forecast - By Country/Sub-region
- 13.1.1 India
- 13.1.2 China
- 13.1.3 Japan
- 13.1.4 Rest of Asia Pacific
- 14. Latin America HR Analytics Industry Analysis, Insights and Forecast, 2019-2031
- 14.1. Market Analysis, Insights and Forecast - By Country/Sub-region
- 14.1.1 Brazil
- 14.1.2 Argentina
- 14.1.3 Rest of Latin America
- 15. Middle East and Africa HR Analytics Industry Analysis, Insights and Forecast, 2019-2031
- 15.1. Market Analysis, Insights and Forecast - By Country/Sub-region
- 15.1.1 United Arab Emirates
- 15.1.2 Saudi Arabia
- 15.1.3 Rest of Middle East and Africa
- 16. Competitive Analysis
- 16.1. Global Market Share Analysis 2024
- 16.2. Company Profiles
- 16.2.1 Workday Inc
- 16.2.1.1. Overview
- 16.2.1.2. Products
- 16.2.1.3. SWOT Analysis
- 16.2.1.4. Recent Developments
- 16.2.1.5. Financials (Based on Availability)
- 16.2.2 Gaininsights Solutions Pvt Ltd*List Not Exhaustive
- 16.2.2.1. Overview
- 16.2.2.2. Products
- 16.2.2.3. SWOT Analysis
- 16.2.2.4. Recent Developments
- 16.2.2.5. Financials (Based on Availability)
- 16.2.3 Nakisa Inc
- 16.2.3.1. Overview
- 16.2.3.2. Products
- 16.2.3.3. SWOT Analysis
- 16.2.3.4. Recent Developments
- 16.2.3.5. Financials (Based on Availability)
- 16.2.4 IBM Corporation
- 16.2.4.1. Overview
- 16.2.4.2. Products
- 16.2.4.3. SWOT Analysis
- 16.2.4.4. Recent Developments
- 16.2.4.5. Financials (Based on Availability)
- 16.2.5 Zoho Corporation Pvt Ltd
- 16.2.5.1. Overview
- 16.2.5.2. Products
- 16.2.5.3. SWOT Analysis
- 16.2.5.4. Recent Developments
- 16.2.5.5. Financials (Based on Availability)
- 16.2.6 Tableau Software Inc
- 16.2.6.1. Overview
- 16.2.6.2. Products
- 16.2.6.3. SWOT Analysis
- 16.2.6.4. Recent Developments
- 16.2.6.5. Financials (Based on Availability)
- 16.2.7 Oracle Corporation
- 16.2.7.1. Overview
- 16.2.7.2. Products
- 16.2.7.3. SWOT Analysis
- 16.2.7.4. Recent Developments
- 16.2.7.5. Financials (Based on Availability)
- 16.2.8 Kronos Inc
- 16.2.8.1. Overview
- 16.2.8.2. Products
- 16.2.8.3. SWOT Analysis
- 16.2.8.4. Recent Developments
- 16.2.8.5. Financials (Based on Availability)
- 16.2.9 SAP SE
- 16.2.9.1. Overview
- 16.2.9.2. Products
- 16.2.9.3. SWOT Analysis
- 16.2.9.4. Recent Developments
- 16.2.9.5. Financials (Based on Availability)
- 16.2.1 Workday Inc
List of Figures
- Figure 1: Global HR Analytics Industry Revenue Breakdown (Million, %) by Region 2024 & 2032
- Figure 2: North America HR Analytics Industry Revenue (Million), by Country 2024 & 2032
- Figure 3: North America HR Analytics Industry Revenue Share (%), by Country 2024 & 2032
- Figure 4: Europe HR Analytics Industry Revenue (Million), by Country 2024 & 2032
- Figure 5: Europe HR Analytics Industry Revenue Share (%), by Country 2024 & 2032
- Figure 6: Asia Pacific HR Analytics Industry Revenue (Million), by Country 2024 & 2032
- Figure 7: Asia Pacific HR Analytics Industry Revenue Share (%), by Country 2024 & 2032
- Figure 8: Latin America HR Analytics Industry Revenue (Million), by Country 2024 & 2032
- Figure 9: Latin America HR Analytics Industry Revenue Share (%), by Country 2024 & 2032
- Figure 10: Middle East and Africa HR Analytics Industry Revenue (Million), by Country 2024 & 2032
- Figure 11: Middle East and Africa HR Analytics Industry Revenue Share (%), by Country 2024 & 2032
- Figure 12: North America HR Analytics Industry Revenue (Million), by Component 2024 & 2032
- Figure 13: North America HR Analytics Industry Revenue Share (%), by Component 2024 & 2032
- Figure 14: North America HR Analytics Industry Revenue (Million), by Deployment Mode 2024 & 2032
- Figure 15: North America HR Analytics Industry Revenue Share (%), by Deployment Mode 2024 & 2032
- Figure 16: North America HR Analytics Industry Revenue (Million), by End-User Industry 2024 & 2032
- Figure 17: North America HR Analytics Industry Revenue Share (%), by End-User Industry 2024 & 2032
- Figure 18: North America HR Analytics Industry Revenue (Million), by Country 2024 & 2032
- Figure 19: North America HR Analytics Industry Revenue Share (%), by Country 2024 & 2032
- Figure 20: Europe HR Analytics Industry Revenue (Million), by Component 2024 & 2032
- Figure 21: Europe HR Analytics Industry Revenue Share (%), by Component 2024 & 2032
- Figure 22: Europe HR Analytics Industry Revenue (Million), by Deployment Mode 2024 & 2032
- Figure 23: Europe HR Analytics Industry Revenue Share (%), by Deployment Mode 2024 & 2032
- Figure 24: Europe HR Analytics Industry Revenue (Million), by End-User Industry 2024 & 2032
- Figure 25: Europe HR Analytics Industry Revenue Share (%), by End-User Industry 2024 & 2032
- Figure 26: Europe HR Analytics Industry Revenue (Million), by Country 2024 & 2032
- Figure 27: Europe HR Analytics Industry Revenue Share (%), by Country 2024 & 2032
- Figure 28: Asia Pacific HR Analytics Industry Revenue (Million), by Component 2024 & 2032
- Figure 29: Asia Pacific HR Analytics Industry Revenue Share (%), by Component 2024 & 2032
- Figure 30: Asia Pacific HR Analytics Industry Revenue (Million), by Deployment Mode 2024 & 2032
- Figure 31: Asia Pacific HR Analytics Industry Revenue Share (%), by Deployment Mode 2024 & 2032
- Figure 32: Asia Pacific HR Analytics Industry Revenue (Million), by End-User Industry 2024 & 2032
- Figure 33: Asia Pacific HR Analytics Industry Revenue Share (%), by End-User Industry 2024 & 2032
- Figure 34: Asia Pacific HR Analytics Industry Revenue (Million), by Country 2024 & 2032
- Figure 35: Asia Pacific HR Analytics Industry Revenue Share (%), by Country 2024 & 2032
- Figure 36: Latin America HR Analytics Industry Revenue (Million), by Component 2024 & 2032
- Figure 37: Latin America HR Analytics Industry Revenue Share (%), by Component 2024 & 2032
- Figure 38: Latin America HR Analytics Industry Revenue (Million), by Deployment Mode 2024 & 2032
- Figure 39: Latin America HR Analytics Industry Revenue Share (%), by Deployment Mode 2024 & 2032
- Figure 40: Latin America HR Analytics Industry Revenue (Million), by End-User Industry 2024 & 2032
- Figure 41: Latin America HR Analytics Industry Revenue Share (%), by End-User Industry 2024 & 2032
- Figure 42: Latin America HR Analytics Industry Revenue (Million), by Country 2024 & 2032
- Figure 43: Latin America HR Analytics Industry Revenue Share (%), by Country 2024 & 2032
- Figure 44: Middle East and Africa HR Analytics Industry Revenue (Million), by Component 2024 & 2032
- Figure 45: Middle East and Africa HR Analytics Industry Revenue Share (%), by Component 2024 & 2032
- Figure 46: Middle East and Africa HR Analytics Industry Revenue (Million), by Deployment Mode 2024 & 2032
- Figure 47: Middle East and Africa HR Analytics Industry Revenue Share (%), by Deployment Mode 2024 & 2032
- Figure 48: Middle East and Africa HR Analytics Industry Revenue (Million), by End-User Industry 2024 & 2032
- Figure 49: Middle East and Africa HR Analytics Industry Revenue Share (%), by End-User Industry 2024 & 2032
- Figure 50: Middle East and Africa HR Analytics Industry Revenue (Million), by Country 2024 & 2032
- Figure 51: Middle East and Africa HR Analytics Industry Revenue Share (%), by Country 2024 & 2032
List of Tables
- Table 1: Global HR Analytics Industry Revenue Million Forecast, by Region 2019 & 2032
- Table 2: Global HR Analytics Industry Revenue Million Forecast, by Component 2019 & 2032
- Table 3: Global HR Analytics Industry Revenue Million Forecast, by Deployment Mode 2019 & 2032
- Table 4: Global HR Analytics Industry Revenue Million Forecast, by End-User Industry 2019 & 2032
- Table 5: Global HR Analytics Industry Revenue Million Forecast, by Region 2019 & 2032
- Table 6: Global HR Analytics Industry Revenue Million Forecast, by Country 2019 & 2032
- Table 7: United States HR Analytics Industry Revenue (Million) Forecast, by Application 2019 & 2032
- Table 8: Canada HR Analytics Industry Revenue (Million) Forecast, by Application 2019 & 2032
- Table 9: Global HR Analytics Industry Revenue Million Forecast, by Country 2019 & 2032
- Table 10: Germany HR Analytics Industry Revenue (Million) Forecast, by Application 2019 & 2032
- Table 11: United Kingdom HR Analytics Industry Revenue (Million) Forecast, by Application 2019 & 2032
- Table 12: France HR Analytics Industry Revenue (Million) Forecast, by Application 2019 & 2032
- Table 13: Rest of Europe HR Analytics Industry Revenue (Million) Forecast, by Application 2019 & 2032
- Table 14: Global HR Analytics Industry Revenue Million Forecast, by Country 2019 & 2032
- Table 15: India HR Analytics Industry Revenue (Million) Forecast, by Application 2019 & 2032
- Table 16: China HR Analytics Industry Revenue (Million) Forecast, by Application 2019 & 2032
- Table 17: Japan HR Analytics Industry Revenue (Million) Forecast, by Application 2019 & 2032
- Table 18: Rest of Asia Pacific HR Analytics Industry Revenue (Million) Forecast, by Application 2019 & 2032
- Table 19: Global HR Analytics Industry Revenue Million Forecast, by Country 2019 & 2032
- Table 20: Brazil HR Analytics Industry Revenue (Million) Forecast, by Application 2019 & 2032
- Table 21: Argentina HR Analytics Industry Revenue (Million) Forecast, by Application 2019 & 2032
- Table 22: Rest of Latin America HR Analytics Industry Revenue (Million) Forecast, by Application 2019 & 2032
- Table 23: Global HR Analytics Industry Revenue Million Forecast, by Country 2019 & 2032
- Table 24: United Arab Emirates HR Analytics Industry Revenue (Million) Forecast, by Application 2019 & 2032
- Table 25: Saudi Arabia HR Analytics Industry Revenue (Million) Forecast, by Application 2019 & 2032
- Table 26: Rest of Middle East and Africa HR Analytics Industry Revenue (Million) Forecast, by Application 2019 & 2032
- Table 27: Global HR Analytics Industry Revenue Million Forecast, by Component 2019 & 2032
- Table 28: Global HR Analytics Industry Revenue Million Forecast, by Deployment Mode 2019 & 2032
- Table 29: Global HR Analytics Industry Revenue Million Forecast, by End-User Industry 2019 & 2032
- Table 30: Global HR Analytics Industry Revenue Million Forecast, by Country 2019 & 2032
- Table 31: United States HR Analytics Industry Revenue (Million) Forecast, by Application 2019 & 2032
- Table 32: Canada HR Analytics Industry Revenue (Million) Forecast, by Application 2019 & 2032
- Table 33: Global HR Analytics Industry Revenue Million Forecast, by Component 2019 & 2032
- Table 34: Global HR Analytics Industry Revenue Million Forecast, by Deployment Mode 2019 & 2032
- Table 35: Global HR Analytics Industry Revenue Million Forecast, by End-User Industry 2019 & 2032
- Table 36: Global HR Analytics Industry Revenue Million Forecast, by Country 2019 & 2032
- Table 37: Germany HR Analytics Industry Revenue (Million) Forecast, by Application 2019 & 2032
- Table 38: United Kingdom HR Analytics Industry Revenue (Million) Forecast, by Application 2019 & 2032
- Table 39: France HR Analytics Industry Revenue (Million) Forecast, by Application 2019 & 2032
- Table 40: Rest of Europe HR Analytics Industry Revenue (Million) Forecast, by Application 2019 & 2032
- Table 41: Global HR Analytics Industry Revenue Million Forecast, by Component 2019 & 2032
- Table 42: Global HR Analytics Industry Revenue Million Forecast, by Deployment Mode 2019 & 2032
- Table 43: Global HR Analytics Industry Revenue Million Forecast, by End-User Industry 2019 & 2032
- Table 44: Global HR Analytics Industry Revenue Million Forecast, by Country 2019 & 2032
- Table 45: India HR Analytics Industry Revenue (Million) Forecast, by Application 2019 & 2032
- Table 46: China HR Analytics Industry Revenue (Million) Forecast, by Application 2019 & 2032
- Table 47: Japan HR Analytics Industry Revenue (Million) Forecast, by Application 2019 & 2032
- Table 48: Rest of Asia Pacific HR Analytics Industry Revenue (Million) Forecast, by Application 2019 & 2032
- Table 49: Global HR Analytics Industry Revenue Million Forecast, by Component 2019 & 2032
- Table 50: Global HR Analytics Industry Revenue Million Forecast, by Deployment Mode 2019 & 2032
- Table 51: Global HR Analytics Industry Revenue Million Forecast, by End-User Industry 2019 & 2032
- Table 52: Global HR Analytics Industry Revenue Million Forecast, by Country 2019 & 2032
- Table 53: Brazil HR Analytics Industry Revenue (Million) Forecast, by Application 2019 & 2032
- Table 54: Argentina HR Analytics Industry Revenue (Million) Forecast, by Application 2019 & 2032
- Table 55: Rest of Latin America HR Analytics Industry Revenue (Million) Forecast, by Application 2019 & 2032
- Table 56: Global HR Analytics Industry Revenue Million Forecast, by Component 2019 & 2032
- Table 57: Global HR Analytics Industry Revenue Million Forecast, by Deployment Mode 2019 & 2032
- Table 58: Global HR Analytics Industry Revenue Million Forecast, by End-User Industry 2019 & 2032
- Table 59: Global HR Analytics Industry Revenue Million Forecast, by Country 2019 & 2032
- Table 60: United Arab Emirates HR Analytics Industry Revenue (Million) Forecast, by Application 2019 & 2032
- Table 61: Saudi Arabia HR Analytics Industry Revenue (Million) Forecast, by Application 2019 & 2032
- Table 62: Rest of Middle East and Africa HR Analytics Industry Revenue (Million) Forecast, by Application 2019 & 2032
Frequently Asked Questions
1. What is the projected Compound Annual Growth Rate (CAGR) of the HR Analytics Industry?
The projected CAGR is approximately 12.89%.
2. Which companies are prominent players in the HR Analytics Industry?
Key companies in the market include Workday Inc, Gaininsights Solutions Pvt Ltd*List Not Exhaustive, Nakisa Inc, IBM Corporation, Zoho Corporation Pvt Ltd, Tableau Software Inc, Oracle Corporation, Kronos Inc, SAP SE.
3. What are the main segments of the HR Analytics Industry?
The market segments include Component, Deployment Mode, End-User Industry.
4. Can you provide details about the market size?
The market size is estimated to be USD 4.31 Million as of 2022.
5. What are some drivers contributing to market growth?
Increase in Trends in Cloud-based Solutions; Increase in Workforce and Need for Reduction in Attrition Rate.
6. What are the notable trends driving market growth?
Telecom and IT Industry is Witnessing a Significant Share in the Market.
7. Are there any restraints impacting market growth?
7.1 Increasing Security and Privacy Concerns.
8. Can you provide examples of recent developments in the market?
June 2022: GainInsights, a global data and analytics firm announced it has signed an agreement with DataSwitch, an emerging AI/ML-driven Data Transformation Platform, to accelerate analytics modernization initiatives through data pipeline innovation and accelerators for migration.
9. What pricing options are available for accessing the report?
Pricing options include single-user, multi-user, and enterprise licenses priced at USD 4750, USD 5250, and USD 8750 respectively.
10. Is the market size provided in terms of value or volume?
The market size is provided in terms of value, measured in Million.
11. Are there any specific market keywords associated with the report?
Yes, the market keyword associated with the report is "HR Analytics Industry," which aids in identifying and referencing the specific market segment covered.
12. How do I determine which pricing option suits my needs best?
The pricing options vary based on user requirements and access needs. Individual users may opt for single-user licenses, while businesses requiring broader access may choose multi-user or enterprise licenses for cost-effective access to the report.
13. Are there any additional resources or data provided in the HR Analytics Industry report?
While the report offers comprehensive insights, it's advisable to review the specific contents or supplementary materials provided to ascertain if additional resources or data are available.
14. How can I stay updated on further developments or reports in the HR Analytics Industry?
To stay informed about further developments, trends, and reports in the HR Analytics Industry, consider subscribing to industry newsletters, following relevant companies and organizations, or regularly checking reputable industry news sources and publications.
Methodology
Step 1 - Identification of Relevant Samples Size from Population Database


Step 2 - Approaches for Defining Global Market Size (Value, Volume* & Price*)

Note*: In applicable scenarios
Step 3 - Data Sources
Primary Research
- Web Analytics
- Survey Reports
- Research Institute
- Latest Research Reports
- Opinion Leaders
Secondary Research
- Annual Reports
- White Paper
- Latest Press Release
- Industry Association
- Paid Database
- Investor Presentations

Step 4 - Data Triangulation
Involves using different sources of information in order to increase the validity of a study
These sources are likely to be stakeholders in a program - participants, other researchers, program staff, other community members, and so on.
Then we put all data in single framework & apply various statistical tools to find out the dynamic on the market.
During the analysis stage, feedback from the stakeholder groups would be compared to determine areas of agreement as well as areas of divergence


