

Key Insights
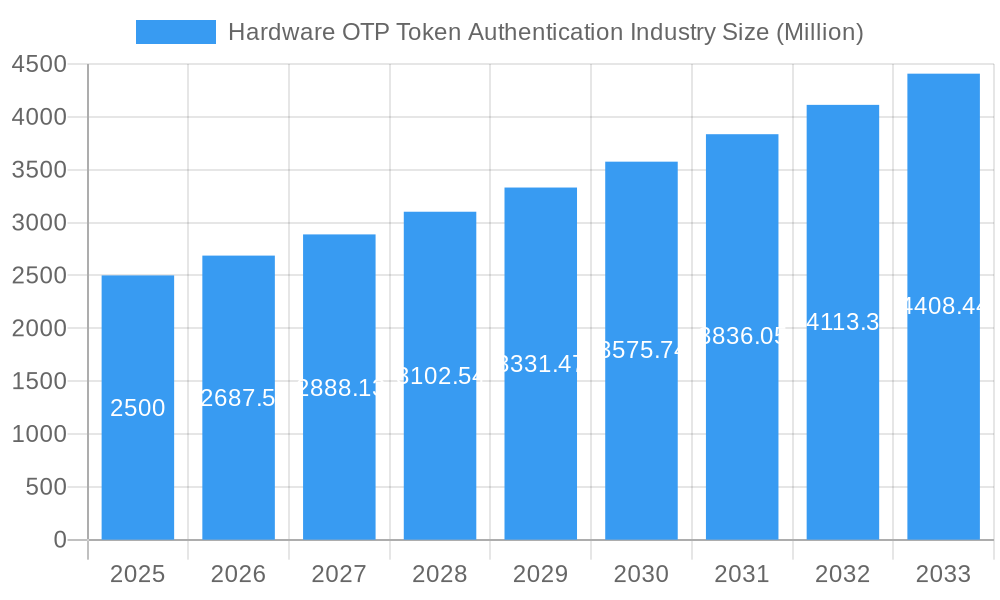
The Hardware OTP Token Authentication market, valued at approximately $2.5 billion in 2025, is experiencing robust growth, projected to reach $4.5 billion by 2033, exhibiting a Compound Annual Growth Rate (CAGR) of 7.50%. This expansion is fueled by several key factors. The increasing prevalence of cyber threats and data breaches across various sectors—particularly banking, financial services, and government—is driving the demand for strong authentication methods. Hardware OTP tokens offer a highly secure and reliable solution, mitigating risks associated with phishing attacks and password compromises. Furthermore, the rising adoption of contactless and connected authentication technologies, coupled with regulatory mandates emphasizing robust security protocols, is significantly boosting market growth. The market is segmented by end-user industry (banking, financial services and insurance holding the largest share, followed by government and healthcare) and by token type (connected and disconnected, with contactless gaining traction). The competitive landscape is characterized by established players like Thales, Broadcom (Symantec), and RSA, alongside emerging companies offering innovative solutions. The North American region is currently the dominant market, followed by Europe and Asia Pacific, with Asia Pacific showing the highest projected growth due to increasing digitalization and government initiatives promoting cybersecurity.
Hardware OTP Token Authentication Industry Market Size (In Billion)
The market's growth trajectory is expected to remain positive throughout the forecast period, driven by the continued need for enhanced security measures. However, factors such as the increasing adoption of software-based authentication solutions and the potential for high initial investment costs for hardware implementation could pose challenges. Nevertheless, the inherent security advantages of hardware OTP tokens, especially in high-risk environments, ensure the market's long-term viability. The shift toward multi-factor authentication (MFA) and the integration of hardware OTP tokens into broader identity and access management (IAM) strategies are further contributing to the market's positive outlook. Technological advancements leading to more user-friendly and cost-effective solutions are likely to drive further penetration into various market segments.
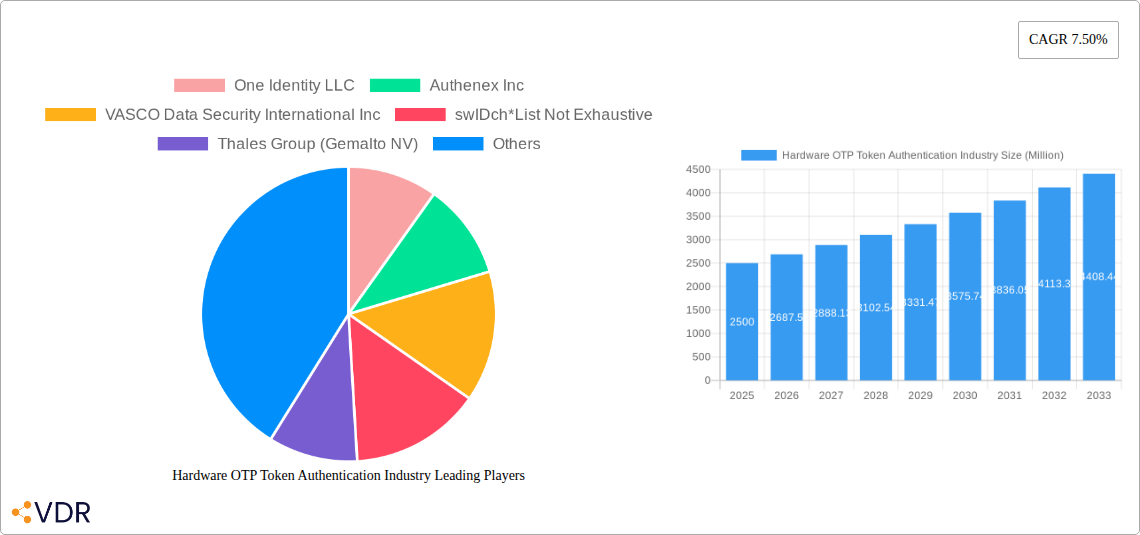
Hardware OTP Token Authentication Industry Company Market Share
Hardware OTP Token Authentication Industry Market Report: 2019-2033
This comprehensive report provides an in-depth analysis of the Hardware OTP Token Authentication industry, encompassing market dynamics, growth trends, regional analysis, and competitive landscape. With a study period spanning 2019-2033 (base year 2025, forecast period 2025-2033), this report is an invaluable resource for industry professionals, investors, and strategic decision-makers seeking to understand and capitalize on the opportunities within this rapidly evolving sector. The parent market is the broader authentication market, with this report focusing on the child market of hardware-based OTP token authentication. Market values are presented in million units.
Hardware OTP Token Authentication Industry Market Dynamics & Structure
The Hardware OTP Token Authentication market is characterized by moderate concentration, with key players such as One Identity LLC, Authenex Inc, VASCO Data Security International Inc, swIDch, Thales Group (Gemalto NV), Dell Technologies Inc, Broadcom Inc (Symantec Corporation), RSA Security LLC, SurepassID Corp, Entrust Datacard Corporation, and Microcosm Ltd. However, the market is also witnessing increased competition from emerging players and technological innovations. The market's structure is influenced by several factors:
- Technological Innovation: Continuous advancements in cryptography, mobile integration, and biometric authentication are driving market growth. Innovation barriers include high R&D costs and the need for robust security certifications.
- Regulatory Frameworks: Regulations like PSD2 (in Europe) and the FTC's Safeguards Rule (in the US) mandate strong customer authentication (SCA), fueling demand for hardware OTP tokens. Compliance costs and evolving regulations present ongoing challenges.
- Competitive Product Substitutes: Software-based authentication methods (e.g., SMS OTP, push notifications) pose competition, although hardware tokens offer superior security for high-value transactions. Market share for hardware OTPs is estimated at xx% in 2025, projected to reach xx% by 2033.
- End-User Demographics: The increasing adoption of digital banking, e-commerce, and cloud services across various sectors (Banking, Financial Services & Insurance, Government, Healthcare, etc.) significantly expands the target market.
- M&A Trends: The number of M&A deals in the authentication sector has increased in recent years (xx deals in the last 5 years), as larger players acquire smaller firms to expand their product portfolios and market reach.
Hardware OTP Token Authentication Industry Growth Trends & Insights
The Hardware OTP Token Authentication market experienced robust growth during the historical period (2019-2024), with a CAGR of xx%. This growth is primarily driven by increasing concerns regarding data security breaches and the rising adoption of multi-factor authentication (MFA) across diverse end-user industries. The market size in 2024 was estimated at xx million units and is projected to reach xx million units by 2033, exhibiting a CAGR of xx% during the forecast period (2025-2033). This growth is fueled by:
- Increased adoption of MFA: Businesses are increasingly adopting MFA to enhance security and comply with regulatory mandates.
- Growing demand for secure access solutions: The proliferation of remote work and cloud-based applications intensifies the demand for robust authentication methods.
- Technological advancements: Innovations in hardware OTP technology, like contactless and biometric integration, contribute to increased user convenience and adoption rates.
- Market penetration of hardware OTPs is expected to increase from xx% in 2025 to xx% by 2033.
Dominant Regions, Countries, or Segments in Hardware OTP Token Authentication Industry
North America and Europe currently dominate the Hardware OTP Token Authentication market, driven by strong regulatory frameworks, high technological adoption rates, and a large concentration of financial institutions and government agencies. Within end-user industries, Banking, Financial Services & Insurance (BFSI) holds the largest market share, owing to stringent security requirements and high transaction volumes.
- Key Drivers for North America: Stringent data privacy regulations, high digital adoption, and robust IT infrastructure.
- Key Drivers for Europe: PSD2 compliance requirements, increasing digitalization across sectors, and strong government support for cybersecurity initiatives.
- Growth Potential: Asia-Pacific presents significant growth opportunities driven by increasing digitalization and rising e-commerce activity. Market penetration in the region is expected to accelerate in the coming years.
- BFSI Segment Dominance: BFSI remains the leading segment due to stringent security regulations and the high value of transactions handled.
Hardware OTP Token Authentication Industry Product Landscape
Hardware OTP tokens are available in various forms, including connected, disconnected, and contactless devices. Recent innovations focus on improving user experience through mobile integration, biometric authentication, and enhanced security features. Contactless tokens are gaining popularity due to their convenience and ease of use. Manufacturers are continuously enhancing security features, such as incorporating advanced cryptographic algorithms and tamper-resistant hardware, to address evolving security threats.
Key Drivers, Barriers & Challenges in Hardware OTP Token Authentication Industry
Key Drivers:
- Rising cybersecurity threats and data breaches are driving adoption of hardware OTP tokens for enhanced security.
- Stringent regulatory compliance mandates for MFA are fueling demand.
- Increasing adoption of cloud-based applications and remote work necessitates stronger authentication mechanisms.
Challenges & Restraints:
- High initial investment costs associated with implementing hardware OTP solutions can deter some organizations, particularly SMEs.
- The complexity of integrating hardware OTP tokens with existing IT infrastructure can pose challenges.
- Competition from software-based authentication methods presents a challenge to market growth.
Emerging Opportunities in Hardware OTP Token Authentication Industry
- Expanding into untapped markets in developing economies with rising digital adoption rates.
- Integrating biometric authentication features for enhanced security and user experience.
- Developing innovative applications for IoT devices and other emerging technologies.
- Leveraging blockchain technology to improve trust and security.
Growth Accelerators in the Hardware OTP Token Authentication Industry
Technological breakthroughs, such as advancements in biometric authentication and improved security protocols, will significantly fuel market growth. Strategic partnerships between hardware vendors and software providers will expand market reach and integration capabilities. Market expansion strategies targeting emerging economies and new applications, particularly in the IoT sector, will unlock significant growth potential.
Key Players Shaping the Hardware OTP Token Authentication Industry Market
- One Identity LLC
- Authenex Inc
- VASCO Data Security International Inc
- swIDch
- Thales Group (Gemalto NV)
- Dell Technologies Inc
- Broadcom Inc (Symantec Corporation)
- RSA Security LLC
- SurepassID Corp
- Entrust Datacard Corporation
- Microcosm Ltd
Notable Milestones in Hardware OTP Token Authentication Industry Sector
- October 2022: swIDch launched Tap-OTAC, a new user authentication factor enhancing MFA compliance (PSD2 SCA, FTC Safeguards Rule).
- May 2022: TeleSign released Silent Verification, a fast and secure mobile authentication solution.
In-Depth Hardware OTP Token Authentication Industry Market Outlook
The future of the Hardware OTP Token Authentication market is promising, driven by continuing technological advancements, regulatory pressures, and the growing need for enhanced security. Strategic partnerships, expansion into untapped markets, and the development of innovative applications will further accelerate market growth. The focus on user-friendly interfaces and seamless integration with existing systems will be crucial for driving wider adoption and maximizing market potential.
Hardware OTP Token Authentication Industry Segmentation
-
1. Type
- 1.1. Connected
- 1.2. Disconnected
- 1.3. Contactless
-
2. End-user Industry
- 2.1. Banking, Financial Services & Insurance
- 2.2. Government
- 2.3. Enterprise Security
- 2.4. Healthcare
- 2.5. Other End-user Industries
Hardware OTP Token Authentication Industry Segmentation By Geography
- 1. North America
- 2. Europe
- 3. Asia Pacific
- 4. Latin America
- 5. Middle East
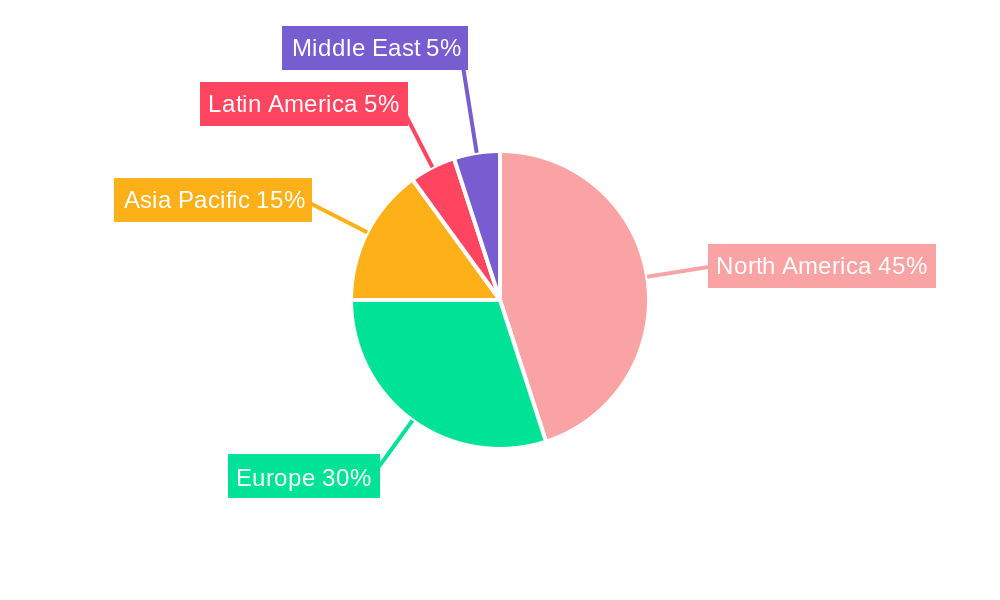
Hardware OTP Token Authentication Industry Regional Market Share
Geographic Coverage of Hardware OTP Token Authentication Industry
Hardware OTP Token Authentication Industry REPORT HIGHLIGHTS
| Aspects | Details |
|---|---|
| Study Period | 2020-2034 |
| Base Year | 2025 |
| Estimated Year | 2026 |
| Forecast Period | 2026-2034 |
| Historical Period | 2020-2025 |
| Growth Rate | CAGR of 7.50% from 2020-2034 |
| Segmentation |
|
Table of Contents
- 1. Introduction
- 1.1. Research Scope
- 1.2. Market Segmentation
- 1.3. Research Objective
- 1.4. Definitions and Assumptions
- 2. Executive Summary
- 2.1. Market Snapshot
- 3. Market Dynamics
- 3.1. Market Drivers
- 3.2. Market Restrains
- 3.3. Market Trends
- 3.4. Market Opportunities
- 4. Market Factor Analysis
- 4.1. Porters Five Forces
- 4.1.1. Bargaining Power of Suppliers
- 4.1.2. Bargaining Power of Buyers
- 4.1.3. Threat of New Entrants
- 4.1.4. Threat of Substitutes
- 4.1.5. Competitive Rivalry
- 4.2. PESTEL analysis
- 4.3. BCG Analysis
- 4.3.1. Stars (High Growth, High Market Share)
- 4.3.2. Cash Cows (Low Growth, High Market Share)
- 4.3.3. Question Mark (High Growth, Low Market Share)
- 4.3.4. Dogs (Low Growth, Low Market Share)
- 4.4. Ansoff Matrix Analysis
- 4.5. Supply Chain Analysis
- 4.6. Regulatory Landscape
- 4.7. Current Market Potential and Opportunity Assessment (TAM–SAM–SOM Framework)
- 4.8. VDR Analyst Note
- 4.1. Porters Five Forces
- 5. Market Analysis, Insights and Forecast 2021-2033
- 5.1. Market Analysis, Insights and Forecast - by Type
- 5.1.1. Connected
- 5.1.2. Disconnected
- 5.1.3. Contactless
- 5.2. Market Analysis, Insights and Forecast - by End-user Industry
- 5.2.1. Banking, Financial Services & Insurance
- 5.2.2. Government
- 5.2.3. Enterprise Security
- 5.2.4. Healthcare
- 5.2.5. Other End-user Industries
- 5.3. Market Analysis, Insights and Forecast - by Region
- 5.3.1. North America
- 5.3.2. Europe
- 5.3.3. Asia Pacific
- 5.3.4. Latin America
- 5.3.5. Middle East
- 5.1. Market Analysis, Insights and Forecast - by Type
- 6. Global Hardware OTP Token Authentication Industry Analysis, Insights and Forecast, 2021-2033
- 6.1. Market Analysis, Insights and Forecast - by Type
- 6.1.1. Connected
- 6.1.2. Disconnected
- 6.1.3. Contactless
- 6.2. Market Analysis, Insights and Forecast - by End-user Industry
- 6.2.1. Banking, Financial Services & Insurance
- 6.2.2. Government
- 6.2.3. Enterprise Security
- 6.2.4. Healthcare
- 6.2.5. Other End-user Industries
- 6.1. Market Analysis, Insights and Forecast - by Type
- 7. North America Hardware OTP Token Authentication Industry Analysis, Insights and Forecast, 2021-2033
- 7.1. Market Analysis, Insights and Forecast - by Type
- 7.1.1. Connected
- 7.1.2. Disconnected
- 7.1.3. Contactless
- 7.2. Market Analysis, Insights and Forecast - by End-user Industry
- 7.2.1. Banking, Financial Services & Insurance
- 7.2.2. Government
- 7.2.3. Enterprise Security
- 7.2.4. Healthcare
- 7.2.5. Other End-user Industries
- 7.1. Market Analysis, Insights and Forecast - by Type
- 8. Europe Hardware OTP Token Authentication Industry Analysis, Insights and Forecast, 2021-2033
- 8.1. Market Analysis, Insights and Forecast - by Type
- 8.1.1. Connected
- 8.1.2. Disconnected
- 8.1.3. Contactless
- 8.2. Market Analysis, Insights and Forecast - by End-user Industry
- 8.2.1. Banking, Financial Services & Insurance
- 8.2.2. Government
- 8.2.3. Enterprise Security
- 8.2.4. Healthcare
- 8.2.5. Other End-user Industries
- 8.1. Market Analysis, Insights and Forecast - by Type
- 9. Asia Pacific Hardware OTP Token Authentication Industry Analysis, Insights and Forecast, 2021-2033
- 9.1. Market Analysis, Insights and Forecast - by Type
- 9.1.1. Connected
- 9.1.2. Disconnected
- 9.1.3. Contactless
- 9.2. Market Analysis, Insights and Forecast - by End-user Industry
- 9.2.1. Banking, Financial Services & Insurance
- 9.2.2. Government
- 9.2.3. Enterprise Security
- 9.2.4. Healthcare
- 9.2.5. Other End-user Industries
- 9.1. Market Analysis, Insights and Forecast - by Type
- 10. Latin America Hardware OTP Token Authentication Industry Analysis, Insights and Forecast, 2021-2033
- 10.1. Market Analysis, Insights and Forecast - by Type
- 10.1.1. Connected
- 10.1.2. Disconnected
- 10.1.3. Contactless
- 10.2. Market Analysis, Insights and Forecast - by End-user Industry
- 10.2.1. Banking, Financial Services & Insurance
- 10.2.2. Government
- 10.2.3. Enterprise Security
- 10.2.4. Healthcare
- 10.2.5. Other End-user Industries
- 10.1. Market Analysis, Insights and Forecast - by Type
- 11. Middle East Hardware OTP Token Authentication Industry Analysis, Insights and Forecast, 2021-2033
- 11.1. Market Analysis, Insights and Forecast - by Type
- 11.1.1. Connected
- 11.1.2. Disconnected
- 11.1.3. Contactless
- 11.2. Market Analysis, Insights and Forecast - by End-user Industry
- 11.2.1. Banking, Financial Services & Insurance
- 11.2.2. Government
- 11.2.3. Enterprise Security
- 11.2.4. Healthcare
- 11.2.5. Other End-user Industries
- 11.1. Market Analysis, Insights and Forecast - by Type
- 12. Competitive Analysis
- 12.1. Company Profiles
- 12.1.1 One Identity LLC
- 12.1.1.1. Company Overview
- 12.1.1.2. Products
- 12.1.1.3. Company Financials
- 12.1.1.4. SWOT Analysis
- 12.1.2 Authenex Inc
- 12.1.2.1. Company Overview
- 12.1.2.2. Products
- 12.1.2.3. Company Financials
- 12.1.2.4. SWOT Analysis
- 12.1.3 VASCO Data Security International Inc
- 12.1.3.1. Company Overview
- 12.1.3.2. Products
- 12.1.3.3. Company Financials
- 12.1.3.4. SWOT Analysis
- 12.1.4 swIDch*List Not Exhaustive
- 12.1.4.1. Company Overview
- 12.1.4.2. Products
- 12.1.4.3. Company Financials
- 12.1.4.4. SWOT Analysis
- 12.1.5 Thales Group (Gemalto NV)
- 12.1.5.1. Company Overview
- 12.1.5.2. Products
- 12.1.5.3. Company Financials
- 12.1.5.4. SWOT Analysis
- 12.1.6 Dell Technologies Inc
- 12.1.6.1. Company Overview
- 12.1.6.2. Products
- 12.1.6.3. Company Financials
- 12.1.6.4. SWOT Analysis
- 12.1.7 Broadcom Inc (Symantec Corporation)
- 12.1.7.1. Company Overview
- 12.1.7.2. Products
- 12.1.7.3. Company Financials
- 12.1.7.4. SWOT Analysis
- 12.1.8 RSA Security LLC
- 12.1.8.1. Company Overview
- 12.1.8.2. Products
- 12.1.8.3. Company Financials
- 12.1.8.4. SWOT Analysis
- 12.1.9 SurepassID Corp
- 12.1.9.1. Company Overview
- 12.1.9.2. Products
- 12.1.9.3. Company Financials
- 12.1.9.4. SWOT Analysis
- 12.1.10 Entrust Datacard Corporation
- 12.1.10.1. Company Overview
- 12.1.10.2. Products
- 12.1.10.3. Company Financials
- 12.1.10.4. SWOT Analysis
- 12.1.11 Microcosm Ltd
- 12.1.11.1. Company Overview
- 12.1.11.2. Products
- 12.1.11.3. Company Financials
- 12.1.11.4. SWOT Analysis
- 12.1.1 One Identity LLC
- 12.2. Market Entropy
- 12.2.1 Company's Key Areas Served
- 12.2.2 Recent Developments
- 12.3. Company Market Share Analysis 2025
- 12.3.1 Top 5 Companies Market Share Analysis
- 12.3.2 Top 3 Companies Market Share Analysis
- 12.4. List of Potential Customers
- 13. Research Methodology
List of Figures
- Figure 1: Global Hardware OTP Token Authentication Industry Revenue Breakdown (Million, %) by Region 2025 & 2033
- Figure 2: North America Hardware OTP Token Authentication Industry Revenue (Million), by Type 2025 & 2033
- Figure 3: North America Hardware OTP Token Authentication Industry Revenue Share (%), by Type 2025 & 2033
- Figure 4: North America Hardware OTP Token Authentication Industry Revenue (Million), by End-user Industry 2025 & 2033
- Figure 5: North America Hardware OTP Token Authentication Industry Revenue Share (%), by End-user Industry 2025 & 2033
- Figure 6: North America Hardware OTP Token Authentication Industry Revenue (Million), by Country 2025 & 2033
- Figure 7: North America Hardware OTP Token Authentication Industry Revenue Share (%), by Country 2025 & 2033
- Figure 8: Europe Hardware OTP Token Authentication Industry Revenue (Million), by Type 2025 & 2033
- Figure 9: Europe Hardware OTP Token Authentication Industry Revenue Share (%), by Type 2025 & 2033
- Figure 10: Europe Hardware OTP Token Authentication Industry Revenue (Million), by End-user Industry 2025 & 2033
- Figure 11: Europe Hardware OTP Token Authentication Industry Revenue Share (%), by End-user Industry 2025 & 2033
- Figure 12: Europe Hardware OTP Token Authentication Industry Revenue (Million), by Country 2025 & 2033
- Figure 13: Europe Hardware OTP Token Authentication Industry Revenue Share (%), by Country 2025 & 2033
- Figure 14: Asia Pacific Hardware OTP Token Authentication Industry Revenue (Million), by Type 2025 & 2033
- Figure 15: Asia Pacific Hardware OTP Token Authentication Industry Revenue Share (%), by Type 2025 & 2033
- Figure 16: Asia Pacific Hardware OTP Token Authentication Industry Revenue (Million), by End-user Industry 2025 & 2033
- Figure 17: Asia Pacific Hardware OTP Token Authentication Industry Revenue Share (%), by End-user Industry 2025 & 2033
- Figure 18: Asia Pacific Hardware OTP Token Authentication Industry Revenue (Million), by Country 2025 & 2033
- Figure 19: Asia Pacific Hardware OTP Token Authentication Industry Revenue Share (%), by Country 2025 & 2033
- Figure 20: Latin America Hardware OTP Token Authentication Industry Revenue (Million), by Type 2025 & 2033
- Figure 21: Latin America Hardware OTP Token Authentication Industry Revenue Share (%), by Type 2025 & 2033
- Figure 22: Latin America Hardware OTP Token Authentication Industry Revenue (Million), by End-user Industry 2025 & 2033
- Figure 23: Latin America Hardware OTP Token Authentication Industry Revenue Share (%), by End-user Industry 2025 & 2033
- Figure 24: Latin America Hardware OTP Token Authentication Industry Revenue (Million), by Country 2025 & 2033
- Figure 25: Latin America Hardware OTP Token Authentication Industry Revenue Share (%), by Country 2025 & 2033
- Figure 26: Middle East Hardware OTP Token Authentication Industry Revenue (Million), by Type 2025 & 2033
- Figure 27: Middle East Hardware OTP Token Authentication Industry Revenue Share (%), by Type 2025 & 2033
- Figure 28: Middle East Hardware OTP Token Authentication Industry Revenue (Million), by End-user Industry 2025 & 2033
- Figure 29: Middle East Hardware OTP Token Authentication Industry Revenue Share (%), by End-user Industry 2025 & 2033
- Figure 30: Middle East Hardware OTP Token Authentication Industry Revenue (Million), by Country 2025 & 2033
- Figure 31: Middle East Hardware OTP Token Authentication Industry Revenue Share (%), by Country 2025 & 2033
List of Tables
- Table 1: Global Hardware OTP Token Authentication Industry Revenue Million Forecast, by Type 2020 & 2033
- Table 2: Global Hardware OTP Token Authentication Industry Revenue Million Forecast, by End-user Industry 2020 & 2033
- Table 3: Global Hardware OTP Token Authentication Industry Revenue Million Forecast, by Region 2020 & 2033
- Table 4: Global Hardware OTP Token Authentication Industry Revenue Million Forecast, by Type 2020 & 2033
- Table 5: Global Hardware OTP Token Authentication Industry Revenue Million Forecast, by End-user Industry 2020 & 2033
- Table 6: Global Hardware OTP Token Authentication Industry Revenue Million Forecast, by Country 2020 & 2033
- Table 7: Global Hardware OTP Token Authentication Industry Revenue Million Forecast, by Type 2020 & 2033
- Table 8: Global Hardware OTP Token Authentication Industry Revenue Million Forecast, by End-user Industry 2020 & 2033
- Table 9: Global Hardware OTP Token Authentication Industry Revenue Million Forecast, by Country 2020 & 2033
- Table 10: Global Hardware OTP Token Authentication Industry Revenue Million Forecast, by Type 2020 & 2033
- Table 11: Global Hardware OTP Token Authentication Industry Revenue Million Forecast, by End-user Industry 2020 & 2033
- Table 12: Global Hardware OTP Token Authentication Industry Revenue Million Forecast, by Country 2020 & 2033
- Table 13: Global Hardware OTP Token Authentication Industry Revenue Million Forecast, by Type 2020 & 2033
- Table 14: Global Hardware OTP Token Authentication Industry Revenue Million Forecast, by End-user Industry 2020 & 2033
- Table 15: Global Hardware OTP Token Authentication Industry Revenue Million Forecast, by Country 2020 & 2033
- Table 16: Global Hardware OTP Token Authentication Industry Revenue Million Forecast, by Type 2020 & 2033
- Table 17: Global Hardware OTP Token Authentication Industry Revenue Million Forecast, by End-user Industry 2020 & 2033
- Table 18: Global Hardware OTP Token Authentication Industry Revenue Million Forecast, by Country 2020 & 2033
Frequently Asked Questions
1. What is the projected Compound Annual Growth Rate (CAGR) of the Hardware OTP Token Authentication Industry?
The projected CAGR is approximately 7.50%.
2. Which companies are prominent players in the Hardware OTP Token Authentication Industry?
Key companies in the market include One Identity LLC, Authenex Inc, VASCO Data Security International Inc, swIDch*List Not Exhaustive, Thales Group (Gemalto NV), Dell Technologies Inc, Broadcom Inc (Symantec Corporation), RSA Security LLC, SurepassID Corp, Entrust Datacard Corporation, Microcosm Ltd.
3. What are the main segments of the Hardware OTP Token Authentication Industry?
The market segments include Type, End-user Industry.
4. Can you provide details about the market size?
The market size is estimated to be USD XX Million as of 2022.
5. What are some drivers contributing to market growth?
Growing Number of Internet-based Transactions; Increasing Investments from Banking and Finance Industry.
6. What are the notable trends driving market growth?
Disconnected Hardware OTP Token Authentication to Hold Significant Market Share.
7. Are there any restraints impacting market growth?
; Alternative Protocols. such as Bluetooth. Wi-Fi. and Z-Wave. Among Others.
8. Can you provide examples of recent developments in the market?
October 2022 - swIDch introduced an entirely new user authentication factor with the Tap-OTAC solution. Tap-OTAC serves as an empowering option to satisfy Multi-Factor Authentication (MFA) requirements, such as PSD2 Strong Customer Authentication (SCA) from Europe and FTC's Safeguards Rule from the United States. Moreover, the Tap-OTAC solution can be straightforwardly applied to a wide variety of smart cards, such as bank debit cards, credit cards, or even building access cards. Users benefit from both the enhanced security of hardware OTP (hardware token) and the convenience of mobile OTP.
9. What pricing options are available for accessing the report?
Pricing options include single-user, multi-user, and enterprise licenses priced at USD 4750, USD 5250, and USD 8750 respectively.
10. Is the market size provided in terms of value or volume?
The market size is provided in terms of value, measured in Million.
11. Are there any specific market keywords associated with the report?
Yes, the market keyword associated with the report is "Hardware OTP Token Authentication Industry," which aids in identifying and referencing the specific market segment covered.
12. How do I determine which pricing option suits my needs best?
The pricing options vary based on user requirements and access needs. Individual users may opt for single-user licenses, while businesses requiring broader access may choose multi-user or enterprise licenses for cost-effective access to the report.
13. Are there any additional resources or data provided in the Hardware OTP Token Authentication Industry report?
While the report offers comprehensive insights, it's advisable to review the specific contents or supplementary materials provided to ascertain if additional resources or data are available.
14. How can I stay updated on further developments or reports in the Hardware OTP Token Authentication Industry?
To stay informed about further developments, trends, and reports in the Hardware OTP Token Authentication Industry, consider subscribing to industry newsletters, following relevant companies and organizations, or regularly checking reputable industry news sources and publications.
Methodology
Step 1 - Identification of Relevant Samples Size from Population Database


Step 2 - Approaches for Defining Global Market Size (Value, Volume* & Price*)

Note*: In applicable scenarios
Step 3 - Data Sources
Primary Research
- Web Analytics
- Survey Reports
- Research Institute
- Latest Research Reports
- Opinion Leaders
Secondary Research
- Annual Reports
- White Paper
- Latest Press Release
- Industry Association
- Paid Database
- Investor Presentations

Step 4 - Data Triangulation
Involves using different sources of information in order to increase the validity of a study
These sources are likely to be stakeholders in a program - participants, other researchers, program staff, other community members, and so on.
Then we put all data in single framework & apply various statistical tools to find out the dynamic on the market.
During the analysis stage, feedback from the stakeholder groups would be compared to determine areas of agreement as well as areas of divergence