
Key Insights
The connected logistics market is experiencing robust growth, driven by the increasing adoption of IoT devices, advanced analytics, and the need for enhanced supply chain visibility and efficiency. A compound annual growth rate (CAGR) of 17.50% from 2019 to 2024 suggests a significant expansion, and this momentum is expected to continue through 2033. Key drivers include the rising demand for real-time tracking and monitoring of goods, improved inventory management, optimized routing and scheduling, and the need to reduce operational costs. The integration of various technologies such as asset tracking, warehouse IoT, and data analytics platforms empowers businesses to make data-driven decisions, leading to streamlined operations and reduced delays. Furthermore, the increasing prevalence of e-commerce and the need for faster delivery times are fueling the demand for connected logistics solutions. Growth is observed across various segments, including asset management software, device management solutions, and applications within the automotive, manufacturing, and retail sectors. While challenges such as high initial investment costs and cybersecurity concerns exist, the long-term benefits of enhanced efficiency and improved supply chain resilience are outweighing these restraints.
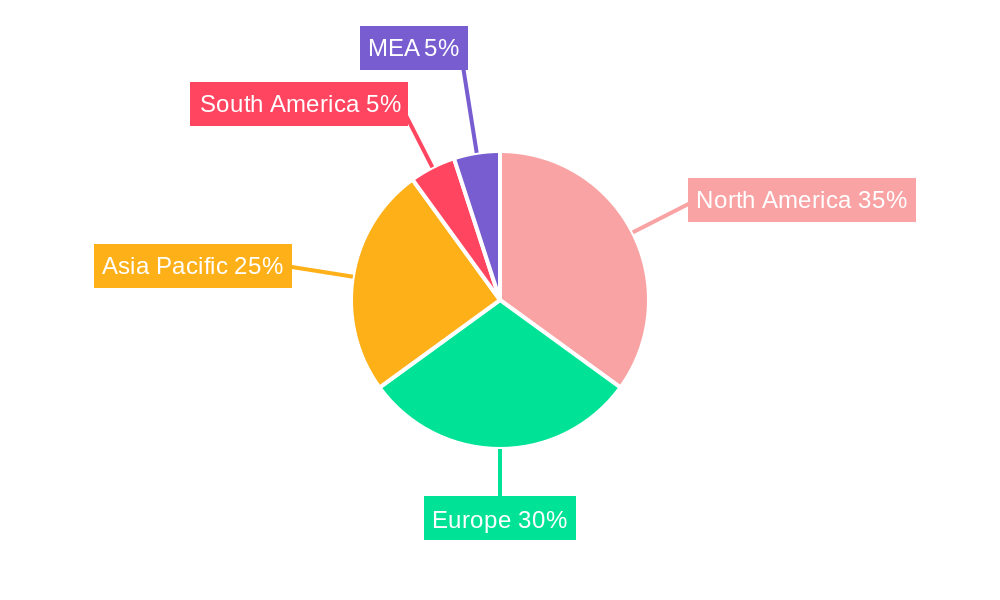
The geographical distribution of this growth is diverse, with North America and Europe currently holding significant market shares. However, the Asia-Pacific region is poised for substantial expansion due to rapid industrialization and the growing e-commerce market in countries like China and India. The adoption of connected logistics solutions varies across transportation modes, with roadways currently dominating, followed by railways and airways. However, the maritime sector is also witnessing increasing adoption, driven by the need for improved tracking and monitoring of shipments across international waters. Leading players in the connected logistics market are strategically investing in research and development to enhance their offerings, driving innovation and competition within the sector. This competitive landscape fosters the development of more sophisticated and user-friendly solutions, further accelerating market growth.
Connected Logistics Industry Market Report: 2019-2033
This comprehensive report provides a detailed analysis of the Connected Logistics industry, encompassing market dynamics, growth trends, regional dominance, product landscape, key players, and future outlook. The study period spans from 2019 to 2033, with 2025 as the base and estimated year. The report leverages extensive data analysis to offer actionable insights for industry professionals, investors, and strategic decision-makers. The parent market is the broader Logistics industry, with Connected Logistics as the child market focusing on the integration of technology for enhanced efficiency and visibility. The market size is valued in Million USD units.
Connected Logistics Industry Market Dynamics & Structure
The Connected Logistics market is characterized by moderate concentration, with a few major players holding significant market share (estimated at xx% combined in 2025). Technological innovation, particularly in areas like AI, IoT, and big data analytics, is a primary growth driver. Stringent regulatory frameworks related to data security and transportation compliance influence market dynamics. Competitive substitutes include traditional logistics solutions lacking advanced connectivity features. End-user demographics are shifting towards greater adoption of digital technologies across various sectors. M&A activity has been significant, with a notable increase in deal volume since 2019 (estimated at xx deals annually in 2024).
- Market Concentration: Moderately concentrated, with top 5 players holding xx% market share in 2025.
- Technological Innovation: AI, IoT, and blockchain are key drivers, enabling real-time tracking, predictive analytics, and improved supply chain optimization.
- Regulatory Landscape: Data privacy regulations (e.g., GDPR) and transportation safety standards shape market development.
- Competitive Substitutes: Traditional logistics providers without digital solutions pose some competitive threat, although it is decreasing.
- End-User Demographics: Growing adoption across various industries, particularly in manufacturing, retail, and healthcare.
- M&A Trends: Significant increase in M&A activities, reflecting industry consolidation and expansion. 2024 saw xx acquisitions, xx mergers.
Connected Logistics Industry Growth Trends & Insights
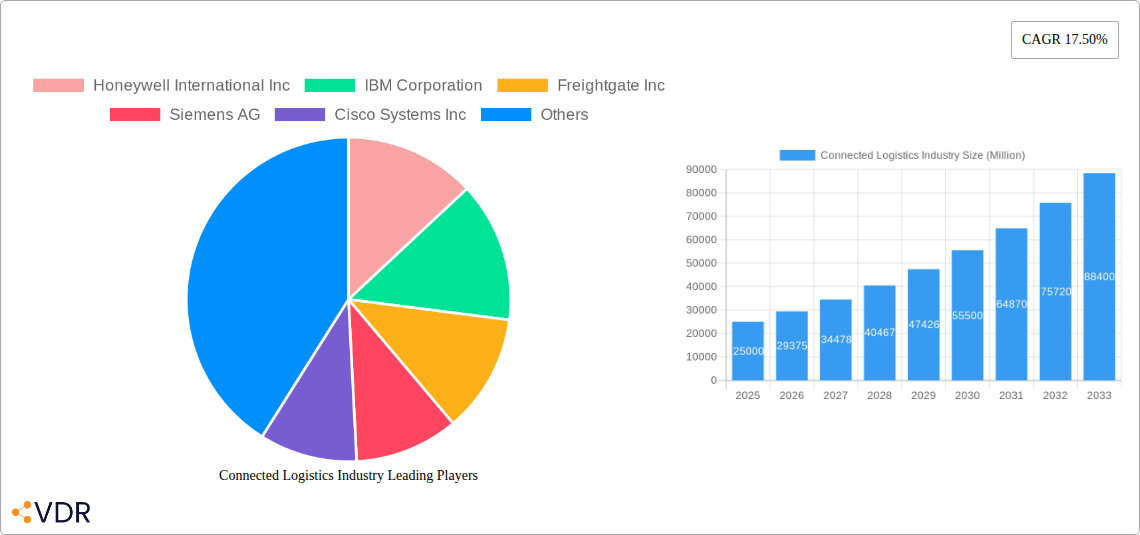
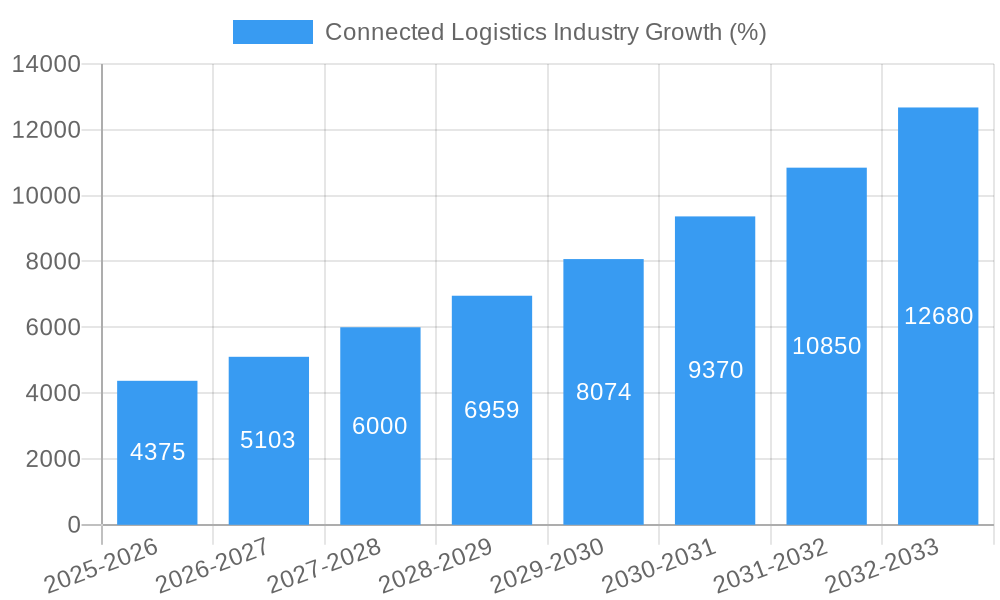
The Connected Logistics market exhibits robust growth, driven by the increasing adoption of digital technologies across supply chains. The market size expanded from xx Million USD in 2019 to xx Million USD in 2024 and is projected to reach xx Million USD by 2033, exhibiting a CAGR of xx% during the forecast period (2025-2033). This growth reflects increasing market penetration of connected logistics solutions, particularly among large enterprises. Technological disruptions, such as the emergence of 5G and edge computing, further accelerate adoption. Shifts in consumer behavior, including the demand for faster and more transparent delivery, are also contributing factors.
Dominant Regions, Countries, or Segments in Connected Logistics Industry
North America currently holds the largest market share in Connected Logistics, driven by early adoption of advanced technologies and a robust IT infrastructure. However, Asia-Pacific is projected to experience the fastest growth rate due to rapid industrialization and increasing investment in digital infrastructure. Within segments, Asset Management and Warehouse IoT solutions dominate by software type, while Device Management and Connectivity Management are leading in product type. Roadways account for the largest transportation mode share, followed by Seaways. Automotive, Manufacturing, and Retail are the top end-user industries.
- Leading Region: North America (Market share of xx% in 2025)
- Fastest-Growing Region: Asia-Pacific (Projected CAGR of xx% during 2025-2033)
- Dominant Software Segment: Asset Management and Warehouse IoT (Combined share of xx% in 2025)
- Dominant Product Segment: Device Management and Connectivity Management (Combined share of xx% in 2025)
- Dominant Transportation Mode: Roadways (Market share of xx% in 2025)
- Dominant End-User Industry: Automotive, Manufacturing, Retail (Combined share of xx% in 2025)
Connected Logistics Industry Product Landscape
The Connected Logistics product landscape is constantly evolving, with innovations focusing on enhancing real-time visibility, predictive analytics, and automation capabilities. New products are emerging, integrating advanced technologies like AI, machine learning, and blockchain for improved efficiency, security, and cost optimization. Unique selling propositions include seamless integration with existing systems, enhanced data security features, and superior analytical capabilities. Technological advancements such as the deployment of low-power wide-area networks (LPWAN) and improved sensor technology drive improvements in tracking accuracy and battery life.
Key Drivers, Barriers & Challenges in Connected Logistics Industry
Key Drivers:
- Growing demand for real-time supply chain visibility.
- Increasing adoption of IoT and AI in logistics.
- Rising need for efficient and cost-effective logistics solutions.
- Government initiatives promoting digitalization in the logistics sector.
Key Barriers and Challenges:
- High implementation costs associated with implementing advanced technologies.
- Data security concerns and the risk of cyberattacks.
- Lack of standardization and interoperability among different systems.
- Regulatory hurdles and compliance requirements. An estimated xx% of companies face significant delays due to regulatory issues, resulting in an annual cost of xx Million USD.
Emerging Opportunities in Connected Logistics Industry
- Expansion into untapped markets, particularly in developing economies.
- Development of innovative applications leveraging AI and machine learning.
- Growing demand for sustainable and environmentally friendly logistics solutions.
- Increasing focus on improving last-mile delivery efficiency.
Growth Accelerators in the Connected Logistics Industry
Strategic partnerships between technology providers and logistics companies are key growth catalysts. Technological breakthroughs in areas like autonomous vehicles and drone delivery offer significant potential for disrupting the industry. Expansion into new geographic markets and the development of tailored solutions for specific industries will also drive growth. Government initiatives promoting digitalization and infrastructure development further accelerate market expansion.
Key Players Shaping the Connected Logistics Industry Market
- Honeywell International Inc
- IBM Corporation
- Freightgate Inc
- Siemens AG
- Cisco Systems Inc
- Microsoft Corporation
- Oracle Corporation
- Bosch Service Solutions GmbH
- Orbcomm Inc
- AT&T Inc
- HCL Technologies Limited
- SAP SE
- Intel Corporation
Notable Milestones in Connected Logistics Industry Sector
- May 2020: E2open acquires BluJay Solutions for approximately USD 1.7 billion, significantly impacting market consolidation.
- June 2021: Holisol Logistics secures USD 3 million in debt financing to expand its E2E supply chain solutions, demonstrating investor confidence in the sector.
In-Depth Connected Logistics Industry Market Outlook
The Connected Logistics market is poised for sustained growth over the next decade, driven by ongoing technological advancements and increasing industry adoption. Strategic partnerships, investments in infrastructure, and government support will further fuel market expansion. The focus on enhancing supply chain resilience and efficiency, coupled with the growing demand for sustainable solutions, presents significant strategic opportunities for businesses operating in this dynamic sector. The market is expected to reach xx Million USD by 2033, with continued growth in all major regions and segments.
Connected Logistics Industry Segmentation
-
1. Software
- 1.1. Asset Management
- 1.2. Warehouse IoT
- 1.3. Security
- 1.4. Data Management
- 1.5. Network Management
- 1.6. Streaming Analytics
-
2. Product Type
- 2.1. Device Management
- 2.2. Application Management
- 2.3. Connectivity Management
-
3. Transportation Mode
- 3.1. Roadways
- 3.2. Railways
- 3.3. Airways
- 3.4. Seaways
-
4. End-user Industry
- 4.1. Automotive
- 4.2. Manufacturing
- 4.3. Oil and Gas
- 4.4. IT & Telecom
- 4.5. Healthcare
- 4.6. IT and Telecommunication
- 4.7. Retail
- 4.8. Food and Beverage
- 4.9. Other End-user Industries
Connected Logistics Industry Segmentation By Geography
-
1. North America
- 1.1. United States
- 1.2. Canada
-
2. Europe
- 2.1. United Kingdom
- 2.2. Germany
- 2.3. France
-
3. Asia
- 3.1. China
- 3.2. Japan
- 3.3. India
- 4. Australia and New Zealand
- 5. Latin America
- 6. Middle East and Africa
Connected Logistics Industry REPORT HIGHLIGHTS
| Aspects | Details |
|---|---|
| Study Period | 2019-2033 |
| Base Year | 2024 |
| Estimated Year | 2025 |
| Forecast Period | 2025-2033 |
| Historical Period | 2019-2024 |
| Growth Rate | CAGR of 17.50% from 2019-2033 |
| Segmentation |
|
Table of Contents
- 1. Introduction
- 1.1. Research Scope
- 1.2. Market Segmentation
- 1.3. Research Methodology
- 1.4. Definitions and Assumptions
- 2. Executive Summary
- 2.1. Introduction
- 3. Market Dynamics
- 3.1. Introduction
- 3.2. Market Drivers
- 3.2.1. Increasing Adoption on IoT in various Industries; Adoption of Sensor Based Technologies
- 3.3. Market Restrains
- 3.3.1. Lack of Uniform Government Regulations for Smart Technologies; Coronavirus Outbreak Influencing Electronic Industry
- 3.4. Market Trends
- 3.4.1. Increasing use of IoT and future technologies in different industries will drive the adoption of Connected Logistics
- 4. Market Factor Analysis
- 4.1. Porters Five Forces
- 4.2. Supply/Value Chain
- 4.3. PESTEL analysis
- 4.4. Market Entropy
- 4.5. Patent/Trademark Analysis
- 5. Global Connected Logistics Industry Analysis, Insights and Forecast, 2019-2031
- 5.1. Market Analysis, Insights and Forecast - by Software
- 5.1.1. Asset Management
- 5.1.2. Warehouse IoT
- 5.1.3. Security
- 5.1.4. Data Management
- 5.1.5. Network Management
- 5.1.6. Streaming Analytics
- 5.2. Market Analysis, Insights and Forecast - by Product Type
- 5.2.1. Device Management
- 5.2.2. Application Management
- 5.2.3. Connectivity Management
- 5.3. Market Analysis, Insights and Forecast - by Transportation Mode
- 5.3.1. Roadways
- 5.3.2. Railways
- 5.3.3. Airways
- 5.3.4. Seaways
- 5.4. Market Analysis, Insights and Forecast - by End-user Industry
- 5.4.1. Automotive
- 5.4.2. Manufacturing
- 5.4.3. Oil and Gas
- 5.4.4. IT & Telecom
- 5.4.5. Healthcare
- 5.4.6. IT and Telecommunication
- 5.4.7. Retail
- 5.4.8. Food and Beverage
- 5.4.9. Other End-user Industries
- 5.5. Market Analysis, Insights and Forecast - by Region
- 5.5.1. North America
- 5.5.2. Europe
- 5.5.3. Asia
- 5.5.4. Australia and New Zealand
- 5.5.5. Latin America
- 5.5.6. Middle East and Africa
- 5.1. Market Analysis, Insights and Forecast - by Software
- 6. North America Connected Logistics Industry Analysis, Insights and Forecast, 2019-2031
- 6.1. Market Analysis, Insights and Forecast - by Software
- 6.1.1. Asset Management
- 6.1.2. Warehouse IoT
- 6.1.3. Security
- 6.1.4. Data Management
- 6.1.5. Network Management
- 6.1.6. Streaming Analytics
- 6.2. Market Analysis, Insights and Forecast - by Product Type
- 6.2.1. Device Management
- 6.2.2. Application Management
- 6.2.3. Connectivity Management
- 6.3. Market Analysis, Insights and Forecast - by Transportation Mode
- 6.3.1. Roadways
- 6.3.2. Railways
- 6.3.3. Airways
- 6.3.4. Seaways
- 6.4. Market Analysis, Insights and Forecast - by End-user Industry
- 6.4.1. Automotive
- 6.4.2. Manufacturing
- 6.4.3. Oil and Gas
- 6.4.4. IT & Telecom
- 6.4.5. Healthcare
- 6.4.6. IT and Telecommunication
- 6.4.7. Retail
- 6.4.8. Food and Beverage
- 6.4.9. Other End-user Industries
- 6.1. Market Analysis, Insights and Forecast - by Software
- 7. Europe Connected Logistics Industry Analysis, Insights and Forecast, 2019-2031
- 7.1. Market Analysis, Insights and Forecast - by Software
- 7.1.1. Asset Management
- 7.1.2. Warehouse IoT
- 7.1.3. Security
- 7.1.4. Data Management
- 7.1.5. Network Management
- 7.1.6. Streaming Analytics
- 7.2. Market Analysis, Insights and Forecast - by Product Type
- 7.2.1. Device Management
- 7.2.2. Application Management
- 7.2.3. Connectivity Management
- 7.3. Market Analysis, Insights and Forecast - by Transportation Mode
- 7.3.1. Roadways
- 7.3.2. Railways
- 7.3.3. Airways
- 7.3.4. Seaways
- 7.4. Market Analysis, Insights and Forecast - by End-user Industry
- 7.4.1. Automotive
- 7.4.2. Manufacturing
- 7.4.3. Oil and Gas
- 7.4.4. IT & Telecom
- 7.4.5. Healthcare
- 7.4.6. IT and Telecommunication
- 7.4.7. Retail
- 7.4.8. Food and Beverage
- 7.4.9. Other End-user Industries
- 7.1. Market Analysis, Insights and Forecast - by Software
- 8. Asia Connected Logistics Industry Analysis, Insights and Forecast, 2019-2031
- 8.1. Market Analysis, Insights and Forecast - by Software
- 8.1.1. Asset Management
- 8.1.2. Warehouse IoT
- 8.1.3. Security
- 8.1.4. Data Management
- 8.1.5. Network Management
- 8.1.6. Streaming Analytics
- 8.2. Market Analysis, Insights and Forecast - by Product Type
- 8.2.1. Device Management
- 8.2.2. Application Management
- 8.2.3. Connectivity Management
- 8.3. Market Analysis, Insights and Forecast - by Transportation Mode
- 8.3.1. Roadways
- 8.3.2. Railways
- 8.3.3. Airways
- 8.3.4. Seaways
- 8.4. Market Analysis, Insights and Forecast - by End-user Industry
- 8.4.1. Automotive
- 8.4.2. Manufacturing
- 8.4.3. Oil and Gas
- 8.4.4. IT & Telecom
- 8.4.5. Healthcare
- 8.4.6. IT and Telecommunication
- 8.4.7. Retail
- 8.4.8. Food and Beverage
- 8.4.9. Other End-user Industries
- 8.1. Market Analysis, Insights and Forecast - by Software
- 9. Australia and New Zealand Connected Logistics Industry Analysis, Insights and Forecast, 2019-2031
- 9.1. Market Analysis, Insights and Forecast - by Software
- 9.1.1. Asset Management
- 9.1.2. Warehouse IoT
- 9.1.3. Security
- 9.1.4. Data Management
- 9.1.5. Network Management
- 9.1.6. Streaming Analytics
- 9.2. Market Analysis, Insights and Forecast - by Product Type
- 9.2.1. Device Management
- 9.2.2. Application Management
- 9.2.3. Connectivity Management
- 9.3. Market Analysis, Insights and Forecast - by Transportation Mode
- 9.3.1. Roadways
- 9.3.2. Railways
- 9.3.3. Airways
- 9.3.4. Seaways
- 9.4. Market Analysis, Insights and Forecast - by End-user Industry
- 9.4.1. Automotive
- 9.4.2. Manufacturing
- 9.4.3. Oil and Gas
- 9.4.4. IT & Telecom
- 9.4.5. Healthcare
- 9.4.6. IT and Telecommunication
- 9.4.7. Retail
- 9.4.8. Food and Beverage
- 9.4.9. Other End-user Industries
- 9.1. Market Analysis, Insights and Forecast - by Software
- 10. Latin America Connected Logistics Industry Analysis, Insights and Forecast, 2019-2031
- 10.1. Market Analysis, Insights and Forecast - by Software
- 10.1.1. Asset Management
- 10.1.2. Warehouse IoT
- 10.1.3. Security
- 10.1.4. Data Management
- 10.1.5. Network Management
- 10.1.6. Streaming Analytics
- 10.2. Market Analysis, Insights and Forecast - by Product Type
- 10.2.1. Device Management
- 10.2.2. Application Management
- 10.2.3. Connectivity Management
- 10.3. Market Analysis, Insights and Forecast - by Transportation Mode
- 10.3.1. Roadways
- 10.3.2. Railways
- 10.3.3. Airways
- 10.3.4. Seaways
- 10.4. Market Analysis, Insights and Forecast - by End-user Industry
- 10.4.1. Automotive
- 10.4.2. Manufacturing
- 10.4.3. Oil and Gas
- 10.4.4. IT & Telecom
- 10.4.5. Healthcare
- 10.4.6. IT and Telecommunication
- 10.4.7. Retail
- 10.4.8. Food and Beverage
- 10.4.9. Other End-user Industries
- 10.1. Market Analysis, Insights and Forecast - by Software
- 11. Middle East and Africa Connected Logistics Industry Analysis, Insights and Forecast, 2019-2031
- 11.1. Market Analysis, Insights and Forecast - by Software
- 11.1.1. Asset Management
- 11.1.2. Warehouse IoT
- 11.1.3. Security
- 11.1.4. Data Management
- 11.1.5. Network Management
- 11.1.6. Streaming Analytics
- 11.2. Market Analysis, Insights and Forecast - by Product Type
- 11.2.1. Device Management
- 11.2.2. Application Management
- 11.2.3. Connectivity Management
- 11.3. Market Analysis, Insights and Forecast - by Transportation Mode
- 11.3.1. Roadways
- 11.3.2. Railways
- 11.3.3. Airways
- 11.3.4. Seaways
- 11.4. Market Analysis, Insights and Forecast - by End-user Industry
- 11.4.1. Automotive
- 11.4.2. Manufacturing
- 11.4.3. Oil and Gas
- 11.4.4. IT & Telecom
- 11.4.5. Healthcare
- 11.4.6. IT and Telecommunication
- 11.4.7. Retail
- 11.4.8. Food and Beverage
- 11.4.9. Other End-user Industries
- 11.1. Market Analysis, Insights and Forecast - by Software
- 12. North America Connected Logistics Industry Analysis, Insights and Forecast, 2019-2031
- 12.1. Market Analysis, Insights and Forecast - By Country/Sub-region
- 12.1.1 United States
- 12.1.2 Canada
- 12.1.3 Mexico
- 13. Europe Connected Logistics Industry Analysis, Insights and Forecast, 2019-2031
- 13.1. Market Analysis, Insights and Forecast - By Country/Sub-region
- 13.1.1 Germany
- 13.1.2 United Kingdom
- 13.1.3 France
- 13.1.4 Spain
- 13.1.5 Italy
- 13.1.6 Spain
- 13.1.7 Belgium
- 13.1.8 Netherland
- 13.1.9 Nordics
- 13.1.10 Rest of Europe
- 14. Asia Pacific Connected Logistics Industry Analysis, Insights and Forecast, 2019-2031
- 14.1. Market Analysis, Insights and Forecast - By Country/Sub-region
- 14.1.1 China
- 14.1.2 Japan
- 14.1.3 India
- 14.1.4 South Korea
- 14.1.5 Southeast Asia
- 14.1.6 Australia
- 14.1.7 Indonesia
- 14.1.8 Phillipes
- 14.1.9 Singapore
- 14.1.10 Thailandc
- 14.1.11 Rest of Asia Pacific
- 15. South America Connected Logistics Industry Analysis, Insights and Forecast, 2019-2031
- 15.1. Market Analysis, Insights and Forecast - By Country/Sub-region
- 15.1.1 Brazil
- 15.1.2 Argentina
- 15.1.3 Peru
- 15.1.4 Chile
- 15.1.5 Colombia
- 15.1.6 Ecuador
- 15.1.7 Venezuela
- 15.1.8 Rest of South America
- 16. North America Connected Logistics Industry Analysis, Insights and Forecast, 2019-2031
- 16.1. Market Analysis, Insights and Forecast - By Country/Sub-region
- 16.1.1 United States
- 16.1.2 Canada
- 16.1.3 Mexico
- 17. MEA Connected Logistics Industry Analysis, Insights and Forecast, 2019-2031
- 17.1. Market Analysis, Insights and Forecast - By Country/Sub-region
- 17.1.1 United Arab Emirates
- 17.1.2 Saudi Arabia
- 17.1.3 South Africa
- 17.1.4 Rest of Middle East and Africa
- 18. Competitive Analysis
- 18.1. Global Market Share Analysis 2024
- 18.2. Company Profiles
- 18.2.1 Honeywell International Inc
- 18.2.1.1. Overview
- 18.2.1.2. Products
- 18.2.1.3. SWOT Analysis
- 18.2.1.4. Recent Developments
- 18.2.1.5. Financials (Based on Availability)
- 18.2.2 IBM Corporation
- 18.2.2.1. Overview
- 18.2.2.2. Products
- 18.2.2.3. SWOT Analysis
- 18.2.2.4. Recent Developments
- 18.2.2.5. Financials (Based on Availability)
- 18.2.3 Freightgate Inc
- 18.2.3.1. Overview
- 18.2.3.2. Products
- 18.2.3.3. SWOT Analysis
- 18.2.3.4. Recent Developments
- 18.2.3.5. Financials (Based on Availability)
- 18.2.4 Siemens AG
- 18.2.4.1. Overview
- 18.2.4.2. Products
- 18.2.4.3. SWOT Analysis
- 18.2.4.4. Recent Developments
- 18.2.4.5. Financials (Based on Availability)
- 18.2.5 Cisco Systems Inc
- 18.2.5.1. Overview
- 18.2.5.2. Products
- 18.2.5.3. SWOT Analysis
- 18.2.5.4. Recent Developments
- 18.2.5.5. Financials (Based on Availability)
- 18.2.6 Microsoft Corporation
- 18.2.6.1. Overview
- 18.2.6.2. Products
- 18.2.6.3. SWOT Analysis
- 18.2.6.4. Recent Developments
- 18.2.6.5. Financials (Based on Availability)
- 18.2.7 Oracle Corporation
- 18.2.7.1. Overview
- 18.2.7.2. Products
- 18.2.7.3. SWOT Analysis
- 18.2.7.4. Recent Developments
- 18.2.7.5. Financials (Based on Availability)
- 18.2.8 Bosch Service Solutions GmbH
- 18.2.8.1. Overview
- 18.2.8.2. Products
- 18.2.8.3. SWOT Analysis
- 18.2.8.4. Recent Developments
- 18.2.8.5. Financials (Based on Availability)
- 18.2.9 Orbcomm Inc
- 18.2.9.1. Overview
- 18.2.9.2. Products
- 18.2.9.3. SWOT Analysis
- 18.2.9.4. Recent Developments
- 18.2.9.5. Financials (Based on Availability)
- 18.2.10 AT&T Inc
- 18.2.10.1. Overview
- 18.2.10.2. Products
- 18.2.10.3. SWOT Analysis
- 18.2.10.4. Recent Developments
- 18.2.10.5. Financials (Based on Availability)
- 18.2.11 HCL Technologies Limited
- 18.2.11.1. Overview
- 18.2.11.2. Products
- 18.2.11.3. SWOT Analysis
- 18.2.11.4. Recent Developments
- 18.2.11.5. Financials (Based on Availability)
- 18.2.12 SAP SE
- 18.2.12.1. Overview
- 18.2.12.2. Products
- 18.2.12.3. SWOT Analysis
- 18.2.12.4. Recent Developments
- 18.2.12.5. Financials (Based on Availability)
- 18.2.13 Intel Corporation
- 18.2.13.1. Overview
- 18.2.13.2. Products
- 18.2.13.3. SWOT Analysis
- 18.2.13.4. Recent Developments
- 18.2.13.5. Financials (Based on Availability)
- 18.2.1 Honeywell International Inc
List of Figures
- Figure 1: Global Connected Logistics Industry Revenue Breakdown (Million, %) by Region 2024 & 2032
- Figure 2: Global Connected Logistics Industry Volume Breakdown (K Unit, %) by Region 2024 & 2032
- Figure 3: North America Connected Logistics Industry Revenue (Million), by Country 2024 & 2032
- Figure 4: North America Connected Logistics Industry Volume (K Unit), by Country 2024 & 2032
- Figure 5: North America Connected Logistics Industry Revenue Share (%), by Country 2024 & 2032
- Figure 6: North America Connected Logistics Industry Volume Share (%), by Country 2024 & 2032
- Figure 7: Europe Connected Logistics Industry Revenue (Million), by Country 2024 & 2032
- Figure 8: Europe Connected Logistics Industry Volume (K Unit), by Country 2024 & 2032
- Figure 9: Europe Connected Logistics Industry Revenue Share (%), by Country 2024 & 2032
- Figure 10: Europe Connected Logistics Industry Volume Share (%), by Country 2024 & 2032
- Figure 11: Asia Pacific Connected Logistics Industry Revenue (Million), by Country 2024 & 2032
- Figure 12: Asia Pacific Connected Logistics Industry Volume (K Unit), by Country 2024 & 2032
- Figure 13: Asia Pacific Connected Logistics Industry Revenue Share (%), by Country 2024 & 2032
- Figure 14: Asia Pacific Connected Logistics Industry Volume Share (%), by Country 2024 & 2032
- Figure 15: South America Connected Logistics Industry Revenue (Million), by Country 2024 & 2032
- Figure 16: South America Connected Logistics Industry Volume (K Unit), by Country 2024 & 2032
- Figure 17: South America Connected Logistics Industry Revenue Share (%), by Country 2024 & 2032
- Figure 18: South America Connected Logistics Industry Volume Share (%), by Country 2024 & 2032
- Figure 19: North America Connected Logistics Industry Revenue (Million), by Country 2024 & 2032
- Figure 20: North America Connected Logistics Industry Volume (K Unit), by Country 2024 & 2032
- Figure 21: North America Connected Logistics Industry Revenue Share (%), by Country 2024 & 2032
- Figure 22: North America Connected Logistics Industry Volume Share (%), by Country 2024 & 2032
- Figure 23: MEA Connected Logistics Industry Revenue (Million), by Country 2024 & 2032
- Figure 24: MEA Connected Logistics Industry Volume (K Unit), by Country 2024 & 2032
- Figure 25: MEA Connected Logistics Industry Revenue Share (%), by Country 2024 & 2032
- Figure 26: MEA Connected Logistics Industry Volume Share (%), by Country 2024 & 2032
- Figure 27: North America Connected Logistics Industry Revenue (Million), by Software 2024 & 2032
- Figure 28: North America Connected Logistics Industry Volume (K Unit), by Software 2024 & 2032
- Figure 29: North America Connected Logistics Industry Revenue Share (%), by Software 2024 & 2032
- Figure 30: North America Connected Logistics Industry Volume Share (%), by Software 2024 & 2032
- Figure 31: North America Connected Logistics Industry Revenue (Million), by Product Type 2024 & 2032
- Figure 32: North America Connected Logistics Industry Volume (K Unit), by Product Type 2024 & 2032
- Figure 33: North America Connected Logistics Industry Revenue Share (%), by Product Type 2024 & 2032
- Figure 34: North America Connected Logistics Industry Volume Share (%), by Product Type 2024 & 2032
- Figure 35: North America Connected Logistics Industry Revenue (Million), by Transportation Mode 2024 & 2032
- Figure 36: North America Connected Logistics Industry Volume (K Unit), by Transportation Mode 2024 & 2032
- Figure 37: North America Connected Logistics Industry Revenue Share (%), by Transportation Mode 2024 & 2032
- Figure 38: North America Connected Logistics Industry Volume Share (%), by Transportation Mode 2024 & 2032
- Figure 39: North America Connected Logistics Industry Revenue (Million), by End-user Industry 2024 & 2032
- Figure 40: North America Connected Logistics Industry Volume (K Unit), by End-user Industry 2024 & 2032
- Figure 41: North America Connected Logistics Industry Revenue Share (%), by End-user Industry 2024 & 2032
- Figure 42: North America Connected Logistics Industry Volume Share (%), by End-user Industry 2024 & 2032
- Figure 43: North America Connected Logistics Industry Revenue (Million), by Country 2024 & 2032
- Figure 44: North America Connected Logistics Industry Volume (K Unit), by Country 2024 & 2032
- Figure 45: North America Connected Logistics Industry Revenue Share (%), by Country 2024 & 2032
- Figure 46: North America Connected Logistics Industry Volume Share (%), by Country 2024 & 2032
- Figure 47: Europe Connected Logistics Industry Revenue (Million), by Software 2024 & 2032
- Figure 48: Europe Connected Logistics Industry Volume (K Unit), by Software 2024 & 2032
- Figure 49: Europe Connected Logistics Industry Revenue Share (%), by Software 2024 & 2032
- Figure 50: Europe Connected Logistics Industry Volume Share (%), by Software 2024 & 2032
- Figure 51: Europe Connected Logistics Industry Revenue (Million), by Product Type 2024 & 2032
- Figure 52: Europe Connected Logistics Industry Volume (K Unit), by Product Type 2024 & 2032
- Figure 53: Europe Connected Logistics Industry Revenue Share (%), by Product Type 2024 & 2032
- Figure 54: Europe Connected Logistics Industry Volume Share (%), by Product Type 2024 & 2032
- Figure 55: Europe Connected Logistics Industry Revenue (Million), by Transportation Mode 2024 & 2032
- Figure 56: Europe Connected Logistics Industry Volume (K Unit), by Transportation Mode 2024 & 2032
- Figure 57: Europe Connected Logistics Industry Revenue Share (%), by Transportation Mode 2024 & 2032
- Figure 58: Europe Connected Logistics Industry Volume Share (%), by Transportation Mode 2024 & 2032
- Figure 59: Europe Connected Logistics Industry Revenue (Million), by End-user Industry 2024 & 2032
- Figure 60: Europe Connected Logistics Industry Volume (K Unit), by End-user Industry 2024 & 2032
- Figure 61: Europe Connected Logistics Industry Revenue Share (%), by End-user Industry 2024 & 2032
- Figure 62: Europe Connected Logistics Industry Volume Share (%), by End-user Industry 2024 & 2032
- Figure 63: Europe Connected Logistics Industry Revenue (Million), by Country 2024 & 2032
- Figure 64: Europe Connected Logistics Industry Volume (K Unit), by Country 2024 & 2032
- Figure 65: Europe Connected Logistics Industry Revenue Share (%), by Country 2024 & 2032
- Figure 66: Europe Connected Logistics Industry Volume Share (%), by Country 2024 & 2032
- Figure 67: Asia Connected Logistics Industry Revenue (Million), by Software 2024 & 2032
- Figure 68: Asia Connected Logistics Industry Volume (K Unit), by Software 2024 & 2032
- Figure 69: Asia Connected Logistics Industry Revenue Share (%), by Software 2024 & 2032
- Figure 70: Asia Connected Logistics Industry Volume Share (%), by Software 2024 & 2032
- Figure 71: Asia Connected Logistics Industry Revenue (Million), by Product Type 2024 & 2032
- Figure 72: Asia Connected Logistics Industry Volume (K Unit), by Product Type 2024 & 2032
- Figure 73: Asia Connected Logistics Industry Revenue Share (%), by Product Type 2024 & 2032
- Figure 74: Asia Connected Logistics Industry Volume Share (%), by Product Type 2024 & 2032
- Figure 75: Asia Connected Logistics Industry Revenue (Million), by Transportation Mode 2024 & 2032
- Figure 76: Asia Connected Logistics Industry Volume (K Unit), by Transportation Mode 2024 & 2032
- Figure 77: Asia Connected Logistics Industry Revenue Share (%), by Transportation Mode 2024 & 2032
- Figure 78: Asia Connected Logistics Industry Volume Share (%), by Transportation Mode 2024 & 2032
- Figure 79: Asia Connected Logistics Industry Revenue (Million), by End-user Industry 2024 & 2032
- Figure 80: Asia Connected Logistics Industry Volume (K Unit), by End-user Industry 2024 & 2032
- Figure 81: Asia Connected Logistics Industry Revenue Share (%), by End-user Industry 2024 & 2032
- Figure 82: Asia Connected Logistics Industry Volume Share (%), by End-user Industry 2024 & 2032
- Figure 83: Asia Connected Logistics Industry Revenue (Million), by Country 2024 & 2032
- Figure 84: Asia Connected Logistics Industry Volume (K Unit), by Country 2024 & 2032
- Figure 85: Asia Connected Logistics Industry Revenue Share (%), by Country 2024 & 2032
- Figure 86: Asia Connected Logistics Industry Volume Share (%), by Country 2024 & 2032
- Figure 87: Australia and New Zealand Connected Logistics Industry Revenue (Million), by Software 2024 & 2032
- Figure 88: Australia and New Zealand Connected Logistics Industry Volume (K Unit), by Software 2024 & 2032
- Figure 89: Australia and New Zealand Connected Logistics Industry Revenue Share (%), by Software 2024 & 2032
- Figure 90: Australia and New Zealand Connected Logistics Industry Volume Share (%), by Software 2024 & 2032
- Figure 91: Australia and New Zealand Connected Logistics Industry Revenue (Million), by Product Type 2024 & 2032
- Figure 92: Australia and New Zealand Connected Logistics Industry Volume (K Unit), by Product Type 2024 & 2032
- Figure 93: Australia and New Zealand Connected Logistics Industry Revenue Share (%), by Product Type 2024 & 2032
- Figure 94: Australia and New Zealand Connected Logistics Industry Volume Share (%), by Product Type 2024 & 2032
- Figure 95: Australia and New Zealand Connected Logistics Industry Revenue (Million), by Transportation Mode 2024 & 2032
- Figure 96: Australia and New Zealand Connected Logistics Industry Volume (K Unit), by Transportation Mode 2024 & 2032
- Figure 97: Australia and New Zealand Connected Logistics Industry Revenue Share (%), by Transportation Mode 2024 & 2032
- Figure 98: Australia and New Zealand Connected Logistics Industry Volume Share (%), by Transportation Mode 2024 & 2032
- Figure 99: Australia and New Zealand Connected Logistics Industry Revenue (Million), by End-user Industry 2024 & 2032
- Figure 100: Australia and New Zealand Connected Logistics Industry Volume (K Unit), by End-user Industry 2024 & 2032
- Figure 101: Australia and New Zealand Connected Logistics Industry Revenue Share (%), by End-user Industry 2024 & 2032
- Figure 102: Australia and New Zealand Connected Logistics Industry Volume Share (%), by End-user Industry 2024 & 2032
- Figure 103: Australia and New Zealand Connected Logistics Industry Revenue (Million), by Country 2024 & 2032
- Figure 104: Australia and New Zealand Connected Logistics Industry Volume (K Unit), by Country 2024 & 2032
- Figure 105: Australia and New Zealand Connected Logistics Industry Revenue Share (%), by Country 2024 & 2032
- Figure 106: Australia and New Zealand Connected Logistics Industry Volume Share (%), by Country 2024 & 2032
- Figure 107: Latin America Connected Logistics Industry Revenue (Million), by Software 2024 & 2032
- Figure 108: Latin America Connected Logistics Industry Volume (K Unit), by Software 2024 & 2032
- Figure 109: Latin America Connected Logistics Industry Revenue Share (%), by Software 2024 & 2032
- Figure 110: Latin America Connected Logistics Industry Volume Share (%), by Software 2024 & 2032
- Figure 111: Latin America Connected Logistics Industry Revenue (Million), by Product Type 2024 & 2032
- Figure 112: Latin America Connected Logistics Industry Volume (K Unit), by Product Type 2024 & 2032
- Figure 113: Latin America Connected Logistics Industry Revenue Share (%), by Product Type 2024 & 2032
- Figure 114: Latin America Connected Logistics Industry Volume Share (%), by Product Type 2024 & 2032
- Figure 115: Latin America Connected Logistics Industry Revenue (Million), by Transportation Mode 2024 & 2032
- Figure 116: Latin America Connected Logistics Industry Volume (K Unit), by Transportation Mode 2024 & 2032
- Figure 117: Latin America Connected Logistics Industry Revenue Share (%), by Transportation Mode 2024 & 2032
- Figure 118: Latin America Connected Logistics Industry Volume Share (%), by Transportation Mode 2024 & 2032
- Figure 119: Latin America Connected Logistics Industry Revenue (Million), by End-user Industry 2024 & 2032
- Figure 120: Latin America Connected Logistics Industry Volume (K Unit), by End-user Industry 2024 & 2032
- Figure 121: Latin America Connected Logistics Industry Revenue Share (%), by End-user Industry 2024 & 2032
- Figure 122: Latin America Connected Logistics Industry Volume Share (%), by End-user Industry 2024 & 2032
- Figure 123: Latin America Connected Logistics Industry Revenue (Million), by Country 2024 & 2032
- Figure 124: Latin America Connected Logistics Industry Volume (K Unit), by Country 2024 & 2032
- Figure 125: Latin America Connected Logistics Industry Revenue Share (%), by Country 2024 & 2032
- Figure 126: Latin America Connected Logistics Industry Volume Share (%), by Country 2024 & 2032
- Figure 127: Middle East and Africa Connected Logistics Industry Revenue (Million), by Software 2024 & 2032
- Figure 128: Middle East and Africa Connected Logistics Industry Volume (K Unit), by Software 2024 & 2032
- Figure 129: Middle East and Africa Connected Logistics Industry Revenue Share (%), by Software 2024 & 2032
- Figure 130: Middle East and Africa Connected Logistics Industry Volume Share (%), by Software 2024 & 2032
- Figure 131: Middle East and Africa Connected Logistics Industry Revenue (Million), by Product Type 2024 & 2032
- Figure 132: Middle East and Africa Connected Logistics Industry Volume (K Unit), by Product Type 2024 & 2032
- Figure 133: Middle East and Africa Connected Logistics Industry Revenue Share (%), by Product Type 2024 & 2032
- Figure 134: Middle East and Africa Connected Logistics Industry Volume Share (%), by Product Type 2024 & 2032
- Figure 135: Middle East and Africa Connected Logistics Industry Revenue (Million), by Transportation Mode 2024 & 2032
- Figure 136: Middle East and Africa Connected Logistics Industry Volume (K Unit), by Transportation Mode 2024 & 2032
- Figure 137: Middle East and Africa Connected Logistics Industry Revenue Share (%), by Transportation Mode 2024 & 2032
- Figure 138: Middle East and Africa Connected Logistics Industry Volume Share (%), by Transportation Mode 2024 & 2032
- Figure 139: Middle East and Africa Connected Logistics Industry Revenue (Million), by End-user Industry 2024 & 2032
- Figure 140: Middle East and Africa Connected Logistics Industry Volume (K Unit), by End-user Industry 2024 & 2032
- Figure 141: Middle East and Africa Connected Logistics Industry Revenue Share (%), by End-user Industry 2024 & 2032
- Figure 142: Middle East and Africa Connected Logistics Industry Volume Share (%), by End-user Industry 2024 & 2032
- Figure 143: Middle East and Africa Connected Logistics Industry Revenue (Million), by Country 2024 & 2032
- Figure 144: Middle East and Africa Connected Logistics Industry Volume (K Unit), by Country 2024 & 2032
- Figure 145: Middle East and Africa Connected Logistics Industry Revenue Share (%), by Country 2024 & 2032
- Figure 146: Middle East and Africa Connected Logistics Industry Volume Share (%), by Country 2024 & 2032
List of Tables
- Table 1: Global Connected Logistics Industry Revenue Million Forecast, by Region 2019 & 2032
- Table 2: Global Connected Logistics Industry Volume K Unit Forecast, by Region 2019 & 2032
- Table 3: Global Connected Logistics Industry Revenue Million Forecast, by Software 2019 & 2032
- Table 4: Global Connected Logistics Industry Volume K Unit Forecast, by Software 2019 & 2032
- Table 5: Global Connected Logistics Industry Revenue Million Forecast, by Product Type 2019 & 2032
- Table 6: Global Connected Logistics Industry Volume K Unit Forecast, by Product Type 2019 & 2032
- Table 7: Global Connected Logistics Industry Revenue Million Forecast, by Transportation Mode 2019 & 2032
- Table 8: Global Connected Logistics Industry Volume K Unit Forecast, by Transportation Mode 2019 & 2032
- Table 9: Global Connected Logistics Industry Revenue Million Forecast, by End-user Industry 2019 & 2032
- Table 10: Global Connected Logistics Industry Volume K Unit Forecast, by End-user Industry 2019 & 2032
- Table 11: Global Connected Logistics Industry Revenue Million Forecast, by Region 2019 & 2032
- Table 12: Global Connected Logistics Industry Volume K Unit Forecast, by Region 2019 & 2032
- Table 13: Global Connected Logistics Industry Revenue Million Forecast, by Country 2019 & 2032
- Table 14: Global Connected Logistics Industry Volume K Unit Forecast, by Country 2019 & 2032
- Table 15: United States Connected Logistics Industry Revenue (Million) Forecast, by Application 2019 & 2032
- Table 16: United States Connected Logistics Industry Volume (K Unit) Forecast, by Application 2019 & 2032
- Table 17: Canada Connected Logistics Industry Revenue (Million) Forecast, by Application 2019 & 2032
- Table 18: Canada Connected Logistics Industry Volume (K Unit) Forecast, by Application 2019 & 2032
- Table 19: Mexico Connected Logistics Industry Revenue (Million) Forecast, by Application 2019 & 2032
- Table 20: Mexico Connected Logistics Industry Volume (K Unit) Forecast, by Application 2019 & 2032
- Table 21: Global Connected Logistics Industry Revenue Million Forecast, by Country 2019 & 2032
- Table 22: Global Connected Logistics Industry Volume K Unit Forecast, by Country 2019 & 2032
- Table 23: Germany Connected Logistics Industry Revenue (Million) Forecast, by Application 2019 & 2032
- Table 24: Germany Connected Logistics Industry Volume (K Unit) Forecast, by Application 2019 & 2032
- Table 25: United Kingdom Connected Logistics Industry Revenue (Million) Forecast, by Application 2019 & 2032
- Table 26: United Kingdom Connected Logistics Industry Volume (K Unit) Forecast, by Application 2019 & 2032
- Table 27: France Connected Logistics Industry Revenue (Million) Forecast, by Application 2019 & 2032
- Table 28: France Connected Logistics Industry Volume (K Unit) Forecast, by Application 2019 & 2032
- Table 29: Spain Connected Logistics Industry Revenue (Million) Forecast, by Application 2019 & 2032
- Table 30: Spain Connected Logistics Industry Volume (K Unit) Forecast, by Application 2019 & 2032
- Table 31: Italy Connected Logistics Industry Revenue (Million) Forecast, by Application 2019 & 2032
- Table 32: Italy Connected Logistics Industry Volume (K Unit) Forecast, by Application 2019 & 2032
- Table 33: Spain Connected Logistics Industry Revenue (Million) Forecast, by Application 2019 & 2032
- Table 34: Spain Connected Logistics Industry Volume (K Unit) Forecast, by Application 2019 & 2032
- Table 35: Belgium Connected Logistics Industry Revenue (Million) Forecast, by Application 2019 & 2032
- Table 36: Belgium Connected Logistics Industry Volume (K Unit) Forecast, by Application 2019 & 2032
- Table 37: Netherland Connected Logistics Industry Revenue (Million) Forecast, by Application 2019 & 2032
- Table 38: Netherland Connected Logistics Industry Volume (K Unit) Forecast, by Application 2019 & 2032
- Table 39: Nordics Connected Logistics Industry Revenue (Million) Forecast, by Application 2019 & 2032
- Table 40: Nordics Connected Logistics Industry Volume (K Unit) Forecast, by Application 2019 & 2032
- Table 41: Rest of Europe Connected Logistics Industry Revenue (Million) Forecast, by Application 2019 & 2032
- Table 42: Rest of Europe Connected Logistics Industry Volume (K Unit) Forecast, by Application 2019 & 2032
- Table 43: Global Connected Logistics Industry Revenue Million Forecast, by Country 2019 & 2032
- Table 44: Global Connected Logistics Industry Volume K Unit Forecast, by Country 2019 & 2032
- Table 45: China Connected Logistics Industry Revenue (Million) Forecast, by Application 2019 & 2032
- Table 46: China Connected Logistics Industry Volume (K Unit) Forecast, by Application 2019 & 2032
- Table 47: Japan Connected Logistics Industry Revenue (Million) Forecast, by Application 2019 & 2032
- Table 48: Japan Connected Logistics Industry Volume (K Unit) Forecast, by Application 2019 & 2032
- Table 49: India Connected Logistics Industry Revenue (Million) Forecast, by Application 2019 & 2032
- Table 50: India Connected Logistics Industry Volume (K Unit) Forecast, by Application 2019 & 2032
- Table 51: South Korea Connected Logistics Industry Revenue (Million) Forecast, by Application 2019 & 2032
- Table 52: South Korea Connected Logistics Industry Volume (K Unit) Forecast, by Application 2019 & 2032
- Table 53: Southeast Asia Connected Logistics Industry Revenue (Million) Forecast, by Application 2019 & 2032
- Table 54: Southeast Asia Connected Logistics Industry Volume (K Unit) Forecast, by Application 2019 & 2032
- Table 55: Australia Connected Logistics Industry Revenue (Million) Forecast, by Application 2019 & 2032
- Table 56: Australia Connected Logistics Industry Volume (K Unit) Forecast, by Application 2019 & 2032
- Table 57: Indonesia Connected Logistics Industry Revenue (Million) Forecast, by Application 2019 & 2032
- Table 58: Indonesia Connected Logistics Industry Volume (K Unit) Forecast, by Application 2019 & 2032
- Table 59: Phillipes Connected Logistics Industry Revenue (Million) Forecast, by Application 2019 & 2032
- Table 60: Phillipes Connected Logistics Industry Volume (K Unit) Forecast, by Application 2019 & 2032
- Table 61: Singapore Connected Logistics Industry Revenue (Million) Forecast, by Application 2019 & 2032
- Table 62: Singapore Connected Logistics Industry Volume (K Unit) Forecast, by Application 2019 & 2032
- Table 63: Thailandc Connected Logistics Industry Revenue (Million) Forecast, by Application 2019 & 2032
- Table 64: Thailandc Connected Logistics Industry Volume (K Unit) Forecast, by Application 2019 & 2032
- Table 65: Rest of Asia Pacific Connected Logistics Industry Revenue (Million) Forecast, by Application 2019 & 2032
- Table 66: Rest of Asia Pacific Connected Logistics Industry Volume (K Unit) Forecast, by Application 2019 & 2032
- Table 67: Global Connected Logistics Industry Revenue Million Forecast, by Country 2019 & 2032
- Table 68: Global Connected Logistics Industry Volume K Unit Forecast, by Country 2019 & 2032
- Table 69: Brazil Connected Logistics Industry Revenue (Million) Forecast, by Application 2019 & 2032
- Table 70: Brazil Connected Logistics Industry Volume (K Unit) Forecast, by Application 2019 & 2032
- Table 71: Argentina Connected Logistics Industry Revenue (Million) Forecast, by Application 2019 & 2032
- Table 72: Argentina Connected Logistics Industry Volume (K Unit) Forecast, by Application 2019 & 2032
- Table 73: Peru Connected Logistics Industry Revenue (Million) Forecast, by Application 2019 & 2032
- Table 74: Peru Connected Logistics Industry Volume (K Unit) Forecast, by Application 2019 & 2032
- Table 75: Chile Connected Logistics Industry Revenue (Million) Forecast, by Application 2019 & 2032
- Table 76: Chile Connected Logistics Industry Volume (K Unit) Forecast, by Application 2019 & 2032
- Table 77: Colombia Connected Logistics Industry Revenue (Million) Forecast, by Application 2019 & 2032
- Table 78: Colombia Connected Logistics Industry Volume (K Unit) Forecast, by Application 2019 & 2032
- Table 79: Ecuador Connected Logistics Industry Revenue (Million) Forecast, by Application 2019 & 2032
- Table 80: Ecuador Connected Logistics Industry Volume (K Unit) Forecast, by Application 2019 & 2032
- Table 81: Venezuela Connected Logistics Industry Revenue (Million) Forecast, by Application 2019 & 2032
- Table 82: Venezuela Connected Logistics Industry Volume (K Unit) Forecast, by Application 2019 & 2032
- Table 83: Rest of South America Connected Logistics Industry Revenue (Million) Forecast, by Application 2019 & 2032
- Table 84: Rest of South America Connected Logistics Industry Volume (K Unit) Forecast, by Application 2019 & 2032
- Table 85: Global Connected Logistics Industry Revenue Million Forecast, by Country 2019 & 2032
- Table 86: Global Connected Logistics Industry Volume K Unit Forecast, by Country 2019 & 2032
- Table 87: United States Connected Logistics Industry Revenue (Million) Forecast, by Application 2019 & 2032
- Table 88: United States Connected Logistics Industry Volume (K Unit) Forecast, by Application 2019 & 2032
- Table 89: Canada Connected Logistics Industry Revenue (Million) Forecast, by Application 2019 & 2032
- Table 90: Canada Connected Logistics Industry Volume (K Unit) Forecast, by Application 2019 & 2032
- Table 91: Mexico Connected Logistics Industry Revenue (Million) Forecast, by Application 2019 & 2032
- Table 92: Mexico Connected Logistics Industry Volume (K Unit) Forecast, by Application 2019 & 2032
- Table 93: Global Connected Logistics Industry Revenue Million Forecast, by Country 2019 & 2032
- Table 94: Global Connected Logistics Industry Volume K Unit Forecast, by Country 2019 & 2032
- Table 95: United Arab Emirates Connected Logistics Industry Revenue (Million) Forecast, by Application 2019 & 2032
- Table 96: United Arab Emirates Connected Logistics Industry Volume (K Unit) Forecast, by Application 2019 & 2032
- Table 97: Saudi Arabia Connected Logistics Industry Revenue (Million) Forecast, by Application 2019 & 2032
- Table 98: Saudi Arabia Connected Logistics Industry Volume (K Unit) Forecast, by Application 2019 & 2032
- Table 99: South Africa Connected Logistics Industry Revenue (Million) Forecast, by Application 2019 & 2032
- Table 100: South Africa Connected Logistics Industry Volume (K Unit) Forecast, by Application 2019 & 2032
- Table 101: Rest of Middle East and Africa Connected Logistics Industry Revenue (Million) Forecast, by Application 2019 & 2032
- Table 102: Rest of Middle East and Africa Connected Logistics Industry Volume (K Unit) Forecast, by Application 2019 & 2032
- Table 103: Global Connected Logistics Industry Revenue Million Forecast, by Software 2019 & 2032
- Table 104: Global Connected Logistics Industry Volume K Unit Forecast, by Software 2019 & 2032
- Table 105: Global Connected Logistics Industry Revenue Million Forecast, by Product Type 2019 & 2032
- Table 106: Global Connected Logistics Industry Volume K Unit Forecast, by Product Type 2019 & 2032
- Table 107: Global Connected Logistics Industry Revenue Million Forecast, by Transportation Mode 2019 & 2032
- Table 108: Global Connected Logistics Industry Volume K Unit Forecast, by Transportation Mode 2019 & 2032
- Table 109: Global Connected Logistics Industry Revenue Million Forecast, by End-user Industry 2019 & 2032
- Table 110: Global Connected Logistics Industry Volume K Unit Forecast, by End-user Industry 2019 & 2032
- Table 111: Global Connected Logistics Industry Revenue Million Forecast, by Country 2019 & 2032
- Table 112: Global Connected Logistics Industry Volume K Unit Forecast, by Country 2019 & 2032
- Table 113: United States Connected Logistics Industry Revenue (Million) Forecast, by Application 2019 & 2032
- Table 114: United States Connected Logistics Industry Volume (K Unit) Forecast, by Application 2019 & 2032
- Table 115: Canada Connected Logistics Industry Revenue (Million) Forecast, by Application 2019 & 2032
- Table 116: Canada Connected Logistics Industry Volume (K Unit) Forecast, by Application 2019 & 2032
- Table 117: Global Connected Logistics Industry Revenue Million Forecast, by Software 2019 & 2032
- Table 118: Global Connected Logistics Industry Volume K Unit Forecast, by Software 2019 & 2032
- Table 119: Global Connected Logistics Industry Revenue Million Forecast, by Product Type 2019 & 2032
- Table 120: Global Connected Logistics Industry Volume K Unit Forecast, by Product Type 2019 & 2032
- Table 121: Global Connected Logistics Industry Revenue Million Forecast, by Transportation Mode 2019 & 2032
- Table 122: Global Connected Logistics Industry Volume K Unit Forecast, by Transportation Mode 2019 & 2032
- Table 123: Global Connected Logistics Industry Revenue Million Forecast, by End-user Industry 2019 & 2032
- Table 124: Global Connected Logistics Industry Volume K Unit Forecast, by End-user Industry 2019 & 2032
- Table 125: Global Connected Logistics Industry Revenue Million Forecast, by Country 2019 & 2032
- Table 126: Global Connected Logistics Industry Volume K Unit Forecast, by Country 2019 & 2032
- Table 127: United Kingdom Connected Logistics Industry Revenue (Million) Forecast, by Application 2019 & 2032
- Table 128: United Kingdom Connected Logistics Industry Volume (K Unit) Forecast, by Application 2019 & 2032
- Table 129: Germany Connected Logistics Industry Revenue (Million) Forecast, by Application 2019 & 2032
- Table 130: Germany Connected Logistics Industry Volume (K Unit) Forecast, by Application 2019 & 2032
- Table 131: France Connected Logistics Industry Revenue (Million) Forecast, by Application 2019 & 2032
- Table 132: France Connected Logistics Industry Volume (K Unit) Forecast, by Application 2019 & 2032
- Table 133: Global Connected Logistics Industry Revenue Million Forecast, by Software 2019 & 2032
- Table 134: Global Connected Logistics Industry Volume K Unit Forecast, by Software 2019 & 2032
- Table 135: Global Connected Logistics Industry Revenue Million Forecast, by Product Type 2019 & 2032
- Table 136: Global Connected Logistics Industry Volume K Unit Forecast, by Product Type 2019 & 2032
- Table 137: Global Connected Logistics Industry Revenue Million Forecast, by Transportation Mode 2019 & 2032
- Table 138: Global Connected Logistics Industry Volume K Unit Forecast, by Transportation Mode 2019 & 2032
- Table 139: Global Connected Logistics Industry Revenue Million Forecast, by End-user Industry 2019 & 2032
- Table 140: Global Connected Logistics Industry Volume K Unit Forecast, by End-user Industry 2019 & 2032
- Table 141: Global Connected Logistics Industry Revenue Million Forecast, by Country 2019 & 2032
- Table 142: Global Connected Logistics Industry Volume K Unit Forecast, by Country 2019 & 2032
- Table 143: China Connected Logistics Industry Revenue (Million) Forecast, by Application 2019 & 2032
- Table 144: China Connected Logistics Industry Volume (K Unit) Forecast, by Application 2019 & 2032
- Table 145: Japan Connected Logistics Industry Revenue (Million) Forecast, by Application 2019 & 2032
- Table 146: Japan Connected Logistics Industry Volume (K Unit) Forecast, by Application 2019 & 2032
- Table 147: India Connected Logistics Industry Revenue (Million) Forecast, by Application 2019 & 2032
- Table 148: India Connected Logistics Industry Volume (K Unit) Forecast, by Application 2019 & 2032
- Table 149: Global Connected Logistics Industry Revenue Million Forecast, by Software 2019 & 2032
- Table 150: Global Connected Logistics Industry Volume K Unit Forecast, by Software 2019 & 2032
- Table 151: Global Connected Logistics Industry Revenue Million Forecast, by Product Type 2019 & 2032
- Table 152: Global Connected Logistics Industry Volume K Unit Forecast, by Product Type 2019 & 2032
- Table 153: Global Connected Logistics Industry Revenue Million Forecast, by Transportation Mode 2019 & 2032
- Table 154: Global Connected Logistics Industry Volume K Unit Forecast, by Transportation Mode 2019 & 2032
- Table 155: Global Connected Logistics Industry Revenue Million Forecast, by End-user Industry 2019 & 2032
- Table 156: Global Connected Logistics Industry Volume K Unit Forecast, by End-user Industry 2019 & 2032
- Table 157: Global Connected Logistics Industry Revenue Million Forecast, by Country 2019 & 2032
- Table 158: Global Connected Logistics Industry Volume K Unit Forecast, by Country 2019 & 2032
- Table 159: Global Connected Logistics Industry Revenue Million Forecast, by Software 2019 & 2032
- Table 160: Global Connected Logistics Industry Volume K Unit Forecast, by Software 2019 & 2032
- Table 161: Global Connected Logistics Industry Revenue Million Forecast, by Product Type 2019 & 2032
- Table 162: Global Connected Logistics Industry Volume K Unit Forecast, by Product Type 2019 & 2032
- Table 163: Global Connected Logistics Industry Revenue Million Forecast, by Transportation Mode 2019 & 2032
- Table 164: Global Connected Logistics Industry Volume K Unit Forecast, by Transportation Mode 2019 & 2032
- Table 165: Global Connected Logistics Industry Revenue Million Forecast, by End-user Industry 2019 & 2032
- Table 166: Global Connected Logistics Industry Volume K Unit Forecast, by End-user Industry 2019 & 2032
- Table 167: Global Connected Logistics Industry Revenue Million Forecast, by Country 2019 & 2032
- Table 168: Global Connected Logistics Industry Volume K Unit Forecast, by Country 2019 & 2032
- Table 169: Global Connected Logistics Industry Revenue Million Forecast, by Software 2019 & 2032
- Table 170: Global Connected Logistics Industry Volume K Unit Forecast, by Software 2019 & 2032
- Table 171: Global Connected Logistics Industry Revenue Million Forecast, by Product Type 2019 & 2032
- Table 172: Global Connected Logistics Industry Volume K Unit Forecast, by Product Type 2019 & 2032
- Table 173: Global Connected Logistics Industry Revenue Million Forecast, by Transportation Mode 2019 & 2032
- Table 174: Global Connected Logistics Industry Volume K Unit Forecast, by Transportation Mode 2019 & 2032
- Table 175: Global Connected Logistics Industry Revenue Million Forecast, by End-user Industry 2019 & 2032
- Table 176: Global Connected Logistics Industry Volume K Unit Forecast, by End-user Industry 2019 & 2032
- Table 177: Global Connected Logistics Industry Revenue Million Forecast, by Country 2019 & 2032
- Table 178: Global Connected Logistics Industry Volume K Unit Forecast, by Country 2019 & 2032
Frequently Asked Questions
1. What is the projected Compound Annual Growth Rate (CAGR) of the Connected Logistics Industry?
The projected CAGR is approximately 17.50%.
2. Which companies are prominent players in the Connected Logistics Industry?
Key companies in the market include Honeywell International Inc, IBM Corporation, Freightgate Inc, Siemens AG, Cisco Systems Inc, Microsoft Corporation, Oracle Corporation, Bosch Service Solutions GmbH, Orbcomm Inc, AT&T Inc, HCL Technologies Limited, SAP SE, Intel Corporation.
3. What are the main segments of the Connected Logistics Industry?
The market segments include Software, Product Type, Transportation Mode, End-user Industry.
4. Can you provide details about the market size?
The market size is estimated to be USD XX Million as of 2022.
5. What are some drivers contributing to market growth?
Increasing Adoption on IoT in various Industries; Adoption of Sensor Based Technologies.
6. What are the notable trends driving market growth?
Increasing use of IoT and future technologies in different industries will drive the adoption of Connected Logistics.
7. Are there any restraints impacting market growth?
Lack of Uniform Government Regulations for Smart Technologies; Coronavirus Outbreak Influencing Electronic Industry.
8. Can you provide examples of recent developments in the market?
May 2020 - E2open Parent Holdings, Inc., a leading network-based provider of a 100% cloud-based, mission-critical, end-to-end supply chain management platform, announced to acquire BluJay Solutions, a leading cloud-based logistics execution platform for approximately USD 1.7 billion.
9. What pricing options are available for accessing the report?
Pricing options include single-user, multi-user, and enterprise licenses priced at USD 4750, USD 5250, and USD 8750 respectively.
10. Is the market size provided in terms of value or volume?
The market size is provided in terms of value, measured in Million and volume, measured in K Unit.
11. Are there any specific market keywords associated with the report?
Yes, the market keyword associated with the report is "Connected Logistics Industry," which aids in identifying and referencing the specific market segment covered.
12. How do I determine which pricing option suits my needs best?
The pricing options vary based on user requirements and access needs. Individual users may opt for single-user licenses, while businesses requiring broader access may choose multi-user or enterprise licenses for cost-effective access to the report.
13. Are there any additional resources or data provided in the Connected Logistics Industry report?
While the report offers comprehensive insights, it's advisable to review the specific contents or supplementary materials provided to ascertain if additional resources or data are available.
14. How can I stay updated on further developments or reports in the Connected Logistics Industry?
To stay informed about further developments, trends, and reports in the Connected Logistics Industry, consider subscribing to industry newsletters, following relevant companies and organizations, or regularly checking reputable industry news sources and publications.
Methodology
Step 1 - Identification of Relevant Samples Size from Population Database


Step 2 - Approaches for Defining Global Market Size (Value, Volume* & Price*)

Note*: In applicable scenarios
Step 3 - Data Sources
Primary Research
- Web Analytics
- Survey Reports
- Research Institute
- Latest Research Reports
- Opinion Leaders
Secondary Research
- Annual Reports
- White Paper
- Latest Press Release
- Industry Association
- Paid Database
- Investor Presentations

Step 4 - Data Triangulation
Involves using different sources of information in order to increase the validity of a study
These sources are likely to be stakeholders in a program - participants, other researchers, program staff, other community members, and so on.
Then we put all data in single framework & apply various statistical tools to find out the dynamic on the market.
During the analysis stage, feedback from the stakeholder groups would be compared to determine areas of agreement as well as areas of divergence


