
Key Insights
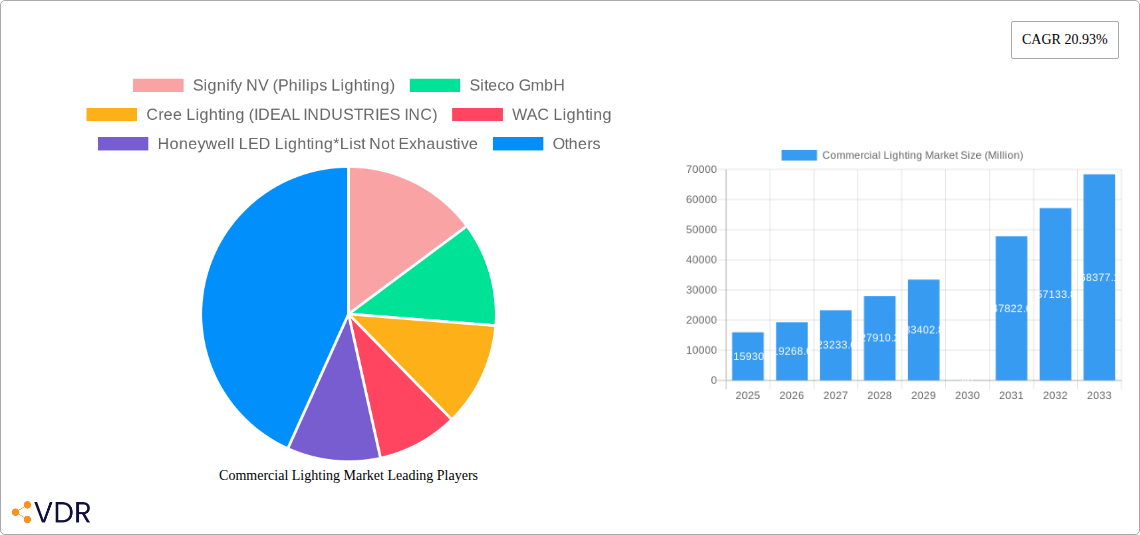
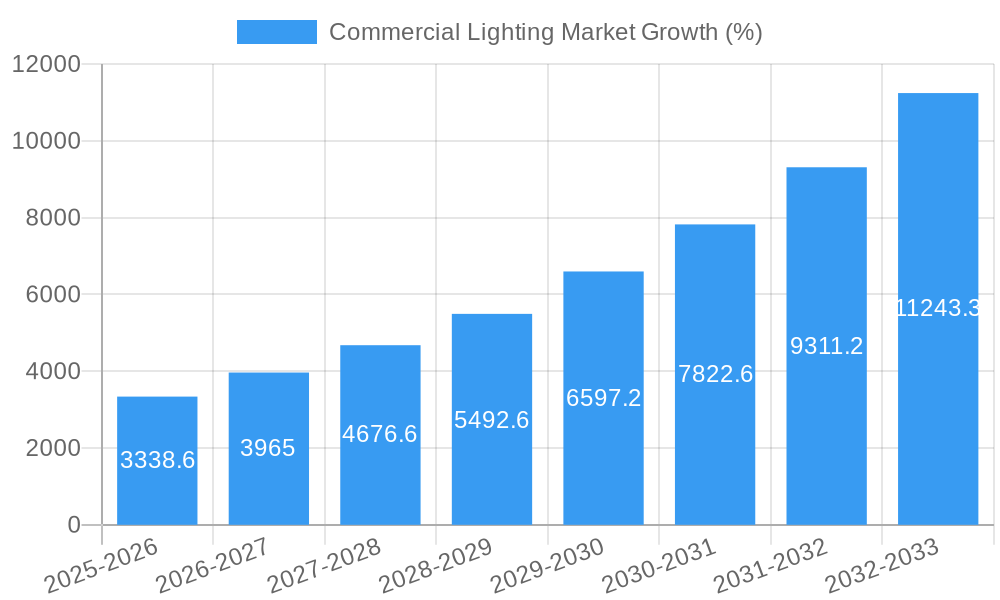
The commercial lighting market, valued at $15.93 billion in 2025, is experiencing robust growth, projected to expand at a compound annual growth rate (CAGR) of 20.93% from 2025 to 2033. This surge is driven by several key factors. The increasing adoption of energy-efficient LED-based lighting solutions is a major catalyst, as businesses seek to reduce operational costs and minimize their environmental impact. Furthermore, smart lighting technologies, offering enhanced control, automation, and data analytics capabilities, are gaining traction, improving efficiency and creating new revenue streams for businesses. Growing urbanization and the expansion of commercial real estate in developing economies, particularly in Asia Pacific, further fuel market growth. The demand for improved lighting quality in commercial spaces, prioritizing employee well-being and enhanced aesthetics, also contributes to market expansion. While initial investment costs for upgrading lighting infrastructure can be a restraint, long-term cost savings from reduced energy consumption and maintenance quickly outweigh these expenses, making the transition to advanced lighting systems attractive. The market is segmented by end-user (commercial offices, retail, hospitality, healthcare, and others), type (lamps and luminaries), and lighting type (LED and traditional). Major players like Signify NV, Cree Lighting, and Acuity Brands are driving innovation and competition, leading to continuous advancements in technology and product offerings.
The market's diverse segments present unique opportunities. The retail sector, with its focus on visual merchandising and customer experience, is a significant driver, embracing dynamic lighting solutions for optimal product presentation. Similarly, the hospitality and healthcare sectors prioritize energy efficiency and ambiance, creating a strong demand for tailored lighting solutions. The shift toward sustainable practices and government regulations promoting energy conservation are expected to further accelerate market growth in the coming years. Competition among manufacturers is likely to intensify, with a focus on product differentiation through innovation in technology, design, and energy efficiency. Companies are investing heavily in R&D to develop smart lighting systems integrated with building management systems, providing enhanced control, data-driven insights, and cost optimization. Overall, the commercial lighting market is poised for substantial growth, driven by a confluence of technological advancements, economic factors, and environmental considerations.
Commercial Lighting Market Report: 2019-2033
This comprehensive report provides an in-depth analysis of the Commercial Lighting Market, encompassing market dynamics, growth trends, regional insights, and key player strategies. With a focus on the parent market (Lighting) and child market (Commercial Lighting), this report is essential for industry professionals seeking to understand and capitalize on the opportunities within this dynamic sector. The report covers the period from 2019 to 2033, with a base year of 2025 and a forecast period of 2025-2033. Market values are presented in million units.
Commercial Lighting Market Dynamics & Structure
The commercial lighting market is characterized by moderate concentration, with key players like Signify NV (Philips Lighting), Siteco GmbH, Cree Lighting (IDEAL INDUSTRIES INC), WAC Lighting, Honeywell LED Lighting, Hubbell Incorporated, Wipro Lighting Limited, Acuity Brands Inc, Zumtobel Group AG, and ABB competing for market share. Technological innovation, particularly in LED-based lighting, is a major driver, while regulatory frameworks focusing on energy efficiency are shaping market trends. The market witnesses significant M&A activity, further consolidating the competitive landscape. Substitute products, such as natural light solutions, present a challenge. End-user demographics, especially the growth of commercial office spaces and retail outlets, influence market demand.
- Market Concentration: Moderately concentrated, with top 10 players holding xx% of market share (2024).
- Technological Innovation: LED technology dominance driving efficiency and cost reduction.
- Regulatory Framework: Stringent energy efficiency standards impacting product development.
- Competitive Substitutes: Natural light and alternative energy sources pose a competitive threat.
- M&A Trends: xx M&A deals recorded in the last 5 years, indicating market consolidation.
- Innovation Barriers: High R&D costs and stringent certification requirements.
Commercial Lighting Market Growth Trends & Insights
The global commercial lighting market exhibited a CAGR of xx% during the historical period (2019-2024) and is projected to grow at a CAGR of xx% during the forecast period (2025-2033), reaching a market size of xx million units by 2033. This growth is driven by increasing adoption of energy-efficient LED lighting solutions, coupled with rising construction activity and refurbishment projects across commercial sectors. Technological disruptions, such as smart lighting systems and IoT integration, are further fueling market expansion. Shifting consumer preferences towards sustainable and smart solutions also contribute to market growth. Market penetration of LED lighting in commercial spaces is estimated at xx% in 2025, projected to reach xx% by 2033.
Dominant Regions, Countries, or Segments in Commercial Lighting Market
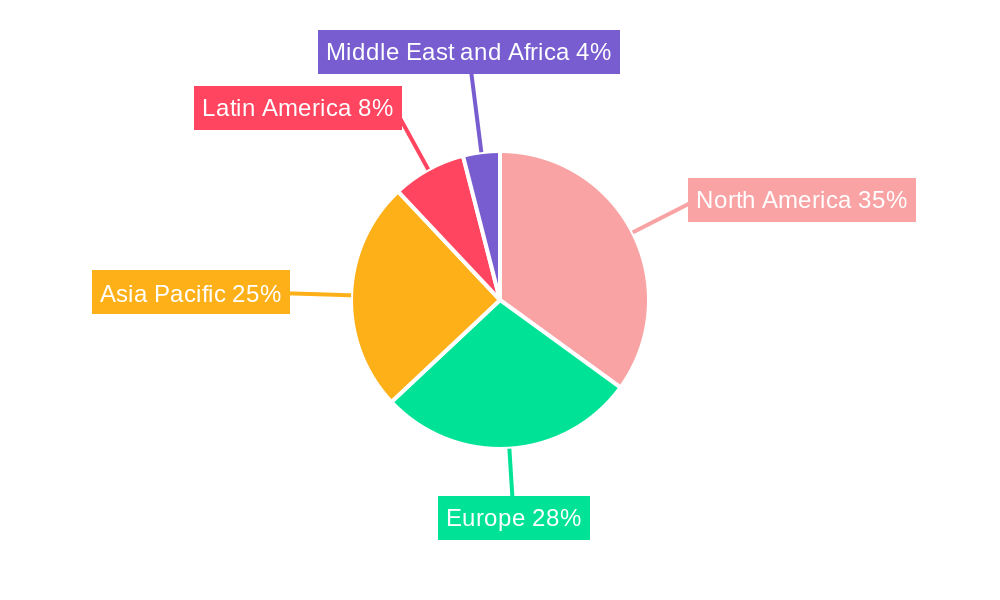
North America and Europe currently dominate the commercial lighting market, driven by high adoption rates of energy-efficient lighting technologies and stringent government regulations. However, the Asia-Pacific region is expected to exhibit the highest growth rate during the forecast period, fueled by rapid urbanization, economic development, and increasing infrastructure investments.
By End-user:
- Commercial Offices: Highest market share due to large-scale deployments and high energy consumption.
- Retail: Significant growth potential driven by focus on attractive store ambiance and energy savings.
- Hospitality and Leisure: Growing demand for aesthetically pleasing and energy-efficient solutions.
- Healthcare: Stringent hygiene and safety regulations driving demand for specialized lighting solutions.
By Type:
- Luminaries: Larger market share due to diverse applications and design flexibility.
- Lamps: Significant growth driven by technological advancements and cost reduction.
By Lighting Type:
- LED-based lighting: Dominant segment due to high energy efficiency, long lifespan, and design flexibility.
- Traditional lighting: Declining market share due to higher energy consumption and shorter lifespan.
Commercial Lighting Market Product Landscape
The commercial lighting market offers a diverse range of products, including LED-based lamps, luminaries, and smart lighting systems. Product innovations focus on improving energy efficiency, enhancing design aesthetics, and integrating smart features like IoT connectivity and remote control. Key performance metrics include lumens per watt, lifespan, color rendering index (CRI), and energy savings. Unique selling propositions include features like tunable white, human-centric lighting, and seamless integration with building management systems.
Key Drivers, Barriers & Challenges in Commercial Lighting Market
Key Drivers:
- Increasing focus on energy efficiency and sustainability.
- Government regulations promoting energy-saving lighting solutions.
- Technological advancements in LED and smart lighting technologies.
- Rising construction and renovation activities in commercial spaces.
Key Challenges:
- High initial investment costs for LED lighting systems.
- Supply chain disruptions impacting product availability and costs.
- Intense competition among manufacturers leading to price pressures.
- Lack of awareness about the benefits of advanced lighting solutions in some regions.
Emerging Opportunities in Commercial Lighting Market
- Growing demand for smart lighting solutions with IoT integration.
- Expansion into untapped markets in developing countries.
- Development of human-centric lighting solutions promoting well-being.
- Integration of lighting systems with building automation systems.
Growth Accelerators in the Commercial Lighting Market Industry
The commercial lighting market's long-term growth is accelerated by ongoing technological breakthroughs in LED technology, strategic partnerships between lighting manufacturers and building automation companies, and the expansion of smart city initiatives. Furthermore, government incentives and subsidies for energy-efficient lighting solutions are driving adoption rates.
Key Players Shaping the Commercial Lighting Market Market
- Signify NV (Philips Lighting)
- Siteco GmbH
- Cree Lighting (IDEAL INDUSTRIES INC)
- WAC Lighting
- Honeywell LED Lighting
- Hubbell Incorporated
- Wipro Lighting Limited
- Acuity Brands Inc
- Zumtobel Group AG
- ABB
Notable Milestones in Commercial Lighting Market Sector
- February 2024: Signify launched the Philips Smart light hub in Chennai, showcasing over 400 SKUs of smart lighting products.
- January 2023: Wipro Lighting introduced its Blazeline flameproof lighting range, targeting hazardous environments.
In-Depth Commercial Lighting Market Market Outlook
The commercial lighting market is poised for robust growth, driven by the continued adoption of energy-efficient LED technology and the increasing demand for smart lighting solutions. Strategic partnerships, technological innovations, and expanding applications in diverse commercial sectors present significant opportunities for market players. The focus on sustainable and intelligent lighting solutions will further shape the market's future trajectory.
Commercial Lighting Market Segmentation
-
1. Type
- 1.1. Lamps
- 1.2. Luminaries
-
2. Lighting Type
- 2.1. LED-based lighting
- 2.2. Traditional
-
3. End-user
- 3.1. Commercial Offices
- 3.2. Retail
- 3.3. Hospital
- 3.4. Healthcare
- 3.5. Other End-users
Commercial Lighting Market Segmentation By Geography
-
1. North America
- 1.1. United States
- 1.2. Canada
-
2. Europe
- 2.1. United Kingdom
- 2.2. Germany
- 2.3. France
- 2.4. Rest of Europe
-
3. Asia Pacific
- 3.1. China
- 3.2. Japan
- 3.3. India
- 3.4. Rest of the Asia Pacific
- 4. Latin America
- 5. Middle East and Africa
Commercial Lighting Market REPORT HIGHLIGHTS
| Aspects | Details |
|---|---|
| Study Period | 2019-2033 |
| Base Year | 2024 |
| Estimated Year | 2025 |
| Forecast Period | 2025-2033 |
| Historical Period | 2019-2024 |
| Growth Rate | CAGR of 20.93% from 2019-2033 |
| Segmentation |
|
Table of Contents
- 1. Introduction
- 1.1. Research Scope
- 1.2. Market Segmentation
- 1.3. Research Methodology
- 1.4. Definitions and Assumptions
- 2. Executive Summary
- 2.1. Introduction
- 3. Market Dynamics
- 3.1. Introduction
- 3.2. Market Drivers
- 3.2.1. Move toward Energy-efficient and Connected Lighting Solutions driven by Growing Awareness and Smart Office Initiatives; Availability of LED-based Lighting Solutions as a Standardized Feature Coupled with Incremental Technological Advancements in the Sector
- 3.3. Market Restrains
- 3.3.1. Limited Range and Connectivity and Lack of Awareness about the Technology
- 3.4. Market Trends
- 3.4.1. Commercial Offices segment to maximum market share
- 4. Market Factor Analysis
- 4.1. Porters Five Forces
- 4.2. Supply/Value Chain
- 4.3. PESTEL analysis
- 4.4. Market Entropy
- 4.5. Patent/Trademark Analysis
- 5. Global Commercial Lighting Market Analysis, Insights and Forecast, 2019-2031
- 5.1. Market Analysis, Insights and Forecast - by Type
- 5.1.1. Lamps
- 5.1.2. Luminaries
- 5.2. Market Analysis, Insights and Forecast - by Lighting Type
- 5.2.1. LED-based lighting
- 5.2.2. Traditional
- 5.3. Market Analysis, Insights and Forecast - by End-user
- 5.3.1. Commercial Offices
- 5.3.2. Retail
- 5.3.3. Hospital
- 5.3.4. Healthcare
- 5.3.5. Other End-users
- 5.4. Market Analysis, Insights and Forecast - by Region
- 5.4.1. North America
- 5.4.2. Europe
- 5.4.3. Asia Pacific
- 5.4.4. Latin America
- 5.4.5. Middle East and Africa
- 5.1. Market Analysis, Insights and Forecast - by Type
- 6. North America Commercial Lighting Market Analysis, Insights and Forecast, 2019-2031
- 6.1. Market Analysis, Insights and Forecast - by Type
- 6.1.1. Lamps
- 6.1.2. Luminaries
- 6.2. Market Analysis, Insights and Forecast - by Lighting Type
- 6.2.1. LED-based lighting
- 6.2.2. Traditional
- 6.3. Market Analysis, Insights and Forecast - by End-user
- 6.3.1. Commercial Offices
- 6.3.2. Retail
- 6.3.3. Hospital
- 6.3.4. Healthcare
- 6.3.5. Other End-users
- 6.1. Market Analysis, Insights and Forecast - by Type
- 7. Europe Commercial Lighting Market Analysis, Insights and Forecast, 2019-2031
- 7.1. Market Analysis, Insights and Forecast - by Type
- 7.1.1. Lamps
- 7.1.2. Luminaries
- 7.2. Market Analysis, Insights and Forecast - by Lighting Type
- 7.2.1. LED-based lighting
- 7.2.2. Traditional
- 7.3. Market Analysis, Insights and Forecast - by End-user
- 7.3.1. Commercial Offices
- 7.3.2. Retail
- 7.3.3. Hospital
- 7.3.4. Healthcare
- 7.3.5. Other End-users
- 7.1. Market Analysis, Insights and Forecast - by Type
- 8. Asia Pacific Commercial Lighting Market Analysis, Insights and Forecast, 2019-2031
- 8.1. Market Analysis, Insights and Forecast - by Type
- 8.1.1. Lamps
- 8.1.2. Luminaries
- 8.2. Market Analysis, Insights and Forecast - by Lighting Type
- 8.2.1. LED-based lighting
- 8.2.2. Traditional
- 8.3. Market Analysis, Insights and Forecast - by End-user
- 8.3.1. Commercial Offices
- 8.3.2. Retail
- 8.3.3. Hospital
- 8.3.4. Healthcare
- 8.3.5. Other End-users
- 8.1. Market Analysis, Insights and Forecast - by Type
- 9. Latin America Commercial Lighting Market Analysis, Insights and Forecast, 2019-2031
- 9.1. Market Analysis, Insights and Forecast - by Type
- 9.1.1. Lamps
- 9.1.2. Luminaries
- 9.2. Market Analysis, Insights and Forecast - by Lighting Type
- 9.2.1. LED-based lighting
- 9.2.2. Traditional
- 9.3. Market Analysis, Insights and Forecast - by End-user
- 9.3.1. Commercial Offices
- 9.3.2. Retail
- 9.3.3. Hospital
- 9.3.4. Healthcare
- 9.3.5. Other End-users
- 9.1. Market Analysis, Insights and Forecast - by Type
- 10. Middle East and Africa Commercial Lighting Market Analysis, Insights and Forecast, 2019-2031
- 10.1. Market Analysis, Insights and Forecast - by Type
- 10.1.1. Lamps
- 10.1.2. Luminaries
- 10.2. Market Analysis, Insights and Forecast - by Lighting Type
- 10.2.1. LED-based lighting
- 10.2.2. Traditional
- 10.3. Market Analysis, Insights and Forecast - by End-user
- 10.3.1. Commercial Offices
- 10.3.2. Retail
- 10.3.3. Hospital
- 10.3.4. Healthcare
- 10.3.5. Other End-users
- 10.1. Market Analysis, Insights and Forecast - by Type
- 11. North America Commercial Lighting Market Analysis, Insights and Forecast, 2019-2031
- 11.1. Market Analysis, Insights and Forecast - By Country/Sub-region
- 11.1.1 United States
- 11.1.2 Canada
- 12. Europe Commercial Lighting Market Analysis, Insights and Forecast, 2019-2031
- 12.1. Market Analysis, Insights and Forecast - By Country/Sub-region
- 12.1.1 United Kingdom
- 12.1.2 Germany
- 12.1.3 France
- 12.1.4 Rest of Europe
- 13. Asia Pacific Commercial Lighting Market Analysis, Insights and Forecast, 2019-2031
- 13.1. Market Analysis, Insights and Forecast - By Country/Sub-region
- 13.1.1 China
- 13.1.2 Japan
- 13.1.3 India
- 13.1.4 Rest of the Asia Pacific
- 14. Latin America Commercial Lighting Market Analysis, Insights and Forecast, 2019-2031
- 14.1. Market Analysis, Insights and Forecast - By Country/Sub-region
- 14.1.1.
- 15. Middle East and Africa Commercial Lighting Market Analysis, Insights and Forecast, 2019-2031
- 15.1. Market Analysis, Insights and Forecast - By Country/Sub-region
- 15.1.1.
- 16. Competitive Analysis
- 16.1. Global Market Share Analysis 2024
- 16.2. Company Profiles
- 16.2.1 Signify NV (Philips Lighting)
- 16.2.1.1. Overview
- 16.2.1.2. Products
- 16.2.1.3. SWOT Analysis
- 16.2.1.4. Recent Developments
- 16.2.1.5. Financials (Based on Availability)
- 16.2.2 Siteco GmbH
- 16.2.2.1. Overview
- 16.2.2.2. Products
- 16.2.2.3. SWOT Analysis
- 16.2.2.4. Recent Developments
- 16.2.2.5. Financials (Based on Availability)
- 16.2.3 Cree Lighting (IDEAL INDUSTRIES INC)
- 16.2.3.1. Overview
- 16.2.3.2. Products
- 16.2.3.3. SWOT Analysis
- 16.2.3.4. Recent Developments
- 16.2.3.5. Financials (Based on Availability)
- 16.2.4 WAC Lighting
- 16.2.4.1. Overview
- 16.2.4.2. Products
- 16.2.4.3. SWOT Analysis
- 16.2.4.4. Recent Developments
- 16.2.4.5. Financials (Based on Availability)
- 16.2.5 Honeywell LED Lighting*List Not Exhaustive
- 16.2.5.1. Overview
- 16.2.5.2. Products
- 16.2.5.3. SWOT Analysis
- 16.2.5.4. Recent Developments
- 16.2.5.5. Financials (Based on Availability)
- 16.2.6 Hubbell Incorporated
- 16.2.6.1. Overview
- 16.2.6.2. Products
- 16.2.6.3. SWOT Analysis
- 16.2.6.4. Recent Developments
- 16.2.6.5. Financials (Based on Availability)
- 16.2.7 Wipro Lighting Limited
- 16.2.7.1. Overview
- 16.2.7.2. Products
- 16.2.7.3. SWOT Analysis
- 16.2.7.4. Recent Developments
- 16.2.7.5. Financials (Based on Availability)
- 16.2.8 Acuity Brands Inc
- 16.2.8.1. Overview
- 16.2.8.2. Products
- 16.2.8.3. SWOT Analysis
- 16.2.8.4. Recent Developments
- 16.2.8.5. Financials (Based on Availability)
- 16.2.9 Zumtobel Group AG
- 16.2.9.1. Overview
- 16.2.9.2. Products
- 16.2.9.3. SWOT Analysis
- 16.2.9.4. Recent Developments
- 16.2.9.5. Financials (Based on Availability)
- 16.2.10 ABB
- 16.2.10.1. Overview
- 16.2.10.2. Products
- 16.2.10.3. SWOT Analysis
- 16.2.10.4. Recent Developments
- 16.2.10.5. Financials (Based on Availability)
- 16.2.1 Signify NV (Philips Lighting)
List of Figures
- Figure 1: Global Commercial Lighting Market Revenue Breakdown (Million, %) by Region 2024 & 2032
- Figure 2: North America Commercial Lighting Market Revenue (Million), by Country 2024 & 2032
- Figure 3: North America Commercial Lighting Market Revenue Share (%), by Country 2024 & 2032
- Figure 4: Europe Commercial Lighting Market Revenue (Million), by Country 2024 & 2032
- Figure 5: Europe Commercial Lighting Market Revenue Share (%), by Country 2024 & 2032
- Figure 6: Asia Pacific Commercial Lighting Market Revenue (Million), by Country 2024 & 2032
- Figure 7: Asia Pacific Commercial Lighting Market Revenue Share (%), by Country 2024 & 2032
- Figure 8: Latin America Commercial Lighting Market Revenue (Million), by Country 2024 & 2032
- Figure 9: Latin America Commercial Lighting Market Revenue Share (%), by Country 2024 & 2032
- Figure 10: Middle East and Africa Commercial Lighting Market Revenue (Million), by Country 2024 & 2032
- Figure 11: Middle East and Africa Commercial Lighting Market Revenue Share (%), by Country 2024 & 2032
- Figure 12: North America Commercial Lighting Market Revenue (Million), by Type 2024 & 2032
- Figure 13: North America Commercial Lighting Market Revenue Share (%), by Type 2024 & 2032
- Figure 14: North America Commercial Lighting Market Revenue (Million), by Lighting Type 2024 & 2032
- Figure 15: North America Commercial Lighting Market Revenue Share (%), by Lighting Type 2024 & 2032
- Figure 16: North America Commercial Lighting Market Revenue (Million), by End-user 2024 & 2032
- Figure 17: North America Commercial Lighting Market Revenue Share (%), by End-user 2024 & 2032
- Figure 18: North America Commercial Lighting Market Revenue (Million), by Country 2024 & 2032
- Figure 19: North America Commercial Lighting Market Revenue Share (%), by Country 2024 & 2032
- Figure 20: Europe Commercial Lighting Market Revenue (Million), by Type 2024 & 2032
- Figure 21: Europe Commercial Lighting Market Revenue Share (%), by Type 2024 & 2032
- Figure 22: Europe Commercial Lighting Market Revenue (Million), by Lighting Type 2024 & 2032
- Figure 23: Europe Commercial Lighting Market Revenue Share (%), by Lighting Type 2024 & 2032
- Figure 24: Europe Commercial Lighting Market Revenue (Million), by End-user 2024 & 2032
- Figure 25: Europe Commercial Lighting Market Revenue Share (%), by End-user 2024 & 2032
- Figure 26: Europe Commercial Lighting Market Revenue (Million), by Country 2024 & 2032
- Figure 27: Europe Commercial Lighting Market Revenue Share (%), by Country 2024 & 2032
- Figure 28: Asia Pacific Commercial Lighting Market Revenue (Million), by Type 2024 & 2032
- Figure 29: Asia Pacific Commercial Lighting Market Revenue Share (%), by Type 2024 & 2032
- Figure 30: Asia Pacific Commercial Lighting Market Revenue (Million), by Lighting Type 2024 & 2032
- Figure 31: Asia Pacific Commercial Lighting Market Revenue Share (%), by Lighting Type 2024 & 2032
- Figure 32: Asia Pacific Commercial Lighting Market Revenue (Million), by End-user 2024 & 2032
- Figure 33: Asia Pacific Commercial Lighting Market Revenue Share (%), by End-user 2024 & 2032
- Figure 34: Asia Pacific Commercial Lighting Market Revenue (Million), by Country 2024 & 2032
- Figure 35: Asia Pacific Commercial Lighting Market Revenue Share (%), by Country 2024 & 2032
- Figure 36: Latin America Commercial Lighting Market Revenue (Million), by Type 2024 & 2032
- Figure 37: Latin America Commercial Lighting Market Revenue Share (%), by Type 2024 & 2032
- Figure 38: Latin America Commercial Lighting Market Revenue (Million), by Lighting Type 2024 & 2032
- Figure 39: Latin America Commercial Lighting Market Revenue Share (%), by Lighting Type 2024 & 2032
- Figure 40: Latin America Commercial Lighting Market Revenue (Million), by End-user 2024 & 2032
- Figure 41: Latin America Commercial Lighting Market Revenue Share (%), by End-user 2024 & 2032
- Figure 42: Latin America Commercial Lighting Market Revenue (Million), by Country 2024 & 2032
- Figure 43: Latin America Commercial Lighting Market Revenue Share (%), by Country 2024 & 2032
- Figure 44: Middle East and Africa Commercial Lighting Market Revenue (Million), by Type 2024 & 2032
- Figure 45: Middle East and Africa Commercial Lighting Market Revenue Share (%), by Type 2024 & 2032
- Figure 46: Middle East and Africa Commercial Lighting Market Revenue (Million), by Lighting Type 2024 & 2032
- Figure 47: Middle East and Africa Commercial Lighting Market Revenue Share (%), by Lighting Type 2024 & 2032
- Figure 48: Middle East and Africa Commercial Lighting Market Revenue (Million), by End-user 2024 & 2032
- Figure 49: Middle East and Africa Commercial Lighting Market Revenue Share (%), by End-user 2024 & 2032
- Figure 50: Middle East and Africa Commercial Lighting Market Revenue (Million), by Country 2024 & 2032
- Figure 51: Middle East and Africa Commercial Lighting Market Revenue Share (%), by Country 2024 & 2032
List of Tables
- Table 1: Global Commercial Lighting Market Revenue Million Forecast, by Region 2019 & 2032
- Table 2: Global Commercial Lighting Market Revenue Million Forecast, by Type 2019 & 2032
- Table 3: Global Commercial Lighting Market Revenue Million Forecast, by Lighting Type 2019 & 2032
- Table 4: Global Commercial Lighting Market Revenue Million Forecast, by End-user 2019 & 2032
- Table 5: Global Commercial Lighting Market Revenue Million Forecast, by Region 2019 & 2032
- Table 6: Global Commercial Lighting Market Revenue Million Forecast, by Country 2019 & 2032
- Table 7: United States Commercial Lighting Market Revenue (Million) Forecast, by Application 2019 & 2032
- Table 8: Canada Commercial Lighting Market Revenue (Million) Forecast, by Application 2019 & 2032
- Table 9: Global Commercial Lighting Market Revenue Million Forecast, by Country 2019 & 2032
- Table 10: United Kingdom Commercial Lighting Market Revenue (Million) Forecast, by Application 2019 & 2032
- Table 11: Germany Commercial Lighting Market Revenue (Million) Forecast, by Application 2019 & 2032
- Table 12: France Commercial Lighting Market Revenue (Million) Forecast, by Application 2019 & 2032
- Table 13: Rest of Europe Commercial Lighting Market Revenue (Million) Forecast, by Application 2019 & 2032
- Table 14: Global Commercial Lighting Market Revenue Million Forecast, by Country 2019 & 2032
- Table 15: China Commercial Lighting Market Revenue (Million) Forecast, by Application 2019 & 2032
- Table 16: Japan Commercial Lighting Market Revenue (Million) Forecast, by Application 2019 & 2032
- Table 17: India Commercial Lighting Market Revenue (Million) Forecast, by Application 2019 & 2032
- Table 18: Rest of the Asia Pacific Commercial Lighting Market Revenue (Million) Forecast, by Application 2019 & 2032
- Table 19: Global Commercial Lighting Market Revenue Million Forecast, by Country 2019 & 2032
- Table 20: Commercial Lighting Market Revenue (Million) Forecast, by Application 2019 & 2032
- Table 21: Global Commercial Lighting Market Revenue Million Forecast, by Country 2019 & 2032
- Table 22: Commercial Lighting Market Revenue (Million) Forecast, by Application 2019 & 2032
- Table 23: Global Commercial Lighting Market Revenue Million Forecast, by Type 2019 & 2032
- Table 24: Global Commercial Lighting Market Revenue Million Forecast, by Lighting Type 2019 & 2032
- Table 25: Global Commercial Lighting Market Revenue Million Forecast, by End-user 2019 & 2032
- Table 26: Global Commercial Lighting Market Revenue Million Forecast, by Country 2019 & 2032
- Table 27: United States Commercial Lighting Market Revenue (Million) Forecast, by Application 2019 & 2032
- Table 28: Canada Commercial Lighting Market Revenue (Million) Forecast, by Application 2019 & 2032
- Table 29: Global Commercial Lighting Market Revenue Million Forecast, by Type 2019 & 2032
- Table 30: Global Commercial Lighting Market Revenue Million Forecast, by Lighting Type 2019 & 2032
- Table 31: Global Commercial Lighting Market Revenue Million Forecast, by End-user 2019 & 2032
- Table 32: Global Commercial Lighting Market Revenue Million Forecast, by Country 2019 & 2032
- Table 33: United Kingdom Commercial Lighting Market Revenue (Million) Forecast, by Application 2019 & 2032
- Table 34: Germany Commercial Lighting Market Revenue (Million) Forecast, by Application 2019 & 2032
- Table 35: France Commercial Lighting Market Revenue (Million) Forecast, by Application 2019 & 2032
- Table 36: Rest of Europe Commercial Lighting Market Revenue (Million) Forecast, by Application 2019 & 2032
- Table 37: Global Commercial Lighting Market Revenue Million Forecast, by Type 2019 & 2032
- Table 38: Global Commercial Lighting Market Revenue Million Forecast, by Lighting Type 2019 & 2032
- Table 39: Global Commercial Lighting Market Revenue Million Forecast, by End-user 2019 & 2032
- Table 40: Global Commercial Lighting Market Revenue Million Forecast, by Country 2019 & 2032
- Table 41: China Commercial Lighting Market Revenue (Million) Forecast, by Application 2019 & 2032
- Table 42: Japan Commercial Lighting Market Revenue (Million) Forecast, by Application 2019 & 2032
- Table 43: India Commercial Lighting Market Revenue (Million) Forecast, by Application 2019 & 2032
- Table 44: Rest of the Asia Pacific Commercial Lighting Market Revenue (Million) Forecast, by Application 2019 & 2032
- Table 45: Global Commercial Lighting Market Revenue Million Forecast, by Type 2019 & 2032
- Table 46: Global Commercial Lighting Market Revenue Million Forecast, by Lighting Type 2019 & 2032
- Table 47: Global Commercial Lighting Market Revenue Million Forecast, by End-user 2019 & 2032
- Table 48: Global Commercial Lighting Market Revenue Million Forecast, by Country 2019 & 2032
- Table 49: Global Commercial Lighting Market Revenue Million Forecast, by Type 2019 & 2032
- Table 50: Global Commercial Lighting Market Revenue Million Forecast, by Lighting Type 2019 & 2032
- Table 51: Global Commercial Lighting Market Revenue Million Forecast, by End-user 2019 & 2032
- Table 52: Global Commercial Lighting Market Revenue Million Forecast, by Country 2019 & 2032
Frequently Asked Questions
1. What is the projected Compound Annual Growth Rate (CAGR) of the Commercial Lighting Market?
The projected CAGR is approximately 20.93%.
2. Which companies are prominent players in the Commercial Lighting Market?
Key companies in the market include Signify NV (Philips Lighting), Siteco GmbH, Cree Lighting (IDEAL INDUSTRIES INC), WAC Lighting, Honeywell LED Lighting*List Not Exhaustive, Hubbell Incorporated, Wipro Lighting Limited, Acuity Brands Inc, Zumtobel Group AG, ABB.
3. What are the main segments of the Commercial Lighting Market?
The market segments include Type, Lighting Type, End-user.
4. Can you provide details about the market size?
The market size is estimated to be USD 15.93 Million as of 2022.
5. What are some drivers contributing to market growth?
Move toward Energy-efficient and Connected Lighting Solutions driven by Growing Awareness and Smart Office Initiatives; Availability of LED-based Lighting Solutions as a Standardized Feature Coupled with Incremental Technological Advancements in the Sector.
6. What are the notable trends driving market growth?
Commercial Offices segment to maximum market share.
7. Are there any restraints impacting market growth?
Limited Range and Connectivity and Lack of Awareness about the Technology.
8. Can you provide examples of recent developments in the market?
Feb 2024: Signify launched the Philips Smart light hub in Chennai. The newly launched Smart light hub is built to give the customers a hands-on experiential tour of the products. It is spread over 2200 sq. ft. and offers more than 400 SKUs of smart lighting products, including product categories such as Smart Wi-fi LED lights, modular COB range, magnetic tracks, LED strips, and decorative lighting for indoor and outdoor applications among others.
9. What pricing options are available for accessing the report?
Pricing options include single-user, multi-user, and enterprise licenses priced at USD 4750, USD 5250, and USD 8750 respectively.
10. Is the market size provided in terms of value or volume?
The market size is provided in terms of value, measured in Million.
11. Are there any specific market keywords associated with the report?
Yes, the market keyword associated with the report is "Commercial Lighting Market," which aids in identifying and referencing the specific market segment covered.
12. How do I determine which pricing option suits my needs best?
The pricing options vary based on user requirements and access needs. Individual users may opt for single-user licenses, while businesses requiring broader access may choose multi-user or enterprise licenses for cost-effective access to the report.
13. Are there any additional resources or data provided in the Commercial Lighting Market report?
While the report offers comprehensive insights, it's advisable to review the specific contents or supplementary materials provided to ascertain if additional resources or data are available.
14. How can I stay updated on further developments or reports in the Commercial Lighting Market?
To stay informed about further developments, trends, and reports in the Commercial Lighting Market, consider subscribing to industry newsletters, following relevant companies and organizations, or regularly checking reputable industry news sources and publications.
Methodology
Step 1 - Identification of Relevant Samples Size from Population Database


Step 2 - Approaches for Defining Global Market Size (Value, Volume* & Price*)

Note*: In applicable scenarios
Step 3 - Data Sources
Primary Research
- Web Analytics
- Survey Reports
- Research Institute
- Latest Research Reports
- Opinion Leaders
Secondary Research
- Annual Reports
- White Paper
- Latest Press Release
- Industry Association
- Paid Database
- Investor Presentations

Step 4 - Data Triangulation
Involves using different sources of information in order to increase the validity of a study
These sources are likely to be stakeholders in a program - participants, other researchers, program staff, other community members, and so on.
Then we put all data in single framework & apply various statistical tools to find out the dynamic on the market.
During the analysis stage, feedback from the stakeholder groups would be compared to determine areas of agreement as well as areas of divergence


