
Key Insights
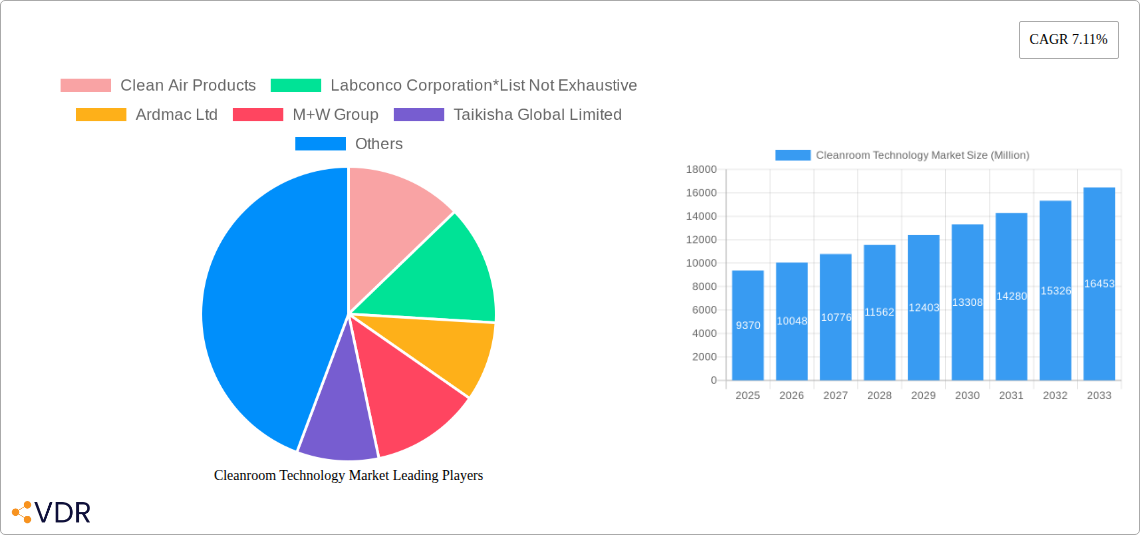
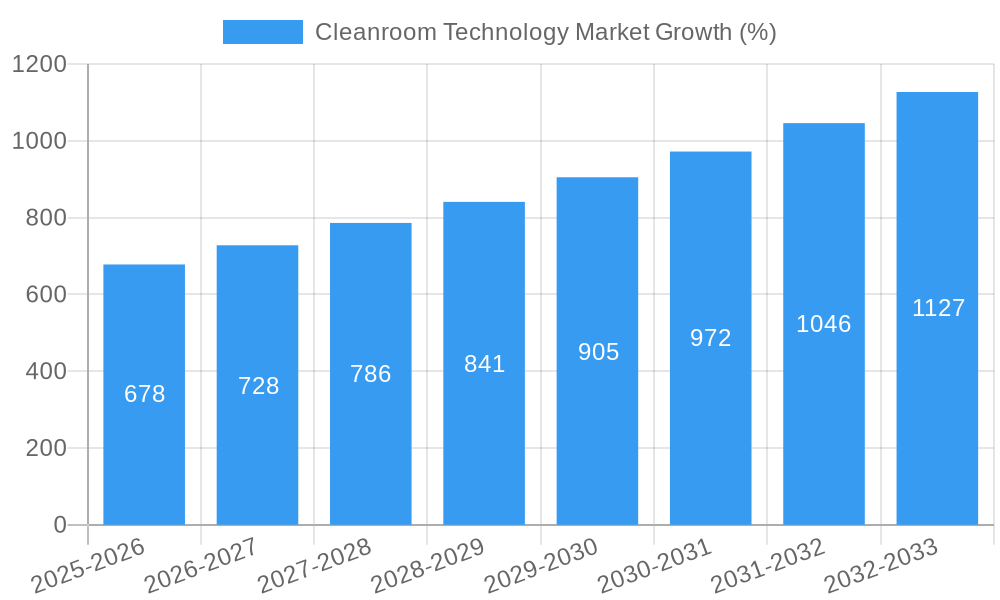
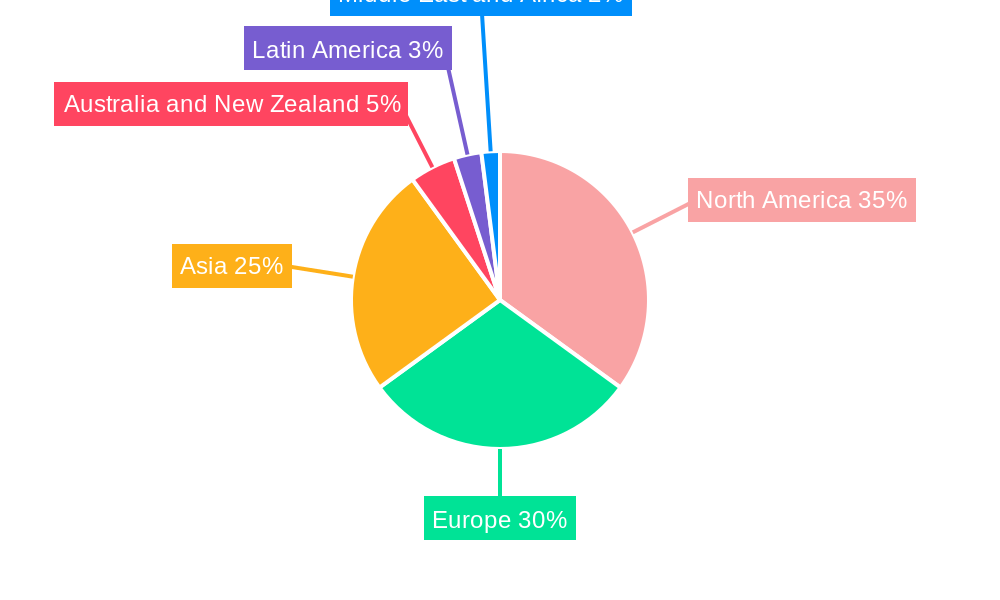
The Cleanroom Technology market, valued at $9.37 billion in 2025, is projected to experience robust growth, driven by increasing demand across diverse sectors. The Compound Annual Growth Rate (CAGR) of 7.11% from 2025 to 2033 indicates a significant expansion of the market over the forecast period. Key drivers include the rising need for contamination control in pharmaceutical and biotechnology manufacturing, stringent regulatory compliance requirements, and the growing adoption of advanced cleanroom technologies in semiconductor and medical device production. Furthermore, increasing investments in research and development, particularly in areas such as advanced filtration systems and real-time monitoring technologies, are fueling market growth. The market is segmented by component (equipment and consumables like fan filter units), end-user (pharmaceutical, biotechnology, medical devices, hospitals, semiconductor manufacturing, and others), and geography. North America and Europe currently hold significant market share, but the Asia-Pacific region is expected to exhibit substantial growth due to increasing industrialization and expanding healthcare infrastructure. Competitive pressures are likely to increase as existing players like Clean Air Products, Labconco Corporation, Ardmac Ltd, M+W Group, Taikisha Global Limited, Azbil Corporation, Kimberly Clark Corporation, and Ansell Limited, along with emerging players, compete for market share through product innovation and strategic partnerships.
The market's expansion is further propelled by technological advancements in cleanroom design and construction, leading to more efficient and cost-effective solutions. The increasing focus on sustainable and energy-efficient cleanroom technologies is also shaping the market landscape. However, high initial investment costs and stringent maintenance requirements could pose challenges to market growth. Despite these constraints, the overall outlook for the Cleanroom Technology market remains positive, with continued growth projected across all major segments and regions throughout the forecast period. This is fueled by the unwavering need for controlled environments in sensitive industries where contamination can have serious consequences.
Cleanroom Technology Market: A Comprehensive Report (2019-2033)
This comprehensive report provides a detailed analysis of the Cleanroom Technology market, encompassing market dynamics, growth trends, regional dominance, product landscape, key players, and future outlook. The report covers the period from 2019 to 2033, with 2025 as the base year and a forecast period extending to 2033. The market is segmented by component (Type of Equipment, Fan Filter Units, Type of Consumable), and end-user (Pharmaceutical, Biotechnology, Medical Devices, Hospitals, Semiconductor Manufacturing, Other End Users). The total market value in 2025 is estimated at XX Million units.
Cleanroom Technology Market Dynamics & Structure
The Cleanroom Technology market is characterized by moderate concentration, with several major players holding significant market share. However, the market is also highly fragmented due to the presence of numerous small and medium-sized enterprises (SMEs). Technological innovation, particularly in areas such as automation, sensor technology, and air purification systems, is a primary driver of market growth. Stringent regulatory frameworks governing cleanroom design, operation, and maintenance, particularly in industries like pharmaceuticals and semiconductors, shape market dynamics. Competitive product substitutes are limited, primarily due to the highly specialized nature of cleanroom technology. The end-user demographics are heavily skewed towards industries requiring high levels of contamination control. M&A activity in the sector is moderate, with consolidation primarily driven by the pursuit of technological advancements and expansion into new geographical markets.
- Market Concentration: Moderately concentrated, with a xx% market share held by the top 5 players in 2025.
- Technological Innovation: Significant advancements in automation, sensor technology, and air purification systems.
- Regulatory Framework: Stringent regulations in key end-user industries (pharmaceuticals, semiconductors).
- M&A Activity: Moderate level of mergers and acquisitions, driven by technological advancement and geographical expansion. XX deals were recorded between 2019-2024.
Cleanroom Technology Market Growth Trends & Insights
The Cleanroom Technology market has witnessed steady growth during the historical period (2019-2024), primarily driven by increasing demand from the pharmaceutical, biotechnology, and semiconductor industries. The market size is projected to reach XX million units by 2025, expanding at a Compound Annual Growth Rate (CAGR) of xx% during the forecast period (2025-2033). This growth is fueled by technological advancements leading to increased efficiency and reduced operating costs. Growing adoption rates in emerging markets, driven by increasing awareness of contamination control requirements and investments in infrastructure, contribute significantly. Disruptions from technological advancements, such as the integration of IoT sensors and AI-based monitoring systems, are expected to drive further market expansion. Consumer behavior shifts towards a greater focus on hygiene and contamination control also influence growth.
Dominant Regions, Countries, or Segments in Cleanroom Technology Market
North America and Europe currently dominate the Cleanroom Technology market, driven by strong regulatory frameworks, high adoption rates in advanced industries, and established infrastructure. However, Asia-Pacific is expected to exhibit significant growth over the forecast period due to increased investments in manufacturing and pharmaceutical sectors. Within the segments, the pharmaceutical and semiconductor industries are major contributors, and the demand for Fan Filter Units (FFUs) and other critical equipment is substantial.
- North America: Strong regulatory environment and high adoption rates in pharma and semiconductor industries.
- Europe: Established market with a high concentration of key players and advanced infrastructure.
- Asia-Pacific: High growth potential driven by increasing investments in manufacturing and pharmaceutical sectors.
- Pharmaceutical & Semiconductor: Dominant end-user segments driving market growth.
Cleanroom Technology Market Product Landscape
The Cleanroom Technology market offers a wide range of products, including various types of equipment (e.g., laminar flow hoods, clean benches, pass-through chambers), fan filter units (FFUs) with varying filter types (HEPA, ULPA), and consumables (e.g., wipers, garments). Recent innovations focus on improving energy efficiency, reducing operating costs, and enhancing contamination control. Unique selling propositions include advanced filtration technologies, integrated monitoring systems, and modular designs for customized solutions. Technological advancements such as the use of IoT sensors and AI-driven predictive maintenance are transforming the sector.
Key Drivers, Barriers & Challenges in Cleanroom Technology Market
Key Drivers: Increasing demand from the pharmaceutical and semiconductor industries; stringent regulatory compliance requirements; advancements in automation and sensor technologies; rising awareness of contamination control; increasing investments in healthcare infrastructure.
Challenges: High initial investment costs; stringent regulatory hurdles; potential supply chain disruptions; intense competition from existing players and new entrants; fluctuating raw material prices; skilled labor shortages. The supply chain issues led to a xx% increase in raw material prices in 2023.
Emerging Opportunities in Cleanroom Technology Market
Emerging opportunities include expansion into emerging markets, growing demand for customized cleanroom solutions, increasing adoption of advanced technologies like IoT and AI, and the development of sustainable and energy-efficient cleanroom technologies. The growing focus on personalized medicine and cell therapy presents significant growth potential. Untapped markets in developing economies offer substantial long-term opportunities.
Growth Accelerators in the Cleanroom Technology Market Industry
The long-term growth of the Cleanroom Technology market is expected to be driven by several factors, including continuous technological advancements in filtration and contamination control, strategic partnerships and collaborations between industry players, and the expansion of cleanroom applications into new sectors. Government initiatives and funding programs promoting advanced manufacturing and healthcare infrastructure will also contribute to sustained growth.
Key Players Shaping the Cleanroom Technology Market Market
- Clean Air Products
- Labconco Corporation
- Ardmac Ltd
- M+W Group
- Taikisha Global Limited
- Azbil Corporation
- Kimberly Clark Corporation
- Ansell Limited
Notable Milestones in Cleanroom Technology Market Sector
- May 2024: The Cleanroom Technology Conference in the UK highlighted advancements and regulatory updates in pharma and semiconductor cleanroom operations.
- April 2024: UV Medico showcased its cleanroom technology at the Lounges Cleanroom Trade Show in Karlsruhe, Germany.
- March 2024: The Biden administration's investment in Intel's chip plants signifies significant investment in the semiconductor manufacturing sector, which is a crucial end-user for cleanroom technologies.
In-Depth Cleanroom Technology Market Market Outlook
The Cleanroom Technology market is poised for substantial growth in the coming years, driven by technological advancements, increased regulatory scrutiny, and the expansion of its applications across diverse industries. Strategic partnerships, mergers and acquisitions, and a focus on sustainable and efficient solutions will further fuel market expansion. The market's future hinges on innovation and adapting to evolving industry needs, presenting considerable opportunities for established and emerging players alike.
Cleanroom Technology Market Segmentation
-
1. Component
-
1.1. Type of Equipment
- 1.1.1. Cleanroom Air Showers
- 1.1.2. HVAC Systems
- 1.1.3. Laminar Air Flow Systems
- 1.1.4. High Efficiency Filters
- 1.1.5. Desiccator Cabinets
- 1.1.6. Fan Filter Units
-
1.2. Type of Consumable
- 1.2.1. Apparels
- 1.2.2. Gloves
- 1.2.3. Wipes
- 1.2.4. Vacuum Systems
- 1.2.5. Disinfectants
- 1.2.6. Other Types of Consumables
-
1.1. Type of Equipment
-
2. End User
- 2.1. Pharmaceutical
- 2.2. Biotechnology
- 2.3. Medical Devices
- 2.4. Hospitals
- 2.5. Semiconductor Manufacturing
- 2.6. Other End Users
Cleanroom Technology Market Segmentation By Geography
- 1. North America
- 2. Europe
- 3. Asia
- 4. Australia and New Zealand
- 5. Latin America
- 6. Middle East and Africa
Cleanroom Technology Market REPORT HIGHLIGHTS
| Aspects | Details |
|---|---|
| Study Period | 2019-2033 |
| Base Year | 2024 |
| Estimated Year | 2025 |
| Forecast Period | 2025-2033 |
| Historical Period | 2019-2024 |
| Growth Rate | CAGR of 7.11% from 2019-2033 |
| Segmentation |
|
Table of Contents
- 1. Introduction
- 1.1. Research Scope
- 1.2. Market Segmentation
- 1.3. Research Methodology
- 1.4. Definitions and Assumptions
- 2. Executive Summary
- 2.1. Introduction
- 3. Market Dynamics
- 3.1. Introduction
- 3.2. Market Drivers
- 3.2.1. Overall Growth in Biotechnology and Healthcare Spending in Major Markets; Stringent Government Regulations and Demand for Quality Products
- 3.3. Market Restrains
- 3.3.1. Lack of Awareness of the Technology in the Market; Lacking the Device Infrastructure to Support the Adoption of Terahertz Technology
- 3.4. Market Trends
- 3.4.1. Semiconductor Manufacturing End User Significantly Driving the Market Growth
- 4. Market Factor Analysis
- 4.1. Porters Five Forces
- 4.2. Supply/Value Chain
- 4.3. PESTEL analysis
- 4.4. Market Entropy
- 4.5. Patent/Trademark Analysis
- 5. Global Cleanroom Technology Market Analysis, Insights and Forecast, 2019-2031
- 5.1. Market Analysis, Insights and Forecast - by Component
- 5.1.1. Type of Equipment
- 5.1.1.1. Cleanroom Air Showers
- 5.1.1.2. HVAC Systems
- 5.1.1.3. Laminar Air Flow Systems
- 5.1.1.4. High Efficiency Filters
- 5.1.1.5. Desiccator Cabinets
- 5.1.1.6. Fan Filter Units
- 5.1.2. Type of Consumable
- 5.1.2.1. Apparels
- 5.1.2.2. Gloves
- 5.1.2.3. Wipes
- 5.1.2.4. Vacuum Systems
- 5.1.2.5. Disinfectants
- 5.1.2.6. Other Types of Consumables
- 5.1.1. Type of Equipment
- 5.2. Market Analysis, Insights and Forecast - by End User
- 5.2.1. Pharmaceutical
- 5.2.2. Biotechnology
- 5.2.3. Medical Devices
- 5.2.4. Hospitals
- 5.2.5. Semiconductor Manufacturing
- 5.2.6. Other End Users
- 5.3. Market Analysis, Insights and Forecast - by Region
- 5.3.1. North America
- 5.3.2. Europe
- 5.3.3. Asia
- 5.3.4. Australia and New Zealand
- 5.3.5. Latin America
- 5.3.6. Middle East and Africa
- 5.1. Market Analysis, Insights and Forecast - by Component
- 6. North America Cleanroom Technology Market Analysis, Insights and Forecast, 2019-2031
- 6.1. Market Analysis, Insights and Forecast - by Component
- 6.1.1. Type of Equipment
- 6.1.1.1. Cleanroom Air Showers
- 6.1.1.2. HVAC Systems
- 6.1.1.3. Laminar Air Flow Systems
- 6.1.1.4. High Efficiency Filters
- 6.1.1.5. Desiccator Cabinets
- 6.1.1.6. Fan Filter Units
- 6.1.2. Type of Consumable
- 6.1.2.1. Apparels
- 6.1.2.2. Gloves
- 6.1.2.3. Wipes
- 6.1.2.4. Vacuum Systems
- 6.1.2.5. Disinfectants
- 6.1.2.6. Other Types of Consumables
- 6.1.1. Type of Equipment
- 6.2. Market Analysis, Insights and Forecast - by End User
- 6.2.1. Pharmaceutical
- 6.2.2. Biotechnology
- 6.2.3. Medical Devices
- 6.2.4. Hospitals
- 6.2.5. Semiconductor Manufacturing
- 6.2.6. Other End Users
- 6.1. Market Analysis, Insights and Forecast - by Component
- 7. Europe Cleanroom Technology Market Analysis, Insights and Forecast, 2019-2031
- 7.1. Market Analysis, Insights and Forecast - by Component
- 7.1.1. Type of Equipment
- 7.1.1.1. Cleanroom Air Showers
- 7.1.1.2. HVAC Systems
- 7.1.1.3. Laminar Air Flow Systems
- 7.1.1.4. High Efficiency Filters
- 7.1.1.5. Desiccator Cabinets
- 7.1.1.6. Fan Filter Units
- 7.1.2. Type of Consumable
- 7.1.2.1. Apparels
- 7.1.2.2. Gloves
- 7.1.2.3. Wipes
- 7.1.2.4. Vacuum Systems
- 7.1.2.5. Disinfectants
- 7.1.2.6. Other Types of Consumables
- 7.1.1. Type of Equipment
- 7.2. Market Analysis, Insights and Forecast - by End User
- 7.2.1. Pharmaceutical
- 7.2.2. Biotechnology
- 7.2.3. Medical Devices
- 7.2.4. Hospitals
- 7.2.5. Semiconductor Manufacturing
- 7.2.6. Other End Users
- 7.1. Market Analysis, Insights and Forecast - by Component
- 8. Asia Cleanroom Technology Market Analysis, Insights and Forecast, 2019-2031
- 8.1. Market Analysis, Insights and Forecast - by Component
- 8.1.1. Type of Equipment
- 8.1.1.1. Cleanroom Air Showers
- 8.1.1.2. HVAC Systems
- 8.1.1.3. Laminar Air Flow Systems
- 8.1.1.4. High Efficiency Filters
- 8.1.1.5. Desiccator Cabinets
- 8.1.1.6. Fan Filter Units
- 8.1.2. Type of Consumable
- 8.1.2.1. Apparels
- 8.1.2.2. Gloves
- 8.1.2.3. Wipes
- 8.1.2.4. Vacuum Systems
- 8.1.2.5. Disinfectants
- 8.1.2.6. Other Types of Consumables
- 8.1.1. Type of Equipment
- 8.2. Market Analysis, Insights and Forecast - by End User
- 8.2.1. Pharmaceutical
- 8.2.2. Biotechnology
- 8.2.3. Medical Devices
- 8.2.4. Hospitals
- 8.2.5. Semiconductor Manufacturing
- 8.2.6. Other End Users
- 8.1. Market Analysis, Insights and Forecast - by Component
- 9. Australia and New Zealand Cleanroom Technology Market Analysis, Insights and Forecast, 2019-2031
- 9.1. Market Analysis, Insights and Forecast - by Component
- 9.1.1. Type of Equipment
- 9.1.1.1. Cleanroom Air Showers
- 9.1.1.2. HVAC Systems
- 9.1.1.3. Laminar Air Flow Systems
- 9.1.1.4. High Efficiency Filters
- 9.1.1.5. Desiccator Cabinets
- 9.1.1.6. Fan Filter Units
- 9.1.2. Type of Consumable
- 9.1.2.1. Apparels
- 9.1.2.2. Gloves
- 9.1.2.3. Wipes
- 9.1.2.4. Vacuum Systems
- 9.1.2.5. Disinfectants
- 9.1.2.6. Other Types of Consumables
- 9.1.1. Type of Equipment
- 9.2. Market Analysis, Insights and Forecast - by End User
- 9.2.1. Pharmaceutical
- 9.2.2. Biotechnology
- 9.2.3. Medical Devices
- 9.2.4. Hospitals
- 9.2.5. Semiconductor Manufacturing
- 9.2.6. Other End Users
- 9.1. Market Analysis, Insights and Forecast - by Component
- 10. Latin America Cleanroom Technology Market Analysis, Insights and Forecast, 2019-2031
- 10.1. Market Analysis, Insights and Forecast - by Component
- 10.1.1. Type of Equipment
- 10.1.1.1. Cleanroom Air Showers
- 10.1.1.2. HVAC Systems
- 10.1.1.3. Laminar Air Flow Systems
- 10.1.1.4. High Efficiency Filters
- 10.1.1.5. Desiccator Cabinets
- 10.1.1.6. Fan Filter Units
- 10.1.2. Type of Consumable
- 10.1.2.1. Apparels
- 10.1.2.2. Gloves
- 10.1.2.3. Wipes
- 10.1.2.4. Vacuum Systems
- 10.1.2.5. Disinfectants
- 10.1.2.6. Other Types of Consumables
- 10.1.1. Type of Equipment
- 10.2. Market Analysis, Insights and Forecast - by End User
- 10.2.1. Pharmaceutical
- 10.2.2. Biotechnology
- 10.2.3. Medical Devices
- 10.2.4. Hospitals
- 10.2.5. Semiconductor Manufacturing
- 10.2.6. Other End Users
- 10.1. Market Analysis, Insights and Forecast - by Component
- 11. Middle East and Africa Cleanroom Technology Market Analysis, Insights and Forecast, 2019-2031
- 11.1. Market Analysis, Insights and Forecast - by Component
- 11.1.1. Type of Equipment
- 11.1.1.1. Cleanroom Air Showers
- 11.1.1.2. HVAC Systems
- 11.1.1.3. Laminar Air Flow Systems
- 11.1.1.4. High Efficiency Filters
- 11.1.1.5. Desiccator Cabinets
- 11.1.1.6. Fan Filter Units
- 11.1.2. Type of Consumable
- 11.1.2.1. Apparels
- 11.1.2.2. Gloves
- 11.1.2.3. Wipes
- 11.1.2.4. Vacuum Systems
- 11.1.2.5. Disinfectants
- 11.1.2.6. Other Types of Consumables
- 11.1.1. Type of Equipment
- 11.2. Market Analysis, Insights and Forecast - by End User
- 11.2.1. Pharmaceutical
- 11.2.2. Biotechnology
- 11.2.3. Medical Devices
- 11.2.4. Hospitals
- 11.2.5. Semiconductor Manufacturing
- 11.2.6. Other End Users
- 11.1. Market Analysis, Insights and Forecast - by Component
- 12. North America Cleanroom Technology Market Analysis, Insights and Forecast, 2019-2031
- 12.1. Market Analysis, Insights and Forecast - By Country/Sub-region
- 12.1.1.
- 13. Europe Cleanroom Technology Market Analysis, Insights and Forecast, 2019-2031
- 13.1. Market Analysis, Insights and Forecast - By Country/Sub-region
- 13.1.1.
- 14. Asia Cleanroom Technology Market Analysis, Insights and Forecast, 2019-2031
- 14.1. Market Analysis, Insights and Forecast - By Country/Sub-region
- 14.1.1.
- 15. Australia and New Zealand Cleanroom Technology Market Analysis, Insights and Forecast, 2019-2031
- 15.1. Market Analysis, Insights and Forecast - By Country/Sub-region
- 15.1.1.
- 16. Latin America Cleanroom Technology Market Analysis, Insights and Forecast, 2019-2031
- 16.1. Market Analysis, Insights and Forecast - By Country/Sub-region
- 16.1.1.
- 17. Middle East and Africa Cleanroom Technology Market Analysis, Insights and Forecast, 2019-2031
- 17.1. Market Analysis, Insights and Forecast - By Country/Sub-region
- 17.1.1.
- 18. Competitive Analysis
- 18.1. Global Market Share Analysis 2024
- 18.2. Company Profiles
- 18.2.1 Clean Air Products
- 18.2.1.1. Overview
- 18.2.1.2. Products
- 18.2.1.3. SWOT Analysis
- 18.2.1.4. Recent Developments
- 18.2.1.5. Financials (Based on Availability)
- 18.2.2 Labconco Corporation*List Not Exhaustive
- 18.2.2.1. Overview
- 18.2.2.2. Products
- 18.2.2.3. SWOT Analysis
- 18.2.2.4. Recent Developments
- 18.2.2.5. Financials (Based on Availability)
- 18.2.3 Ardmac Ltd
- 18.2.3.1. Overview
- 18.2.3.2. Products
- 18.2.3.3. SWOT Analysis
- 18.2.3.4. Recent Developments
- 18.2.3.5. Financials (Based on Availability)
- 18.2.4 M+W Group
- 18.2.4.1. Overview
- 18.2.4.2. Products
- 18.2.4.3. SWOT Analysis
- 18.2.4.4. Recent Developments
- 18.2.4.5. Financials (Based on Availability)
- 18.2.5 Taikisha Global Limited
- 18.2.5.1. Overview
- 18.2.5.2. Products
- 18.2.5.3. SWOT Analysis
- 18.2.5.4. Recent Developments
- 18.2.5.5. Financials (Based on Availability)
- 18.2.6 Azbil Corporation
- 18.2.6.1. Overview
- 18.2.6.2. Products
- 18.2.6.3. SWOT Analysis
- 18.2.6.4. Recent Developments
- 18.2.6.5. Financials (Based on Availability)
- 18.2.7 Kimberly Clark Corporation
- 18.2.7.1. Overview
- 18.2.7.2. Products
- 18.2.7.3. SWOT Analysis
- 18.2.7.4. Recent Developments
- 18.2.7.5. Financials (Based on Availability)
- 18.2.8 Ansell Limited
- 18.2.8.1. Overview
- 18.2.8.2. Products
- 18.2.8.3. SWOT Analysis
- 18.2.8.4. Recent Developments
- 18.2.8.5. Financials (Based on Availability)
- 18.2.1 Clean Air Products
List of Figures
- Figure 1: Global Cleanroom Technology Market Revenue Breakdown (Million, %) by Region 2024 & 2032
- Figure 2: North America Cleanroom Technology Market Revenue (Million), by Country 2024 & 2032
- Figure 3: North America Cleanroom Technology Market Revenue Share (%), by Country 2024 & 2032
- Figure 4: Europe Cleanroom Technology Market Revenue (Million), by Country 2024 & 2032
- Figure 5: Europe Cleanroom Technology Market Revenue Share (%), by Country 2024 & 2032
- Figure 6: Asia Cleanroom Technology Market Revenue (Million), by Country 2024 & 2032
- Figure 7: Asia Cleanroom Technology Market Revenue Share (%), by Country 2024 & 2032
- Figure 8: Australia and New Zealand Cleanroom Technology Market Revenue (Million), by Country 2024 & 2032
- Figure 9: Australia and New Zealand Cleanroom Technology Market Revenue Share (%), by Country 2024 & 2032
- Figure 10: Latin America Cleanroom Technology Market Revenue (Million), by Country 2024 & 2032
- Figure 11: Latin America Cleanroom Technology Market Revenue Share (%), by Country 2024 & 2032
- Figure 12: Middle East and Africa Cleanroom Technology Market Revenue (Million), by Country 2024 & 2032
- Figure 13: Middle East and Africa Cleanroom Technology Market Revenue Share (%), by Country 2024 & 2032
- Figure 14: North America Cleanroom Technology Market Revenue (Million), by Component 2024 & 2032
- Figure 15: North America Cleanroom Technology Market Revenue Share (%), by Component 2024 & 2032
- Figure 16: North America Cleanroom Technology Market Revenue (Million), by End User 2024 & 2032
- Figure 17: North America Cleanroom Technology Market Revenue Share (%), by End User 2024 & 2032
- Figure 18: North America Cleanroom Technology Market Revenue (Million), by Country 2024 & 2032
- Figure 19: North America Cleanroom Technology Market Revenue Share (%), by Country 2024 & 2032
- Figure 20: Europe Cleanroom Technology Market Revenue (Million), by Component 2024 & 2032
- Figure 21: Europe Cleanroom Technology Market Revenue Share (%), by Component 2024 & 2032
- Figure 22: Europe Cleanroom Technology Market Revenue (Million), by End User 2024 & 2032
- Figure 23: Europe Cleanroom Technology Market Revenue Share (%), by End User 2024 & 2032
- Figure 24: Europe Cleanroom Technology Market Revenue (Million), by Country 2024 & 2032
- Figure 25: Europe Cleanroom Technology Market Revenue Share (%), by Country 2024 & 2032
- Figure 26: Asia Cleanroom Technology Market Revenue (Million), by Component 2024 & 2032
- Figure 27: Asia Cleanroom Technology Market Revenue Share (%), by Component 2024 & 2032
- Figure 28: Asia Cleanroom Technology Market Revenue (Million), by End User 2024 & 2032
- Figure 29: Asia Cleanroom Technology Market Revenue Share (%), by End User 2024 & 2032
- Figure 30: Asia Cleanroom Technology Market Revenue (Million), by Country 2024 & 2032
- Figure 31: Asia Cleanroom Technology Market Revenue Share (%), by Country 2024 & 2032
- Figure 32: Australia and New Zealand Cleanroom Technology Market Revenue (Million), by Component 2024 & 2032
- Figure 33: Australia and New Zealand Cleanroom Technology Market Revenue Share (%), by Component 2024 & 2032
- Figure 34: Australia and New Zealand Cleanroom Technology Market Revenue (Million), by End User 2024 & 2032
- Figure 35: Australia and New Zealand Cleanroom Technology Market Revenue Share (%), by End User 2024 & 2032
- Figure 36: Australia and New Zealand Cleanroom Technology Market Revenue (Million), by Country 2024 & 2032
- Figure 37: Australia and New Zealand Cleanroom Technology Market Revenue Share (%), by Country 2024 & 2032
- Figure 38: Latin America Cleanroom Technology Market Revenue (Million), by Component 2024 & 2032
- Figure 39: Latin America Cleanroom Technology Market Revenue Share (%), by Component 2024 & 2032
- Figure 40: Latin America Cleanroom Technology Market Revenue (Million), by End User 2024 & 2032
- Figure 41: Latin America Cleanroom Technology Market Revenue Share (%), by End User 2024 & 2032
- Figure 42: Latin America Cleanroom Technology Market Revenue (Million), by Country 2024 & 2032
- Figure 43: Latin America Cleanroom Technology Market Revenue Share (%), by Country 2024 & 2032
- Figure 44: Middle East and Africa Cleanroom Technology Market Revenue (Million), by Component 2024 & 2032
- Figure 45: Middle East and Africa Cleanroom Technology Market Revenue Share (%), by Component 2024 & 2032
- Figure 46: Middle East and Africa Cleanroom Technology Market Revenue (Million), by End User 2024 & 2032
- Figure 47: Middle East and Africa Cleanroom Technology Market Revenue Share (%), by End User 2024 & 2032
- Figure 48: Middle East and Africa Cleanroom Technology Market Revenue (Million), by Country 2024 & 2032
- Figure 49: Middle East and Africa Cleanroom Technology Market Revenue Share (%), by Country 2024 & 2032
List of Tables
- Table 1: Global Cleanroom Technology Market Revenue Million Forecast, by Region 2019 & 2032
- Table 2: Global Cleanroom Technology Market Revenue Million Forecast, by Component 2019 & 2032
- Table 3: Global Cleanroom Technology Market Revenue Million Forecast, by End User 2019 & 2032
- Table 4: Global Cleanroom Technology Market Revenue Million Forecast, by Region 2019 & 2032
- Table 5: Global Cleanroom Technology Market Revenue Million Forecast, by Country 2019 & 2032
- Table 6: Cleanroom Technology Market Revenue (Million) Forecast, by Application 2019 & 2032
- Table 7: Global Cleanroom Technology Market Revenue Million Forecast, by Country 2019 & 2032
- Table 8: Cleanroom Technology Market Revenue (Million) Forecast, by Application 2019 & 2032
- Table 9: Global Cleanroom Technology Market Revenue Million Forecast, by Country 2019 & 2032
- Table 10: Cleanroom Technology Market Revenue (Million) Forecast, by Application 2019 & 2032
- Table 11: Global Cleanroom Technology Market Revenue Million Forecast, by Country 2019 & 2032
- Table 12: Cleanroom Technology Market Revenue (Million) Forecast, by Application 2019 & 2032
- Table 13: Global Cleanroom Technology Market Revenue Million Forecast, by Country 2019 & 2032
- Table 14: Cleanroom Technology Market Revenue (Million) Forecast, by Application 2019 & 2032
- Table 15: Global Cleanroom Technology Market Revenue Million Forecast, by Country 2019 & 2032
- Table 16: Cleanroom Technology Market Revenue (Million) Forecast, by Application 2019 & 2032
- Table 17: Global Cleanroom Technology Market Revenue Million Forecast, by Component 2019 & 2032
- Table 18: Global Cleanroom Technology Market Revenue Million Forecast, by End User 2019 & 2032
- Table 19: Global Cleanroom Technology Market Revenue Million Forecast, by Country 2019 & 2032
- Table 20: Global Cleanroom Technology Market Revenue Million Forecast, by Component 2019 & 2032
- Table 21: Global Cleanroom Technology Market Revenue Million Forecast, by End User 2019 & 2032
- Table 22: Global Cleanroom Technology Market Revenue Million Forecast, by Country 2019 & 2032
- Table 23: Global Cleanroom Technology Market Revenue Million Forecast, by Component 2019 & 2032
- Table 24: Global Cleanroom Technology Market Revenue Million Forecast, by End User 2019 & 2032
- Table 25: Global Cleanroom Technology Market Revenue Million Forecast, by Country 2019 & 2032
- Table 26: Global Cleanroom Technology Market Revenue Million Forecast, by Component 2019 & 2032
- Table 27: Global Cleanroom Technology Market Revenue Million Forecast, by End User 2019 & 2032
- Table 28: Global Cleanroom Technology Market Revenue Million Forecast, by Country 2019 & 2032
- Table 29: Global Cleanroom Technology Market Revenue Million Forecast, by Component 2019 & 2032
- Table 30: Global Cleanroom Technology Market Revenue Million Forecast, by End User 2019 & 2032
- Table 31: Global Cleanroom Technology Market Revenue Million Forecast, by Country 2019 & 2032
- Table 32: Global Cleanroom Technology Market Revenue Million Forecast, by Component 2019 & 2032
- Table 33: Global Cleanroom Technology Market Revenue Million Forecast, by End User 2019 & 2032
- Table 34: Global Cleanroom Technology Market Revenue Million Forecast, by Country 2019 & 2032
Frequently Asked Questions
1. What is the projected Compound Annual Growth Rate (CAGR) of the Cleanroom Technology Market?
The projected CAGR is approximately 7.11%.
2. Which companies are prominent players in the Cleanroom Technology Market?
Key companies in the market include Clean Air Products, Labconco Corporation*List Not Exhaustive, Ardmac Ltd, M+W Group, Taikisha Global Limited, Azbil Corporation, Kimberly Clark Corporation, Ansell Limited.
3. What are the main segments of the Cleanroom Technology Market?
The market segments include Component, End User.
4. Can you provide details about the market size?
The market size is estimated to be USD 9.37 Million as of 2022.
5. What are some drivers contributing to market growth?
Overall Growth in Biotechnology and Healthcare Spending in Major Markets; Stringent Government Regulations and Demand for Quality Products.
6. What are the notable trends driving market growth?
Semiconductor Manufacturing End User Significantly Driving the Market Growth.
7. Are there any restraints impacting market growth?
Lack of Awareness of the Technology in the Market; Lacking the Device Infrastructure to Support the Adoption of Terahertz Technology.
8. Can you provide examples of recent developments in the market?
May 2024: The Cleanroom Technology Conference in the United Kingdom addressed topics ranging from standards and regulations to operational aspects of cleanrooms in pharma and semiconductor manufacturing by the end of May. This two-day event at the National Conference Centre is an excellent opportunity to meet industry professionals and experts to discuss, network, and source products and knowledge for their cleanroom and contamination control processes.
9. What pricing options are available for accessing the report?
Pricing options include single-user, multi-user, and enterprise licenses priced at USD 4750, USD 5250, and USD 8750 respectively.
10. Is the market size provided in terms of value or volume?
The market size is provided in terms of value, measured in Million.
11. Are there any specific market keywords associated with the report?
Yes, the market keyword associated with the report is "Cleanroom Technology Market," which aids in identifying and referencing the specific market segment covered.
12. How do I determine which pricing option suits my needs best?
The pricing options vary based on user requirements and access needs. Individual users may opt for single-user licenses, while businesses requiring broader access may choose multi-user or enterprise licenses for cost-effective access to the report.
13. Are there any additional resources or data provided in the Cleanroom Technology Market report?
While the report offers comprehensive insights, it's advisable to review the specific contents or supplementary materials provided to ascertain if additional resources or data are available.
14. How can I stay updated on further developments or reports in the Cleanroom Technology Market?
To stay informed about further developments, trends, and reports in the Cleanroom Technology Market, consider subscribing to industry newsletters, following relevant companies and organizations, or regularly checking reputable industry news sources and publications.
Methodology
Step 1 - Identification of Relevant Samples Size from Population Database


Step 2 - Approaches for Defining Global Market Size (Value, Volume* & Price*)

Note*: In applicable scenarios
Step 3 - Data Sources
Primary Research
- Web Analytics
- Survey Reports
- Research Institute
- Latest Research Reports
- Opinion Leaders
Secondary Research
- Annual Reports
- White Paper
- Latest Press Release
- Industry Association
- Paid Database
- Investor Presentations

Step 4 - Data Triangulation
Involves using different sources of information in order to increase the validity of a study
These sources are likely to be stakeholders in a program - participants, other researchers, program staff, other community members, and so on.
Then we put all data in single framework & apply various statistical tools to find out the dynamic on the market.
During the analysis stage, feedback from the stakeholder groups would be compared to determine areas of agreement as well as areas of divergence


