
Key Insights
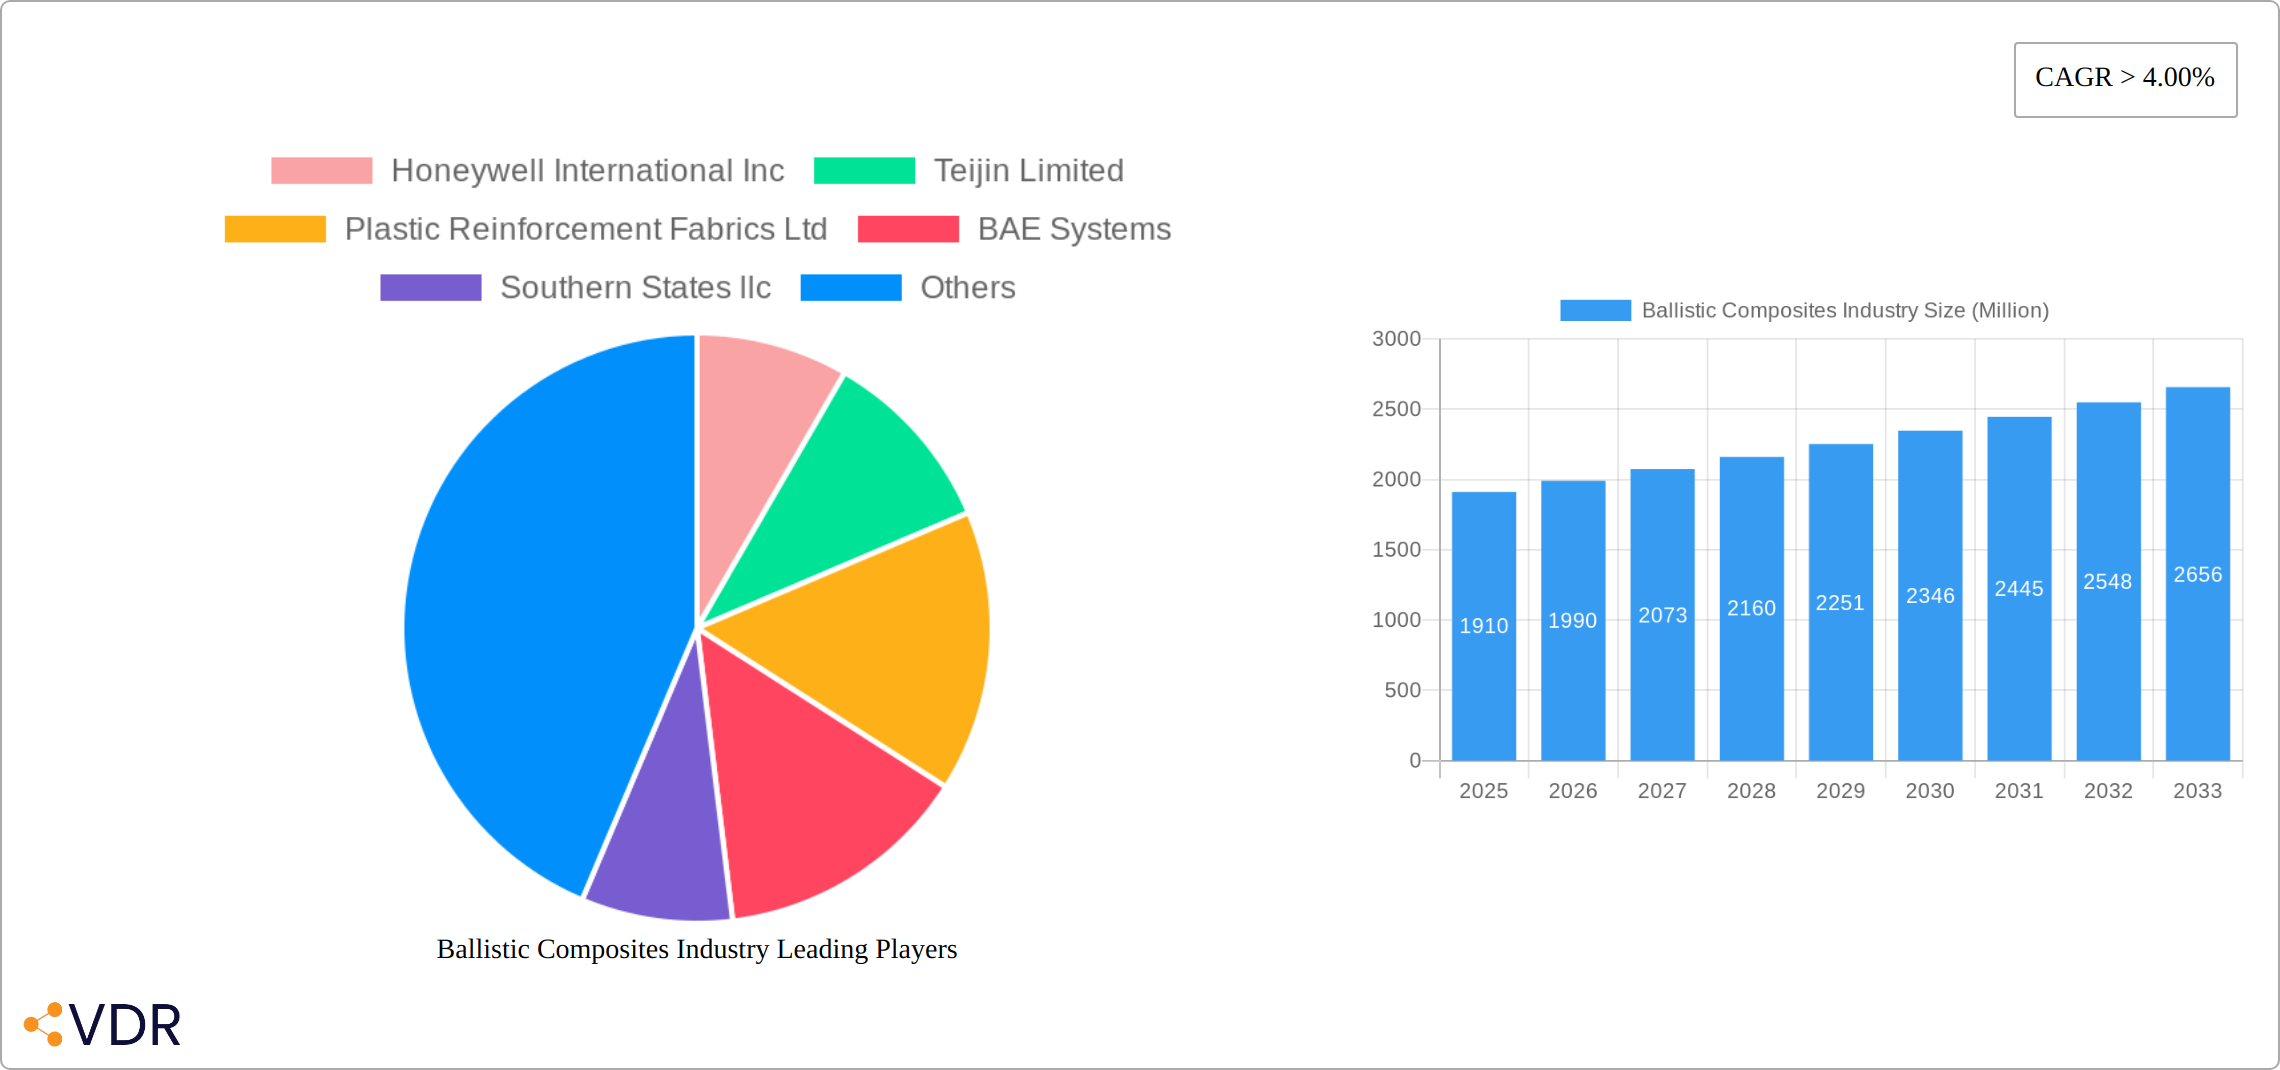
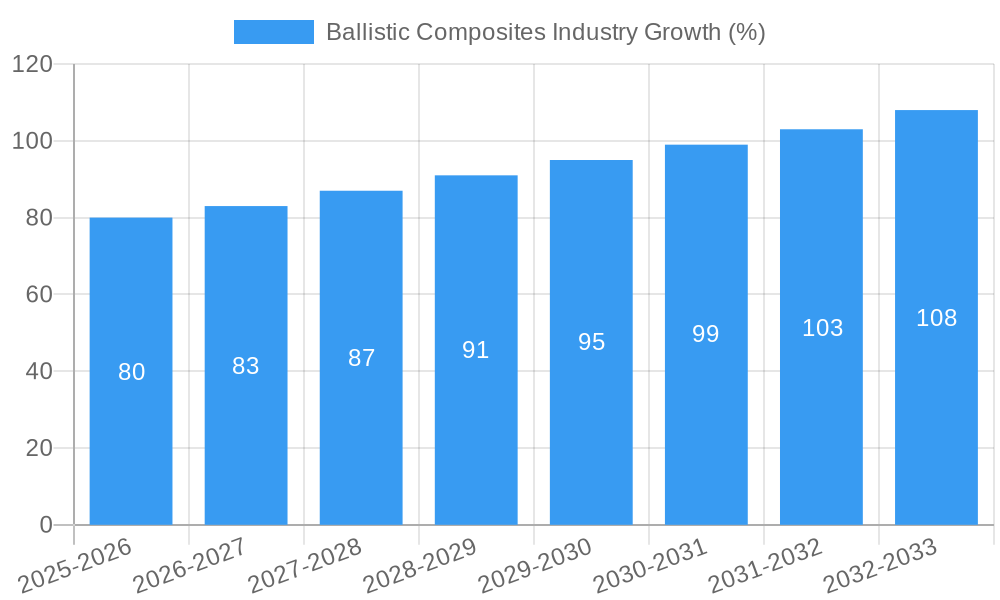
The global ballistic composites market, valued at $1.91 billion in 2025, is projected to experience robust growth, exceeding a 4% CAGR through 2033. This expansion is driven by escalating demand for enhanced personal and vehicle protection across diverse sectors, including military, law enforcement, and civilian applications. The increasing prevalence of terrorist activities and cross-border conflicts fuels the need for advanced ballistic protection solutions. Furthermore, technological advancements in fiber types, such as the development of lighter, stronger, and more flexible materials like UHMWPE and bio-based fibers, are significantly contributing to market growth. The adoption of innovative matrix materials, including polymer-ceramic composites, further enhances the performance and versatility of ballistic composites, opening doors to new applications. Government initiatives focused on enhancing national security and promoting technological advancements in protective gear also bolster market expansion. However, high raw material costs and the complex manufacturing processes associated with ballistic composites present significant challenges to market growth.
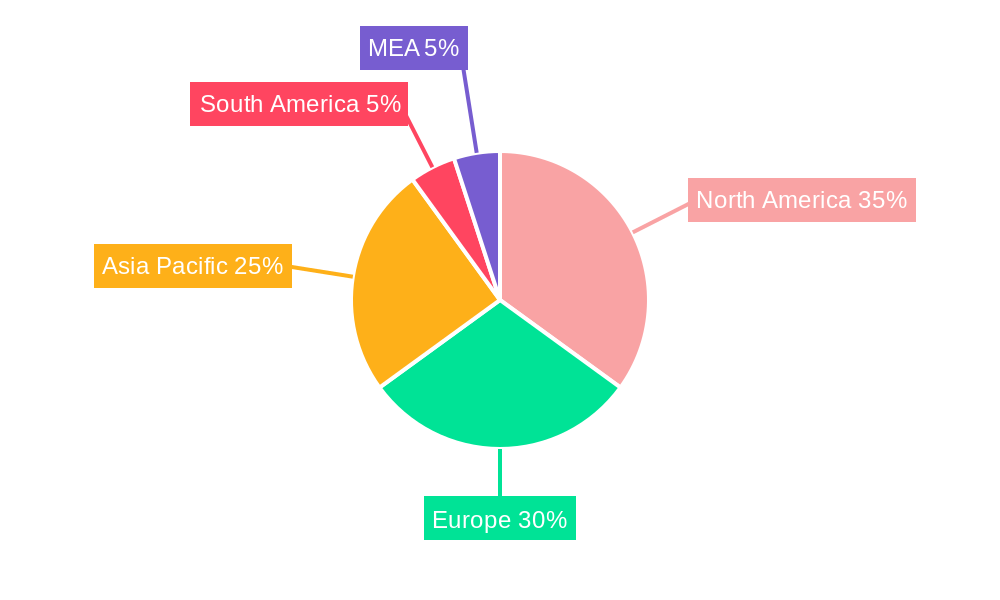
Despite these restraints, the market segmentation reveals promising opportunities. The aramid fiber segment currently dominates due to its established performance and cost-effectiveness, but UHMWPE is experiencing substantial growth owing to its superior ballistic protection properties. The polymer matrix type holds the largest share, though polymer-ceramic composites are gaining traction due to their improved impact resistance and thermal stability. The vehicle armor application segment leads, reflecting the significant demand for protection in military and civilian vehicles. However, the body armor and helmet/face protection segments are experiencing substantial growth, driven by increasing demand for individual protection equipment among law enforcement agencies and civilians. Regional analysis indicates North America and Europe as prominent markets, although the Asia-Pacific region is predicted to witness significant growth driven by rising military spending and increasing urbanization. Key players such as Honeywell International Inc., Teijin Limited, and BAE Systems are actively shaping the market through continuous innovation and strategic partnerships.
Ballistic Composites Industry Market Report: 2019-2033
This comprehensive report provides an in-depth analysis of the Ballistic Composites market, encompassing market dynamics, growth trends, regional segmentation, product landscape, and key players. The study period covers 2019-2033, with 2025 as the base and estimated year. The report utilizes a robust methodology to project market size and growth rates, offering invaluable insights for industry professionals, investors, and strategic decision-makers.
Ballistic Composites Industry Market Dynamics & Structure
The ballistic composites market, valued at $XX million in 2024, is characterized by moderate concentration with key players holding significant market share. Technological advancements, particularly in fiber types and matrix materials, are driving innovation. Stringent regulatory frameworks concerning safety and performance standards influence product development and adoption. Competitive pressure exists from alternative materials, but the unique properties of ballistic composites maintain their dominance. End-user demographics, primarily military and law enforcement, heavily influence demand. The industry witnesses occasional mergers and acquisitions (M&A) activity, with an estimated XX M&A deals concluded between 2019-2024.
- Market Concentration: Moderately concentrated, with top 5 players holding approximately XX% market share in 2024.
- Technological Innovation: Focus on lighter, stronger, and more flexible materials, including bio-based fibers and nanocomposites.
- Regulatory Landscape: Stringent safety and performance standards drive product development and certification.
- Competitive Substitutes: Limited direct substitutes; competition primarily stems from material optimization within the ballistic composites sector itself.
- M&A Activity: Moderate activity, primarily focused on expanding product portfolios and geographical reach.
- Innovation Barriers: High R&D costs, stringent testing and certification requirements.
Ballistic Composites Industry Growth Trends & Insights
The ballistic composites market exhibits a robust Compound Annual Growth Rate (CAGR) of XX% during the forecast period (2025-2033). Market size is projected to reach $XX million by 2033, driven by increasing demand from defense and security sectors, along with expanding applications in high-performance sporting goods and infrastructure protection. Technological disruptions, such as the introduction of advanced fiber types like bio-based fibers and nanocomposites, are further accelerating market growth. Consumer behavior is shifting towards lighter, more comfortable, and customizable ballistic protection solutions.
Dominant Regions, Countries, or Segments in Ballistic Composites Industry
North America holds the largest market share, followed by Europe and Asia-Pacific. Within fiber types, Aramids dominate due to their high strength-to-weight ratio and cost-effectiveness. Polymer matrices hold the largest share in the matrix type segment, owing to their versatility and processability. Body armor represents the largest application segment, driven by consistent demand from law enforcement and military personnel.
- Leading Region: North America (XX% market share in 2024)
- Dominant Fiber Type: Aramids (XX% market share in 2024)
- Leading Matrix Type: Polymer (XX% market share in 2024)
- Largest Application Segment: Body Armor (XX% market share in 2024)
- Key Drivers: Increasing defense budgets, growing security concerns, and technological advancements.
Ballistic Composites Industry Product Landscape
The ballistic composites market offers a diverse range of products, including body armor, vehicle armor, helmets, and specialized shields. Innovations focus on enhanced ballistic performance, reduced weight, and improved comfort. Products often incorporate features like modularity, customizability, and advanced materials to meet specific user requirements. Unique selling propositions revolve around superior protection, weight reduction, and ergonomic design. Technological advancements focus on the development of lighter, stronger, and more flexible materials, including bio-based fibers and nanocomposites.
Key Drivers, Barriers & Challenges in Ballistic Composites Industry
Key Drivers: The ballistic composites industry is experiencing robust growth fueled by several key factors. Globally increased defense spending, coupled with rising terrorism and crime rates, significantly boosts demand for advanced protective solutions. The expanding need for personal protective equipment (PPE) across diverse sectors, from law enforcement to industrial safety, further fuels market expansion. Critically, continuous technological advancements in fiber and matrix materials are enabling the development of lighter, stronger, and more adaptable ballistic composites, opening new application avenues.
Challenges: Despite the significant growth potential, the industry faces considerable hurdles. High raw material costs, particularly for specialized fibers like aramid and carbon nanotubes, represent a major challenge, impacting profitability and pricing strategies. Stringent regulatory compliance requirements, varying across different geographical regions, add complexity and increase development costs. Furthermore, the intricate manufacturing processes involved in producing high-performance ballistic composites necessitate specialized expertise and advanced equipment, contributing to higher production costs. Intense competitive pricing pressures further complicate the market landscape. Supply chain disruptions remain a significant threat; for example, material scarcity impacted production by an estimated XX% in 2022, highlighting the industry's vulnerability to geopolitical instability and resource availability. These factors necessitate robust supply chain diversification and risk mitigation strategies.
Emerging Opportunities in Ballistic Composites Industry
Significant untapped market potential exists within civilian applications. Security personnel, construction workers, and emergency responders represent key target demographics for enhanced protective gear. The burgeoning drone industry presents a compelling new application area, driving demand for lightweight and effective drone protection solutions. Furthermore, the high-performance sporting goods sector is increasingly adopting ballistic composite materials for superior protection and durability. Evolving consumer preferences are demanding personalized and customizable ballistic protection solutions, requiring manufacturers to offer tailored products and services.
Growth Accelerators in the Ballistic Composites Industry
Technological breakthroughs in advanced materials science and manufacturing processes are pivotal growth catalysts. The development of novel fibers, resins, and manufacturing techniques is leading to lighter, more flexible, and more comfortable ballistic protection solutions. Strategic partnerships between material suppliers, manufacturers, and end-users are fostering innovation and driving market expansion through collaborative research and development efforts. These partnerships facilitate the efficient integration of new materials and technologies into commercially viable products. Finally, market expansion into developing countries, where security needs are often significant and unmet, represents a substantial growth opportunity, provided appropriate distribution channels and affordability solutions can be developed.
Key Players Shaping the Ballistic Composites Industry Market
- Honeywell International Inc
- Teijin Limited
- Plastic Reinforcement Fabrics Ltd
- BAE Systems
- Southern States llc
- Roihu Inc
- Barrday Inc
- TenCate Protective Fabrics
- MKU LIMITED
- Coherent Corp
- Integris
- Morgan Advanced Materials
- DSM
- DuPont
- Gaffco Ballistics
- Gurit Holding AG
- ArmorCore
Notable Milestones in Ballistic Composites Industry Sector
- November 2023: Integris Composites launched its Rapid Don/Doff body armor vests, reducing donning/doffing time by 50% or more, significantly improving user experience and operational efficiency.
- November 2023: Integris Composites unveiled customizable ballistic shields and vests ("Stand 5 F009") at Milipol Paris, showcasing advancements in personalization and adaptability of ballistic protection solutions.
In-Depth Ballistic Composites Industry Market Outlook
The ballistic composites market is projected to experience sustained growth, driven by the convergence of several factors. Continuous technological advancements are generating superior materials and manufacturing processes, expanding the range of applications and improving performance characteristics. Escalating global security concerns, both in military and civilian sectors, will continuously drive demand for reliable and effective ballistic protection. Strategic partnerships and collaborations among industry players are essential for fostering innovation and optimizing supply chains. The market will continue to be shaped by a persistent focus on developing lighter, stronger, and more comfortable solutions that enhance user protection and mobility. Companies that successfully leverage technological advancements and adapt to evolving customer needs will be well-positioned to capitalize on the significant market opportunities within this dynamic sector.
Ballistic Composites Industry Segmentation
-
1. Fiber Type
- 1.1. Aramids
- 1.2. Ultra-high-molecular Weight Polyethylene (UHMWPE)
- 1.3. S-glass
- 1.4. Others F
-
2. Matrix Type
- 2.1. Polymer
- 2.2. Polymer-ceramic
- 2.3. Metal
-
3. Application
- 3.1. Vehicle Armor
- 3.2. Body Armor
- 3.3. Helmet and Face Protection
- 3.4. Other Ap
Ballistic Composites Industry Segmentation By Geography
-
1. Asia Pacific
- 1.1. China
- 1.2. India
- 1.3. Japan
- 1.4. South Korea
- 1.5. Rest of Asia Pacific
-
2. North America
- 2.1. United States
- 2.2. Canada
- 2.3. Mexico
-
3. Europe
- 3.1. Germany
- 3.2. United Kingdom
- 3.3. Italy
- 3.4. France
- 3.5. Spain
- 3.6. Rest of Europe
-
4. South America
- 4.1. Brazil
- 4.2. Argentina
- 4.3. Rest of South America
-
5. Middle East and Africa
- 5.1. Saudi Arabia
- 5.2. South Africa
- 5.3. Rest of Middle East and Africa
Ballistic Composites Industry REPORT HIGHLIGHTS
| Aspects | Details |
|---|---|
| Study Period | 2019-2033 |
| Base Year | 2024 |
| Estimated Year | 2025 |
| Forecast Period | 2025-2033 |
| Historical Period | 2019-2024 |
| Growth Rate | CAGR of > 4.00% from 2019-2033 |
| Segmentation |
|
Table of Contents
- 1. Introduction
- 1.1. Research Scope
- 1.2. Market Segmentation
- 1.3. Research Methodology
- 1.4. Definitions and Assumptions
- 2. Executive Summary
- 2.1. Introduction
- 3. Market Dynamics
- 3.1. Introduction
- 3.2. Market Drivers
- 3.2.1. Rise in Defense Expenditure; Increasing Demand for Lightweight Materials in the Aerospace and Defense Industry; Other Drivers
- 3.3. Market Restrains
- 3.3.1. High Processing and Manufacturing Costs; Volatile Raw Material Supply
- 3.4. Market Trends
- 3.4.1. Increasing Demand for Vehicle Armors
- 4. Market Factor Analysis
- 4.1. Porters Five Forces
- 4.2. Supply/Value Chain
- 4.3. PESTEL analysis
- 4.4. Market Entropy
- 4.5. Patent/Trademark Analysis
- 5. Global Ballistic Composites Industry Analysis, Insights and Forecast, 2019-2031
- 5.1. Market Analysis, Insights and Forecast - by Fiber Type
- 5.1.1. Aramids
- 5.1.2. Ultra-high-molecular Weight Polyethylene (UHMWPE)
- 5.1.3. S-glass
- 5.1.4. Others F
- 5.2. Market Analysis, Insights and Forecast - by Matrix Type
- 5.2.1. Polymer
- 5.2.2. Polymer-ceramic
- 5.2.3. Metal
- 5.3. Market Analysis, Insights and Forecast - by Application
- 5.3.1. Vehicle Armor
- 5.3.2. Body Armor
- 5.3.3. Helmet and Face Protection
- 5.3.4. Other Ap
- 5.4. Market Analysis, Insights and Forecast - by Region
- 5.4.1. Asia Pacific
- 5.4.2. North America
- 5.4.3. Europe
- 5.4.4. South America
- 5.4.5. Middle East and Africa
- 5.1. Market Analysis, Insights and Forecast - by Fiber Type
- 6. Asia Pacific Ballistic Composites Industry Analysis, Insights and Forecast, 2019-2031
- 6.1. Market Analysis, Insights and Forecast - by Fiber Type
- 6.1.1. Aramids
- 6.1.2. Ultra-high-molecular Weight Polyethylene (UHMWPE)
- 6.1.3. S-glass
- 6.1.4. Others F
- 6.2. Market Analysis, Insights and Forecast - by Matrix Type
- 6.2.1. Polymer
- 6.2.2. Polymer-ceramic
- 6.2.3. Metal
- 6.3. Market Analysis, Insights and Forecast - by Application
- 6.3.1. Vehicle Armor
- 6.3.2. Body Armor
- 6.3.3. Helmet and Face Protection
- 6.3.4. Other Ap
- 6.1. Market Analysis, Insights and Forecast - by Fiber Type
- 7. North America Ballistic Composites Industry Analysis, Insights and Forecast, 2019-2031
- 7.1. Market Analysis, Insights and Forecast - by Fiber Type
- 7.1.1. Aramids
- 7.1.2. Ultra-high-molecular Weight Polyethylene (UHMWPE)
- 7.1.3. S-glass
- 7.1.4. Others F
- 7.2. Market Analysis, Insights and Forecast - by Matrix Type
- 7.2.1. Polymer
- 7.2.2. Polymer-ceramic
- 7.2.3. Metal
- 7.3. Market Analysis, Insights and Forecast - by Application
- 7.3.1. Vehicle Armor
- 7.3.2. Body Armor
- 7.3.3. Helmet and Face Protection
- 7.3.4. Other Ap
- 7.1. Market Analysis, Insights and Forecast - by Fiber Type
- 8. Europe Ballistic Composites Industry Analysis, Insights and Forecast, 2019-2031
- 8.1. Market Analysis, Insights and Forecast - by Fiber Type
- 8.1.1. Aramids
- 8.1.2. Ultra-high-molecular Weight Polyethylene (UHMWPE)
- 8.1.3. S-glass
- 8.1.4. Others F
- 8.2. Market Analysis, Insights and Forecast - by Matrix Type
- 8.2.1. Polymer
- 8.2.2. Polymer-ceramic
- 8.2.3. Metal
- 8.3. Market Analysis, Insights and Forecast - by Application
- 8.3.1. Vehicle Armor
- 8.3.2. Body Armor
- 8.3.3. Helmet and Face Protection
- 8.3.4. Other Ap
- 8.1. Market Analysis, Insights and Forecast - by Fiber Type
- 9. South America Ballistic Composites Industry Analysis, Insights and Forecast, 2019-2031
- 9.1. Market Analysis, Insights and Forecast - by Fiber Type
- 9.1.1. Aramids
- 9.1.2. Ultra-high-molecular Weight Polyethylene (UHMWPE)
- 9.1.3. S-glass
- 9.1.4. Others F
- 9.2. Market Analysis, Insights and Forecast - by Matrix Type
- 9.2.1. Polymer
- 9.2.2. Polymer-ceramic
- 9.2.3. Metal
- 9.3. Market Analysis, Insights and Forecast - by Application
- 9.3.1. Vehicle Armor
- 9.3.2. Body Armor
- 9.3.3. Helmet and Face Protection
- 9.3.4. Other Ap
- 9.1. Market Analysis, Insights and Forecast - by Fiber Type
- 10. Middle East and Africa Ballistic Composites Industry Analysis, Insights and Forecast, 2019-2031
- 10.1. Market Analysis, Insights and Forecast - by Fiber Type
- 10.1.1. Aramids
- 10.1.2. Ultra-high-molecular Weight Polyethylene (UHMWPE)
- 10.1.3. S-glass
- 10.1.4. Others F
- 10.2. Market Analysis, Insights and Forecast - by Matrix Type
- 10.2.1. Polymer
- 10.2.2. Polymer-ceramic
- 10.2.3. Metal
- 10.3. Market Analysis, Insights and Forecast - by Application
- 10.3.1. Vehicle Armor
- 10.3.2. Body Armor
- 10.3.3. Helmet and Face Protection
- 10.3.4. Other Ap
- 10.1. Market Analysis, Insights and Forecast - by Fiber Type
- 11. North America Ballistic Composites Industry Analysis, Insights and Forecast, 2019-2031
- 11.1. Market Analysis, Insights and Forecast - By Country/Sub-region
- 11.1.1 United States
- 11.1.2 Canada
- 11.1.3 Mexico
- 12. Europe Ballistic Composites Industry Analysis, Insights and Forecast, 2019-2031
- 12.1. Market Analysis, Insights and Forecast - By Country/Sub-region
- 12.1.1 Germany
- 12.1.2 France
- 12.1.3 Italy
- 12.1.4 United Kingdom
- 12.1.5 Netherlands
- 12.1.6 Rest of Europe
- 13. Asia Pacific Ballistic Composites Industry Analysis, Insights and Forecast, 2019-2031
- 13.1. Market Analysis, Insights and Forecast - By Country/Sub-region
- 13.1.1 China
- 13.1.2 Japan
- 13.1.3 India
- 13.1.4 South Korea
- 13.1.5 Taiwan
- 13.1.6 Australia
- 13.1.7 Rest of Asia-Pacific
- 14. South America Ballistic Composites Industry Analysis, Insights and Forecast, 2019-2031
- 14.1. Market Analysis, Insights and Forecast - By Country/Sub-region
- 14.1.1 Brazil
- 14.1.2 Argentina
- 14.1.3 Rest of South America
- 15. MEA Ballistic Composites Industry Analysis, Insights and Forecast, 2019-2031
- 15.1. Market Analysis, Insights and Forecast - By Country/Sub-region
- 15.1.1 Middle East
- 15.1.2 Africa
- 16. Competitive Analysis
- 16.1. Global Market Share Analysis 2024
- 16.2. Company Profiles
- 16.2.1 Honeywell International Inc
- 16.2.1.1. Overview
- 16.2.1.2. Products
- 16.2.1.3. SWOT Analysis
- 16.2.1.4. Recent Developments
- 16.2.1.5. Financials (Based on Availability)
- 16.2.2 Teijin Limited
- 16.2.2.1. Overview
- 16.2.2.2. Products
- 16.2.2.3. SWOT Analysis
- 16.2.2.4. Recent Developments
- 16.2.2.5. Financials (Based on Availability)
- 16.2.3 Plastic Reinforcement Fabrics Ltd
- 16.2.3.1. Overview
- 16.2.3.2. Products
- 16.2.3.3. SWOT Analysis
- 16.2.3.4. Recent Developments
- 16.2.3.5. Financials (Based on Availability)
- 16.2.4 BAE Systems
- 16.2.4.1. Overview
- 16.2.4.2. Products
- 16.2.4.3. SWOT Analysis
- 16.2.4.4. Recent Developments
- 16.2.4.5. Financials (Based on Availability)
- 16.2.5 Southern States llc
- 16.2.5.1. Overview
- 16.2.5.2. Products
- 16.2.5.3. SWOT Analysis
- 16.2.5.4. Recent Developments
- 16.2.5.5. Financials (Based on Availability)
- 16.2.6 Roihu Inc
- 16.2.6.1. Overview
- 16.2.6.2. Products
- 16.2.6.3. SWOT Analysis
- 16.2.6.4. Recent Developments
- 16.2.6.5. Financials (Based on Availability)
- 16.2.7 Barrday Inc
- 16.2.7.1. Overview
- 16.2.7.2. Products
- 16.2.7.3. SWOT Analysis
- 16.2.7.4. Recent Developments
- 16.2.7.5. Financials (Based on Availability)
- 16.2.8 TenCate Protective Fabrics
- 16.2.8.1. Overview
- 16.2.8.2. Products
- 16.2.8.3. SWOT Analysis
- 16.2.8.4. Recent Developments
- 16.2.8.5. Financials (Based on Availability)
- 16.2.9 MKU LIMITED
- 16.2.9.1. Overview
- 16.2.9.2. Products
- 16.2.9.3. SWOT Analysis
- 16.2.9.4. Recent Developments
- 16.2.9.5. Financials (Based on Availability)
- 16.2.10 Coherent Corp
- 16.2.10.1. Overview
- 16.2.10.2. Products
- 16.2.10.3. SWOT Analysis
- 16.2.10.4. Recent Developments
- 16.2.10.5. Financials (Based on Availability)
- 16.2.11 Integris
- 16.2.11.1. Overview
- 16.2.11.2. Products
- 16.2.11.3. SWOT Analysis
- 16.2.11.4. Recent Developments
- 16.2.11.5. Financials (Based on Availability)
- 16.2.12 Morgan Advanced Materials
- 16.2.12.1. Overview
- 16.2.12.2. Products
- 16.2.12.3. SWOT Analysis
- 16.2.12.4. Recent Developments
- 16.2.12.5. Financials (Based on Availability)
- 16.2.13 DSM
- 16.2.13.1. Overview
- 16.2.13.2. Products
- 16.2.13.3. SWOT Analysis
- 16.2.13.4. Recent Developments
- 16.2.13.5. Financials (Based on Availability)
- 16.2.14 DuPont
- 16.2.14.1. Overview
- 16.2.14.2. Products
- 16.2.14.3. SWOT Analysis
- 16.2.14.4. Recent Developments
- 16.2.14.5. Financials (Based on Availability)
- 16.2.15 Gaffco Ballistics
- 16.2.15.1. Overview
- 16.2.15.2. Products
- 16.2.15.3. SWOT Analysis
- 16.2.15.4. Recent Developments
- 16.2.15.5. Financials (Based on Availability)
- 16.2.16 Gurit Holding AG
- 16.2.16.1. Overview
- 16.2.16.2. Products
- 16.2.16.3. SWOT Analysis
- 16.2.16.4. Recent Developments
- 16.2.16.5. Financials (Based on Availability)
- 16.2.17 ArmorCore
- 16.2.17.1. Overview
- 16.2.17.2. Products
- 16.2.17.3. SWOT Analysis
- 16.2.17.4. Recent Developments
- 16.2.17.5. Financials (Based on Availability)
- 16.2.1 Honeywell International Inc
List of Figures
- Figure 1: Global Ballistic Composites Industry Revenue Breakdown (Million, %) by Region 2024 & 2032
- Figure 2: Global Ballistic Composites Industry Volume Breakdown (K Tons, %) by Region 2024 & 2032
- Figure 3: North America Ballistic Composites Industry Revenue (Million), by Country 2024 & 2032
- Figure 4: North America Ballistic Composites Industry Volume (K Tons), by Country 2024 & 2032
- Figure 5: North America Ballistic Composites Industry Revenue Share (%), by Country 2024 & 2032
- Figure 6: North America Ballistic Composites Industry Volume Share (%), by Country 2024 & 2032
- Figure 7: Europe Ballistic Composites Industry Revenue (Million), by Country 2024 & 2032
- Figure 8: Europe Ballistic Composites Industry Volume (K Tons), by Country 2024 & 2032
- Figure 9: Europe Ballistic Composites Industry Revenue Share (%), by Country 2024 & 2032
- Figure 10: Europe Ballistic Composites Industry Volume Share (%), by Country 2024 & 2032
- Figure 11: Asia Pacific Ballistic Composites Industry Revenue (Million), by Country 2024 & 2032
- Figure 12: Asia Pacific Ballistic Composites Industry Volume (K Tons), by Country 2024 & 2032
- Figure 13: Asia Pacific Ballistic Composites Industry Revenue Share (%), by Country 2024 & 2032
- Figure 14: Asia Pacific Ballistic Composites Industry Volume Share (%), by Country 2024 & 2032
- Figure 15: South America Ballistic Composites Industry Revenue (Million), by Country 2024 & 2032
- Figure 16: South America Ballistic Composites Industry Volume (K Tons), by Country 2024 & 2032
- Figure 17: South America Ballistic Composites Industry Revenue Share (%), by Country 2024 & 2032
- Figure 18: South America Ballistic Composites Industry Volume Share (%), by Country 2024 & 2032
- Figure 19: MEA Ballistic Composites Industry Revenue (Million), by Country 2024 & 2032
- Figure 20: MEA Ballistic Composites Industry Volume (K Tons), by Country 2024 & 2032
- Figure 21: MEA Ballistic Composites Industry Revenue Share (%), by Country 2024 & 2032
- Figure 22: MEA Ballistic Composites Industry Volume Share (%), by Country 2024 & 2032
- Figure 23: Asia Pacific Ballistic Composites Industry Revenue (Million), by Fiber Type 2024 & 2032
- Figure 24: Asia Pacific Ballistic Composites Industry Volume (K Tons), by Fiber Type 2024 & 2032
- Figure 25: Asia Pacific Ballistic Composites Industry Revenue Share (%), by Fiber Type 2024 & 2032
- Figure 26: Asia Pacific Ballistic Composites Industry Volume Share (%), by Fiber Type 2024 & 2032
- Figure 27: Asia Pacific Ballistic Composites Industry Revenue (Million), by Matrix Type 2024 & 2032
- Figure 28: Asia Pacific Ballistic Composites Industry Volume (K Tons), by Matrix Type 2024 & 2032
- Figure 29: Asia Pacific Ballistic Composites Industry Revenue Share (%), by Matrix Type 2024 & 2032
- Figure 30: Asia Pacific Ballistic Composites Industry Volume Share (%), by Matrix Type 2024 & 2032
- Figure 31: Asia Pacific Ballistic Composites Industry Revenue (Million), by Application 2024 & 2032
- Figure 32: Asia Pacific Ballistic Composites Industry Volume (K Tons), by Application 2024 & 2032
- Figure 33: Asia Pacific Ballistic Composites Industry Revenue Share (%), by Application 2024 & 2032
- Figure 34: Asia Pacific Ballistic Composites Industry Volume Share (%), by Application 2024 & 2032
- Figure 35: Asia Pacific Ballistic Composites Industry Revenue (Million), by Country 2024 & 2032
- Figure 36: Asia Pacific Ballistic Composites Industry Volume (K Tons), by Country 2024 & 2032
- Figure 37: Asia Pacific Ballistic Composites Industry Revenue Share (%), by Country 2024 & 2032
- Figure 38: Asia Pacific Ballistic Composites Industry Volume Share (%), by Country 2024 & 2032
- Figure 39: North America Ballistic Composites Industry Revenue (Million), by Fiber Type 2024 & 2032
- Figure 40: North America Ballistic Composites Industry Volume (K Tons), by Fiber Type 2024 & 2032
- Figure 41: North America Ballistic Composites Industry Revenue Share (%), by Fiber Type 2024 & 2032
- Figure 42: North America Ballistic Composites Industry Volume Share (%), by Fiber Type 2024 & 2032
- Figure 43: North America Ballistic Composites Industry Revenue (Million), by Matrix Type 2024 & 2032
- Figure 44: North America Ballistic Composites Industry Volume (K Tons), by Matrix Type 2024 & 2032
- Figure 45: North America Ballistic Composites Industry Revenue Share (%), by Matrix Type 2024 & 2032
- Figure 46: North America Ballistic Composites Industry Volume Share (%), by Matrix Type 2024 & 2032
- Figure 47: North America Ballistic Composites Industry Revenue (Million), by Application 2024 & 2032
- Figure 48: North America Ballistic Composites Industry Volume (K Tons), by Application 2024 & 2032
- Figure 49: North America Ballistic Composites Industry Revenue Share (%), by Application 2024 & 2032
- Figure 50: North America Ballistic Composites Industry Volume Share (%), by Application 2024 & 2032
- Figure 51: North America Ballistic Composites Industry Revenue (Million), by Country 2024 & 2032
- Figure 52: North America Ballistic Composites Industry Volume (K Tons), by Country 2024 & 2032
- Figure 53: North America Ballistic Composites Industry Revenue Share (%), by Country 2024 & 2032
- Figure 54: North America Ballistic Composites Industry Volume Share (%), by Country 2024 & 2032
- Figure 55: Europe Ballistic Composites Industry Revenue (Million), by Fiber Type 2024 & 2032
- Figure 56: Europe Ballistic Composites Industry Volume (K Tons), by Fiber Type 2024 & 2032
- Figure 57: Europe Ballistic Composites Industry Revenue Share (%), by Fiber Type 2024 & 2032
- Figure 58: Europe Ballistic Composites Industry Volume Share (%), by Fiber Type 2024 & 2032
- Figure 59: Europe Ballistic Composites Industry Revenue (Million), by Matrix Type 2024 & 2032
- Figure 60: Europe Ballistic Composites Industry Volume (K Tons), by Matrix Type 2024 & 2032
- Figure 61: Europe Ballistic Composites Industry Revenue Share (%), by Matrix Type 2024 & 2032
- Figure 62: Europe Ballistic Composites Industry Volume Share (%), by Matrix Type 2024 & 2032
- Figure 63: Europe Ballistic Composites Industry Revenue (Million), by Application 2024 & 2032
- Figure 64: Europe Ballistic Composites Industry Volume (K Tons), by Application 2024 & 2032
- Figure 65: Europe Ballistic Composites Industry Revenue Share (%), by Application 2024 & 2032
- Figure 66: Europe Ballistic Composites Industry Volume Share (%), by Application 2024 & 2032
- Figure 67: Europe Ballistic Composites Industry Revenue (Million), by Country 2024 & 2032
- Figure 68: Europe Ballistic Composites Industry Volume (K Tons), by Country 2024 & 2032
- Figure 69: Europe Ballistic Composites Industry Revenue Share (%), by Country 2024 & 2032
- Figure 70: Europe Ballistic Composites Industry Volume Share (%), by Country 2024 & 2032
- Figure 71: South America Ballistic Composites Industry Revenue (Million), by Fiber Type 2024 & 2032
- Figure 72: South America Ballistic Composites Industry Volume (K Tons), by Fiber Type 2024 & 2032
- Figure 73: South America Ballistic Composites Industry Revenue Share (%), by Fiber Type 2024 & 2032
- Figure 74: South America Ballistic Composites Industry Volume Share (%), by Fiber Type 2024 & 2032
- Figure 75: South America Ballistic Composites Industry Revenue (Million), by Matrix Type 2024 & 2032
- Figure 76: South America Ballistic Composites Industry Volume (K Tons), by Matrix Type 2024 & 2032
- Figure 77: South America Ballistic Composites Industry Revenue Share (%), by Matrix Type 2024 & 2032
- Figure 78: South America Ballistic Composites Industry Volume Share (%), by Matrix Type 2024 & 2032
- Figure 79: South America Ballistic Composites Industry Revenue (Million), by Application 2024 & 2032
- Figure 80: South America Ballistic Composites Industry Volume (K Tons), by Application 2024 & 2032
- Figure 81: South America Ballistic Composites Industry Revenue Share (%), by Application 2024 & 2032
- Figure 82: South America Ballistic Composites Industry Volume Share (%), by Application 2024 & 2032
- Figure 83: South America Ballistic Composites Industry Revenue (Million), by Country 2024 & 2032
- Figure 84: South America Ballistic Composites Industry Volume (K Tons), by Country 2024 & 2032
- Figure 85: South America Ballistic Composites Industry Revenue Share (%), by Country 2024 & 2032
- Figure 86: South America Ballistic Composites Industry Volume Share (%), by Country 2024 & 2032
- Figure 87: Middle East and Africa Ballistic Composites Industry Revenue (Million), by Fiber Type 2024 & 2032
- Figure 88: Middle East and Africa Ballistic Composites Industry Volume (K Tons), by Fiber Type 2024 & 2032
- Figure 89: Middle East and Africa Ballistic Composites Industry Revenue Share (%), by Fiber Type 2024 & 2032
- Figure 90: Middle East and Africa Ballistic Composites Industry Volume Share (%), by Fiber Type 2024 & 2032
- Figure 91: Middle East and Africa Ballistic Composites Industry Revenue (Million), by Matrix Type 2024 & 2032
- Figure 92: Middle East and Africa Ballistic Composites Industry Volume (K Tons), by Matrix Type 2024 & 2032
- Figure 93: Middle East and Africa Ballistic Composites Industry Revenue Share (%), by Matrix Type 2024 & 2032
- Figure 94: Middle East and Africa Ballistic Composites Industry Volume Share (%), by Matrix Type 2024 & 2032
- Figure 95: Middle East and Africa Ballistic Composites Industry Revenue (Million), by Application 2024 & 2032
- Figure 96: Middle East and Africa Ballistic Composites Industry Volume (K Tons), by Application 2024 & 2032
- Figure 97: Middle East and Africa Ballistic Composites Industry Revenue Share (%), by Application 2024 & 2032
- Figure 98: Middle East and Africa Ballistic Composites Industry Volume Share (%), by Application 2024 & 2032
- Figure 99: Middle East and Africa Ballistic Composites Industry Revenue (Million), by Country 2024 & 2032
- Figure 100: Middle East and Africa Ballistic Composites Industry Volume (K Tons), by Country 2024 & 2032
- Figure 101: Middle East and Africa Ballistic Composites Industry Revenue Share (%), by Country 2024 & 2032
- Figure 102: Middle East and Africa Ballistic Composites Industry Volume Share (%), by Country 2024 & 2032
List of Tables
- Table 1: Global Ballistic Composites Industry Revenue Million Forecast, by Region 2019 & 2032
- Table 2: Global Ballistic Composites Industry Volume K Tons Forecast, by Region 2019 & 2032
- Table 3: Global Ballistic Composites Industry Revenue Million Forecast, by Fiber Type 2019 & 2032
- Table 4: Global Ballistic Composites Industry Volume K Tons Forecast, by Fiber Type 2019 & 2032
- Table 5: Global Ballistic Composites Industry Revenue Million Forecast, by Matrix Type 2019 & 2032
- Table 6: Global Ballistic Composites Industry Volume K Tons Forecast, by Matrix Type 2019 & 2032
- Table 7: Global Ballistic Composites Industry Revenue Million Forecast, by Application 2019 & 2032
- Table 8: Global Ballistic Composites Industry Volume K Tons Forecast, by Application 2019 & 2032
- Table 9: Global Ballistic Composites Industry Revenue Million Forecast, by Region 2019 & 2032
- Table 10: Global Ballistic Composites Industry Volume K Tons Forecast, by Region 2019 & 2032
- Table 11: Global Ballistic Composites Industry Revenue Million Forecast, by Country 2019 & 2032
- Table 12: Global Ballistic Composites Industry Volume K Tons Forecast, by Country 2019 & 2032
- Table 13: United States Ballistic Composites Industry Revenue (Million) Forecast, by Application 2019 & 2032
- Table 14: United States Ballistic Composites Industry Volume (K Tons) Forecast, by Application 2019 & 2032
- Table 15: Canada Ballistic Composites Industry Revenue (Million) Forecast, by Application 2019 & 2032
- Table 16: Canada Ballistic Composites Industry Volume (K Tons) Forecast, by Application 2019 & 2032
- Table 17: Mexico Ballistic Composites Industry Revenue (Million) Forecast, by Application 2019 & 2032
- Table 18: Mexico Ballistic Composites Industry Volume (K Tons) Forecast, by Application 2019 & 2032
- Table 19: Global Ballistic Composites Industry Revenue Million Forecast, by Country 2019 & 2032
- Table 20: Global Ballistic Composites Industry Volume K Tons Forecast, by Country 2019 & 2032
- Table 21: Germany Ballistic Composites Industry Revenue (Million) Forecast, by Application 2019 & 2032
- Table 22: Germany Ballistic Composites Industry Volume (K Tons) Forecast, by Application 2019 & 2032
- Table 23: France Ballistic Composites Industry Revenue (Million) Forecast, by Application 2019 & 2032
- Table 24: France Ballistic Composites Industry Volume (K Tons) Forecast, by Application 2019 & 2032
- Table 25: Italy Ballistic Composites Industry Revenue (Million) Forecast, by Application 2019 & 2032
- Table 26: Italy Ballistic Composites Industry Volume (K Tons) Forecast, by Application 2019 & 2032
- Table 27: United Kingdom Ballistic Composites Industry Revenue (Million) Forecast, by Application 2019 & 2032
- Table 28: United Kingdom Ballistic Composites Industry Volume (K Tons) Forecast, by Application 2019 & 2032
- Table 29: Netherlands Ballistic Composites Industry Revenue (Million) Forecast, by Application 2019 & 2032
- Table 30: Netherlands Ballistic Composites Industry Volume (K Tons) Forecast, by Application 2019 & 2032
- Table 31: Rest of Europe Ballistic Composites Industry Revenue (Million) Forecast, by Application 2019 & 2032
- Table 32: Rest of Europe Ballistic Composites Industry Volume (K Tons) Forecast, by Application 2019 & 2032
- Table 33: Global Ballistic Composites Industry Revenue Million Forecast, by Country 2019 & 2032
- Table 34: Global Ballistic Composites Industry Volume K Tons Forecast, by Country 2019 & 2032
- Table 35: China Ballistic Composites Industry Revenue (Million) Forecast, by Application 2019 & 2032
- Table 36: China Ballistic Composites Industry Volume (K Tons) Forecast, by Application 2019 & 2032
- Table 37: Japan Ballistic Composites Industry Revenue (Million) Forecast, by Application 2019 & 2032
- Table 38: Japan Ballistic Composites Industry Volume (K Tons) Forecast, by Application 2019 & 2032
- Table 39: India Ballistic Composites Industry Revenue (Million) Forecast, by Application 2019 & 2032
- Table 40: India Ballistic Composites Industry Volume (K Tons) Forecast, by Application 2019 & 2032
- Table 41: South Korea Ballistic Composites Industry Revenue (Million) Forecast, by Application 2019 & 2032
- Table 42: South Korea Ballistic Composites Industry Volume (K Tons) Forecast, by Application 2019 & 2032
- Table 43: Taiwan Ballistic Composites Industry Revenue (Million) Forecast, by Application 2019 & 2032
- Table 44: Taiwan Ballistic Composites Industry Volume (K Tons) Forecast, by Application 2019 & 2032
- Table 45: Australia Ballistic Composites Industry Revenue (Million) Forecast, by Application 2019 & 2032
- Table 46: Australia Ballistic Composites Industry Volume (K Tons) Forecast, by Application 2019 & 2032
- Table 47: Rest of Asia-Pacific Ballistic Composites Industry Revenue (Million) Forecast, by Application 2019 & 2032
- Table 48: Rest of Asia-Pacific Ballistic Composites Industry Volume (K Tons) Forecast, by Application 2019 & 2032
- Table 49: Global Ballistic Composites Industry Revenue Million Forecast, by Country 2019 & 2032
- Table 50: Global Ballistic Composites Industry Volume K Tons Forecast, by Country 2019 & 2032
- Table 51: Brazil Ballistic Composites Industry Revenue (Million) Forecast, by Application 2019 & 2032
- Table 52: Brazil Ballistic Composites Industry Volume (K Tons) Forecast, by Application 2019 & 2032
- Table 53: Argentina Ballistic Composites Industry Revenue (Million) Forecast, by Application 2019 & 2032
- Table 54: Argentina Ballistic Composites Industry Volume (K Tons) Forecast, by Application 2019 & 2032
- Table 55: Rest of South America Ballistic Composites Industry Revenue (Million) Forecast, by Application 2019 & 2032
- Table 56: Rest of South America Ballistic Composites Industry Volume (K Tons) Forecast, by Application 2019 & 2032
- Table 57: Global Ballistic Composites Industry Revenue Million Forecast, by Country 2019 & 2032
- Table 58: Global Ballistic Composites Industry Volume K Tons Forecast, by Country 2019 & 2032
- Table 59: Middle East Ballistic Composites Industry Revenue (Million) Forecast, by Application 2019 & 2032
- Table 60: Middle East Ballistic Composites Industry Volume (K Tons) Forecast, by Application 2019 & 2032
- Table 61: Africa Ballistic Composites Industry Revenue (Million) Forecast, by Application 2019 & 2032
- Table 62: Africa Ballistic Composites Industry Volume (K Tons) Forecast, by Application 2019 & 2032
- Table 63: Global Ballistic Composites Industry Revenue Million Forecast, by Fiber Type 2019 & 2032
- Table 64: Global Ballistic Composites Industry Volume K Tons Forecast, by Fiber Type 2019 & 2032
- Table 65: Global Ballistic Composites Industry Revenue Million Forecast, by Matrix Type 2019 & 2032
- Table 66: Global Ballistic Composites Industry Volume K Tons Forecast, by Matrix Type 2019 & 2032
- Table 67: Global Ballistic Composites Industry Revenue Million Forecast, by Application 2019 & 2032
- Table 68: Global Ballistic Composites Industry Volume K Tons Forecast, by Application 2019 & 2032
- Table 69: Global Ballistic Composites Industry Revenue Million Forecast, by Country 2019 & 2032
- Table 70: Global Ballistic Composites Industry Volume K Tons Forecast, by Country 2019 & 2032
- Table 71: China Ballistic Composites Industry Revenue (Million) Forecast, by Application 2019 & 2032
- Table 72: China Ballistic Composites Industry Volume (K Tons) Forecast, by Application 2019 & 2032
- Table 73: India Ballistic Composites Industry Revenue (Million) Forecast, by Application 2019 & 2032
- Table 74: India Ballistic Composites Industry Volume (K Tons) Forecast, by Application 2019 & 2032
- Table 75: Japan Ballistic Composites Industry Revenue (Million) Forecast, by Application 2019 & 2032
- Table 76: Japan Ballistic Composites Industry Volume (K Tons) Forecast, by Application 2019 & 2032
- Table 77: South Korea Ballistic Composites Industry Revenue (Million) Forecast, by Application 2019 & 2032
- Table 78: South Korea Ballistic Composites Industry Volume (K Tons) Forecast, by Application 2019 & 2032
- Table 79: Rest of Asia Pacific Ballistic Composites Industry Revenue (Million) Forecast, by Application 2019 & 2032
- Table 80: Rest of Asia Pacific Ballistic Composites Industry Volume (K Tons) Forecast, by Application 2019 & 2032
- Table 81: Global Ballistic Composites Industry Revenue Million Forecast, by Fiber Type 2019 & 2032
- Table 82: Global Ballistic Composites Industry Volume K Tons Forecast, by Fiber Type 2019 & 2032
- Table 83: Global Ballistic Composites Industry Revenue Million Forecast, by Matrix Type 2019 & 2032
- Table 84: Global Ballistic Composites Industry Volume K Tons Forecast, by Matrix Type 2019 & 2032
- Table 85: Global Ballistic Composites Industry Revenue Million Forecast, by Application 2019 & 2032
- Table 86: Global Ballistic Composites Industry Volume K Tons Forecast, by Application 2019 & 2032
- Table 87: Global Ballistic Composites Industry Revenue Million Forecast, by Country 2019 & 2032
- Table 88: Global Ballistic Composites Industry Volume K Tons Forecast, by Country 2019 & 2032
- Table 89: United States Ballistic Composites Industry Revenue (Million) Forecast, by Application 2019 & 2032
- Table 90: United States Ballistic Composites Industry Volume (K Tons) Forecast, by Application 2019 & 2032
- Table 91: Canada Ballistic Composites Industry Revenue (Million) Forecast, by Application 2019 & 2032
- Table 92: Canada Ballistic Composites Industry Volume (K Tons) Forecast, by Application 2019 & 2032
- Table 93: Mexico Ballistic Composites Industry Revenue (Million) Forecast, by Application 2019 & 2032
- Table 94: Mexico Ballistic Composites Industry Volume (K Tons) Forecast, by Application 2019 & 2032
- Table 95: Global Ballistic Composites Industry Revenue Million Forecast, by Fiber Type 2019 & 2032
- Table 96: Global Ballistic Composites Industry Volume K Tons Forecast, by Fiber Type 2019 & 2032
- Table 97: Global Ballistic Composites Industry Revenue Million Forecast, by Matrix Type 2019 & 2032
- Table 98: Global Ballistic Composites Industry Volume K Tons Forecast, by Matrix Type 2019 & 2032
- Table 99: Global Ballistic Composites Industry Revenue Million Forecast, by Application 2019 & 2032
- Table 100: Global Ballistic Composites Industry Volume K Tons Forecast, by Application 2019 & 2032
- Table 101: Global Ballistic Composites Industry Revenue Million Forecast, by Country 2019 & 2032
- Table 102: Global Ballistic Composites Industry Volume K Tons Forecast, by Country 2019 & 2032
- Table 103: Germany Ballistic Composites Industry Revenue (Million) Forecast, by Application 2019 & 2032
- Table 104: Germany Ballistic Composites Industry Volume (K Tons) Forecast, by Application 2019 & 2032
- Table 105: United Kingdom Ballistic Composites Industry Revenue (Million) Forecast, by Application 2019 & 2032
- Table 106: United Kingdom Ballistic Composites Industry Volume (K Tons) Forecast, by Application 2019 & 2032
- Table 107: Italy Ballistic Composites Industry Revenue (Million) Forecast, by Application 2019 & 2032
- Table 108: Italy Ballistic Composites Industry Volume (K Tons) Forecast, by Application 2019 & 2032
- Table 109: France Ballistic Composites Industry Revenue (Million) Forecast, by Application 2019 & 2032
- Table 110: France Ballistic Composites Industry Volume (K Tons) Forecast, by Application 2019 & 2032
- Table 111: Spain Ballistic Composites Industry Revenue (Million) Forecast, by Application 2019 & 2032
- Table 112: Spain Ballistic Composites Industry Volume (K Tons) Forecast, by Application 2019 & 2032
- Table 113: Rest of Europe Ballistic Composites Industry Revenue (Million) Forecast, by Application 2019 & 2032
- Table 114: Rest of Europe Ballistic Composites Industry Volume (K Tons) Forecast, by Application 2019 & 2032
- Table 115: Global Ballistic Composites Industry Revenue Million Forecast, by Fiber Type 2019 & 2032
- Table 116: Global Ballistic Composites Industry Volume K Tons Forecast, by Fiber Type 2019 & 2032
- Table 117: Global Ballistic Composites Industry Revenue Million Forecast, by Matrix Type 2019 & 2032
- Table 118: Global Ballistic Composites Industry Volume K Tons Forecast, by Matrix Type 2019 & 2032
- Table 119: Global Ballistic Composites Industry Revenue Million Forecast, by Application 2019 & 2032
- Table 120: Global Ballistic Composites Industry Volume K Tons Forecast, by Application 2019 & 2032
- Table 121: Global Ballistic Composites Industry Revenue Million Forecast, by Country 2019 & 2032
- Table 122: Global Ballistic Composites Industry Volume K Tons Forecast, by Country 2019 & 2032
- Table 123: Brazil Ballistic Composites Industry Revenue (Million) Forecast, by Application 2019 & 2032
- Table 124: Brazil Ballistic Composites Industry Volume (K Tons) Forecast, by Application 2019 & 2032
- Table 125: Argentina Ballistic Composites Industry Revenue (Million) Forecast, by Application 2019 & 2032
- Table 126: Argentina Ballistic Composites Industry Volume (K Tons) Forecast, by Application 2019 & 2032
- Table 127: Rest of South America Ballistic Composites Industry Revenue (Million) Forecast, by Application 2019 & 2032
- Table 128: Rest of South America Ballistic Composites Industry Volume (K Tons) Forecast, by Application 2019 & 2032
- Table 129: Global Ballistic Composites Industry Revenue Million Forecast, by Fiber Type 2019 & 2032
- Table 130: Global Ballistic Composites Industry Volume K Tons Forecast, by Fiber Type 2019 & 2032
- Table 131: Global Ballistic Composites Industry Revenue Million Forecast, by Matrix Type 2019 & 2032
- Table 132: Global Ballistic Composites Industry Volume K Tons Forecast, by Matrix Type 2019 & 2032
- Table 133: Global Ballistic Composites Industry Revenue Million Forecast, by Application 2019 & 2032
- Table 134: Global Ballistic Composites Industry Volume K Tons Forecast, by Application 2019 & 2032
- Table 135: Global Ballistic Composites Industry Revenue Million Forecast, by Country 2019 & 2032
- Table 136: Global Ballistic Composites Industry Volume K Tons Forecast, by Country 2019 & 2032
- Table 137: Saudi Arabia Ballistic Composites Industry Revenue (Million) Forecast, by Application 2019 & 2032
- Table 138: Saudi Arabia Ballistic Composites Industry Volume (K Tons) Forecast, by Application 2019 & 2032
- Table 139: South Africa Ballistic Composites Industry Revenue (Million) Forecast, by Application 2019 & 2032
- Table 140: South Africa Ballistic Composites Industry Volume (K Tons) Forecast, by Application 2019 & 2032
- Table 141: Rest of Middle East and Africa Ballistic Composites Industry Revenue (Million) Forecast, by Application 2019 & 2032
- Table 142: Rest of Middle East and Africa Ballistic Composites Industry Volume (K Tons) Forecast, by Application 2019 & 2032
Frequently Asked Questions
1. What is the projected Compound Annual Growth Rate (CAGR) of the Ballistic Composites Industry?
The projected CAGR is approximately > 4.00%.
2. Which companies are prominent players in the Ballistic Composites Industry?
Key companies in the market include Honeywell International Inc, Teijin Limited, Plastic Reinforcement Fabrics Ltd, BAE Systems, Southern States llc, Roihu Inc, Barrday Inc, TenCate Protective Fabrics, MKU LIMITED, Coherent Corp, Integris, Morgan Advanced Materials, DSM, DuPont, Gaffco Ballistics, Gurit Holding AG, ArmorCore.
3. What are the main segments of the Ballistic Composites Industry?
The market segments include Fiber Type, Matrix Type, Application.
4. Can you provide details about the market size?
The market size is estimated to be USD 1.91 Million as of 2022.
5. What are some drivers contributing to market growth?
Rise in Defense Expenditure; Increasing Demand for Lightweight Materials in the Aerospace and Defense Industry; Other Drivers.
6. What are the notable trends driving market growth?
Increasing Demand for Vehicle Armors.
7. Are there any restraints impacting market growth?
High Processing and Manufacturing Costs; Volatile Raw Material Supply.
8. Can you provide examples of recent developments in the market?
November 2023: Integris Composites developed a new system of ballistic vest gear for law enforcement and military units and launched the company’s new Rapid Don/Doff body armor vests. It is an equipment that dramatically reduces the time for donning and doffing one’s body armor rig—by 50% or more.
9. What pricing options are available for accessing the report?
Pricing options include single-user, multi-user, and enterprise licenses priced at USD 4750, USD 5250, and USD 8750 respectively.
10. Is the market size provided in terms of value or volume?
The market size is provided in terms of value, measured in Million and volume, measured in K Tons.
11. Are there any specific market keywords associated with the report?
Yes, the market keyword associated with the report is "Ballistic Composites Industry," which aids in identifying and referencing the specific market segment covered.
12. How do I determine which pricing option suits my needs best?
The pricing options vary based on user requirements and access needs. Individual users may opt for single-user licenses, while businesses requiring broader access may choose multi-user or enterprise licenses for cost-effective access to the report.
13. Are there any additional resources or data provided in the Ballistic Composites Industry report?
While the report offers comprehensive insights, it's advisable to review the specific contents or supplementary materials provided to ascertain if additional resources or data are available.
14. How can I stay updated on further developments or reports in the Ballistic Composites Industry?
To stay informed about further developments, trends, and reports in the Ballistic Composites Industry, consider subscribing to industry newsletters, following relevant companies and organizations, or regularly checking reputable industry news sources and publications.
Methodology
Step 1 - Identification of Relevant Samples Size from Population Database


Step 2 - Approaches for Defining Global Market Size (Value, Volume* & Price*)

Note*: In applicable scenarios
Step 3 - Data Sources
Primary Research
- Web Analytics
- Survey Reports
- Research Institute
- Latest Research Reports
- Opinion Leaders
Secondary Research
- Annual Reports
- White Paper
- Latest Press Release
- Industry Association
- Paid Database
- Investor Presentations

Step 4 - Data Triangulation
Involves using different sources of information in order to increase the validity of a study
These sources are likely to be stakeholders in a program - participants, other researchers, program staff, other community members, and so on.
Then we put all data in single framework & apply various statistical tools to find out the dynamic on the market.
During the analysis stage, feedback from the stakeholder groups would be compared to determine areas of agreement as well as areas of divergence


