

Key Insights
The Asia Pacific Industrial Computed Tomography (ICT) market is poised for significant expansion, driven by the widespread adoption of advanced imaging solutions across key industrial sectors. The burgeoning manufacturing base, especially in electronics, automotive, and aerospace, is a primary growth catalyst. A projected Compound Annual Growth Rate (CAGR) of 19.04% indicates substantial market evolution through 2033. Increasing demand for rigorous quality control and non-destructive testing (NDT) methods is propelling ICT adoption for precise flaw detection, failure analysis, and assembly verification. Innovations delivering higher resolution, faster scan times, and enhanced software capabilities are further augmenting the value and appeal of ICT systems. The increasing complexity of manufactured components and stringent quality mandates underscore the necessity for accurate and efficient inspection tools like ICT. Key markets within the region include China, Japan, India, and South Korea, benefiting from robust industrial expansion and supportive governmental initiatives for technological advancement. While the initial investment cost and the requirement for specialized operational expertise may present challenges, the overall market trajectory remains strongly positive, propelled by these key drivers. Segmentation by application and end-user industry reveals the diverse utility and growth potential of ICT.
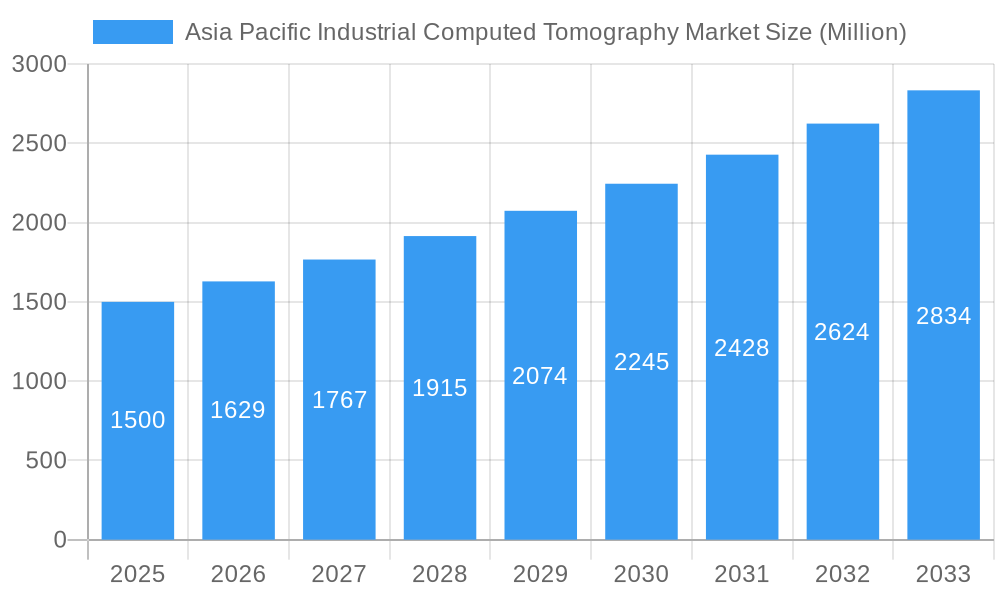
Asia Pacific Industrial Computed Tomography Market Market Size (In Million)
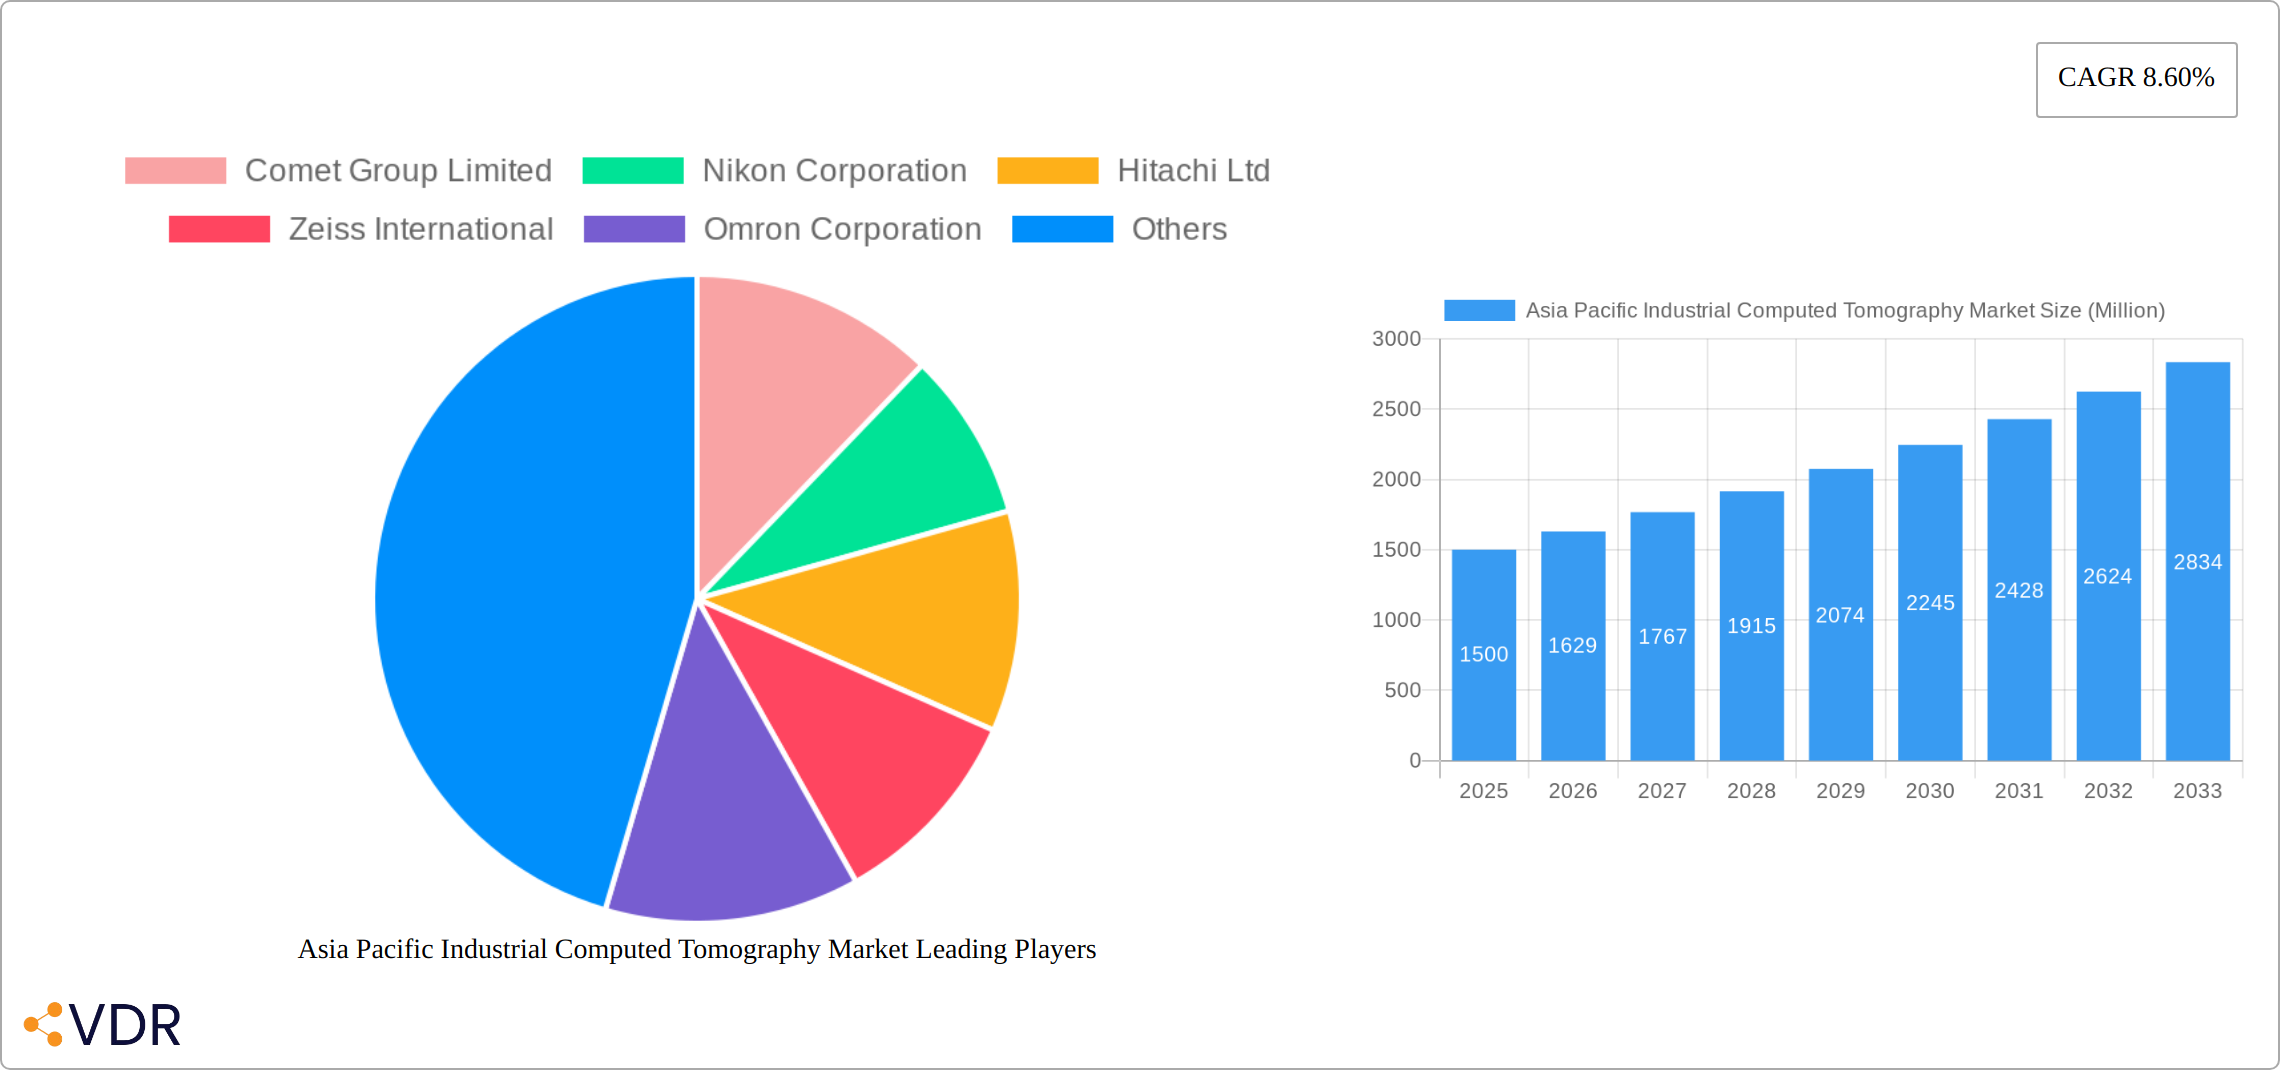
The competitive arena features established leaders such as Comet Group, Nikon, Hitachi, and Zeiss, who are actively engaged in innovation to address evolving market demands. Strategic collaborations, mergers, and product advancements are central to their market positioning. The forecast period from 2025 to 2033 anticipates sustained growth, potentially surpassing historical trends, as technological integration and adoption rates accelerate. This expansion will be further stimulated by the increasing digitalization of industrial operations and a heightened emphasis on predictive maintenance strategies, for which ICT systems provide critical insights. Country-specific growth forecasts within the Asia Pacific region will be influenced by prevailing economic conditions, government policies, and sector-specific dynamics. The current market size stands at 536 million.
Asia Pacific Industrial Computed Tomography Market Company Market Share
Asia Pacific Industrial Computed Tomography Market: A Comprehensive Report (2019-2033)
This in-depth report provides a comprehensive analysis of the Asia Pacific Industrial Computed Tomography (CT) market, encompassing market dynamics, growth trends, regional dominance, product landscape, key players, and future outlook. The report covers the period from 2019 to 2033, with 2025 serving as the base and estimated year. The market is segmented by application (Flaw Detection and Inspection, Failure Analysis, Assembly Analysis, Other Applications) and end-user industry (Aerospace, Automotive, Electronics, Oil and Gas, Other End-User Industries). The total market size is projected to reach xx Million units by 2033.
Asia Pacific Industrial Computed Tomography Market Dynamics & Structure
The Asia Pacific industrial computed tomography market is characterized by a moderately concentrated landscape, with key players such as Comet Group Limited, Nikon Corporation, Hitachi Ltd, Zeiss International, Omron Corporation, Thermo Fischer Scientific Inc, Shimadzu Corporation, Waygate Technologies (Baker Hughes Digital Solutions GmbH), and Bruker Corporation holding significant market share. Market concentration is estimated at xx% in 2025, driven by the presence of established players and high barriers to entry, including substantial R&D investment and specialized expertise.
- Technological Innovation: Continuous advancements in X-ray source technology, detector arrays, and image reconstruction algorithms are driving market growth. The development of faster, higher-resolution systems is a key innovation driver.
- Regulatory Framework: Stringent quality control standards across various end-user industries, particularly aerospace and automotive, fuel demand for high-precision industrial CT systems.
- Competitive Product Substitutes: While other non-destructive testing (NDT) methods exist (e.g., ultrasonic testing, radiography), industrial CT offers superior 3D visualization and detailed internal analysis, limiting substitution.
- End-User Demographics: The market is primarily driven by the expanding manufacturing sectors in countries like China, Japan, South Korea, and India. Growing investments in automation and quality control further contribute to market growth.
- M&A Trends: The past five years have witnessed xx M&A deals in the Asia Pacific industrial CT market, primarily focused on enhancing technological capabilities and expanding market reach. The average deal value was approximately xx Million units.
Asia Pacific Industrial Computed Tomography Market Growth Trends & Insights
The Asia Pacific industrial CT market experienced significant growth during the historical period (2019-2024), with a CAGR of xx%. This growth is primarily attributed to increasing adoption across various end-user industries driven by rising demand for quality control, product innovation, and enhanced manufacturing efficiency. The market is expected to maintain a healthy growth trajectory during the forecast period (2025-2033), with a projected CAGR of xx%, reaching xx Million units by 2033. Market penetration is currently at xx% and is projected to increase to xx% by 2033, primarily fueled by the adoption of advanced technologies and the expanding manufacturing base across the region. Technological disruptions, such as the introduction of miniaturized and faster systems, are further accelerating market growth. Consumer behavior shifts towards higher quality and precision in manufacturing are also significantly impacting market dynamics.
Dominant Regions, Countries, or Segments in Asia Pacific Industrial Computed Tomography Market
China commands the largest market share within the Asia Pacific industrial computed tomography (CT) market, fueled by its robust manufacturing sector and substantial investments in advanced technologies. Japan and South Korea follow closely, leveraging their strong technological foundations and well-established industrial infrastructures. The market's expansion is further driven by the increasing adoption of Industry 4.0 principles and the growing need for enhanced quality control and process optimization across diverse industries.
Market Segmentation Analysis:
By Application:
- Flaw Detection and Inspection: This remains the dominant application, accounting for a significant portion of the total revenue, driven by stringent quality control demands across various sectors, including aerospace, automotive, and electronics. Advanced algorithms and improved image processing capabilities are further enhancing the accuracy and efficiency of flaw detection.
- Failure Analysis: This segment exhibits substantial growth potential, fueled by the critical need to understand and prevent product failures, ultimately leading to improved product design and enhanced reliability. Industrial CT provides detailed, non-destructive insights into component failures.
- Assembly Analysis: This rapidly expanding segment benefits from the increasing complexity of modern assemblies. Industrial CT enables precise inspection and verification of component placement, ensuring optimal functionality and preventing assembly-related defects.
- Reverse Engineering: The ability to create 3D models from scanned components is driving growth in this segment, particularly in industries needing to replicate or improve existing parts.
- Material Characterization: The use of industrial CT for measuring material properties such as porosity and density is a growing application, especially for quality assurance in advanced materials.
By End-User Industry:
- Electronics: The electronics industry remains a key driver, owing to the ever-increasing miniaturization and complexity of electronic components, demanding precise and non-destructive inspection methods.
- Automotive: The automotive industry's stringent quality and safety regulations, coupled with the demand for lightweighting and enhanced performance, contribute significantly to market growth. Industrial CT plays a crucial role in inspecting complex components such as engine blocks and castings.
- Aerospace: The aerospace industry requires high levels of quality and safety, making industrial CT an essential tool for inspecting critical components for defects and ensuring structural integrity.
- Medical Devices: The increasing demand for high-quality and reliable medical devices is driving adoption of industrial CT for quality control and verification of implants and other components.
Asia Pacific Industrial Computed Tomography Market Product Landscape
The Asia Pacific industrial CT market offers a diverse range of systems, from bench-top models like the Shimadzu XSeeker 8000, known for its compact size and high-resolution imaging, to larger, high-throughput systems for demanding applications. Key product features include advanced image processing software, automated workflows, and integration capabilities with other manufacturing systems. Recent innovations focus on increasing speed, resolution, and ease of use, making industrial CT more accessible and efficient.
Key Drivers, Barriers & Challenges in Asia Pacific Industrial Computed Tomography Market
Key Drivers: The rising demand for stringent quality control and enhanced product safety across diverse industries is a primary driver. Technological advancements, such as improved image resolution, faster scan times, and sophisticated software, are further boosting market growth. Government initiatives promoting industrial automation and technological innovation are also playing a significant role. Increased adoption of additive manufacturing also fuels demand for part inspection.
Challenges: High initial investment costs for industrial CT systems remain a barrier for smaller companies. The requirement for specialized technical expertise for operation and maintenance poses another challenge. Competition from other non-destructive testing (NDT) methods, such as ultrasound and X-ray radiography, also needs to be considered. Potential supply chain disruptions for essential components represent an ongoing risk.
Emerging Opportunities in Asia Pacific Industrial Computed Tomography Market
Untapped potential exists in emerging economies like Vietnam and Indonesia; the adoption of industrial CT in new applications, such as additive manufacturing quality control; growing demand for 4D and multi-modal imaging techniques.
Growth Accelerators in the Asia Pacific Industrial Computed Tomography Market Industry
Strategic partnerships between CT manufacturers and industrial automation solution providers; continuous R&D investments focused on improving system performance and functionalities; expansion into new geographical markets, particularly in Southeast Asia.
Key Players Shaping the Asia Pacific Industrial Computed Tomography Market Market
- Comet Group Limited
- Nikon Corporation
- Hitachi Ltd
- Zeiss International
- Omron Corporation
- Thermo Fischer Scientific Inc
- Shimadzu Corporation
- Waygate Technologies (Baker Hughes Digital Solutions GmbH)
- Bruker Corporation
- Shimadzu Corporation
Notable Milestones in Asia Pacific Industrial Computed Tomography Market Sector
- May 2022: Shimadzu Corporation launched the XSeeker 8000 bench-top X-ray CT system, a compact and lightweight system offering high-resolution imaging, expanding accessibility for smaller businesses.
- November 2021: Omron Corporation announced the VT-X750-V3, touted as one of the fastest CT-type X-ray inspection devices, enabling high-speed inspection of electronic components and increasing throughput for manufacturers.
- [Add other relevant milestones with dates and brief descriptions. Include mergers, acquisitions, significant product launches, or partnerships]
In-Depth Asia Pacific Industrial Computed Tomography Market Market Outlook
The Asia Pacific industrial CT market is poised for significant growth driven by technological advancements, rising demand across diverse industries, and supportive government policies. Strategic investments in R&D, expansion into new markets, and strategic partnerships are key factors shaping future market potential and offering attractive opportunities for players in the industry.
Asia Pacific Industrial Computed Tomography Market Segmentation
-
1. Application
- 1.1. Flaw Detection and Inspection
- 1.2. Failure Analysis
- 1.3. Assembly Analysis
- 1.4. Other Applications
-
2. End-User Industry
- 2.1. Aerospace
- 2.2. Automotive
- 2.3. Electronics
- 2.4. Oil and Gas
- 2.5. Other End-User Industries
Asia Pacific Industrial Computed Tomography Market Segmentation By Geography
-
1. Asia Pacific
- 1.1. China
- 1.2. Japan
- 1.3. South Korea
- 1.4. India
- 1.5. Australia
- 1.6. New Zealand
- 1.7. Indonesia
- 1.8. Malaysia
- 1.9. Singapore
- 1.10. Thailand
- 1.11. Vietnam
- 1.12. Philippines
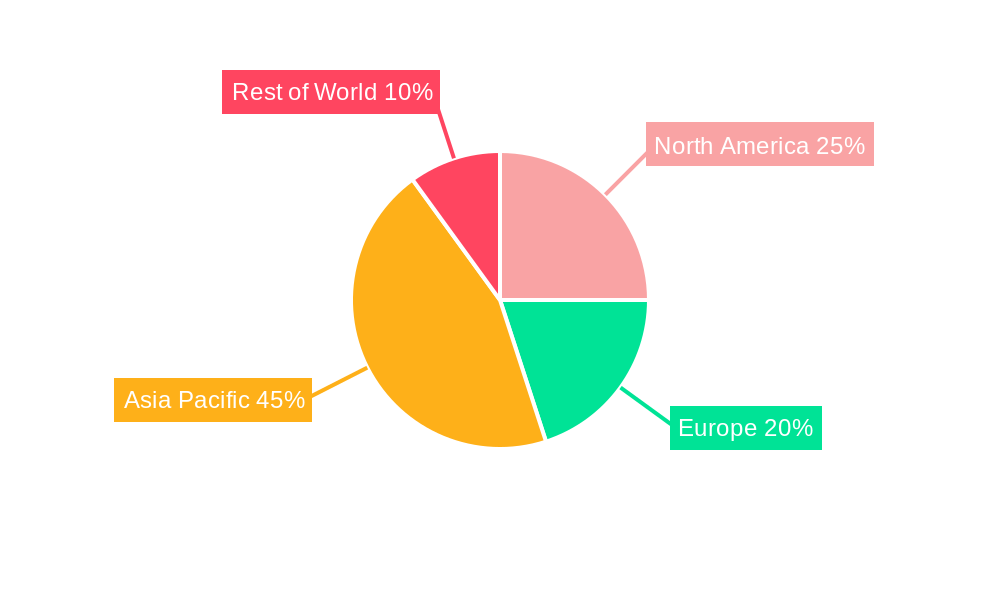
Asia Pacific Industrial Computed Tomography Market Regional Market Share
Geographic Coverage of Asia Pacific Industrial Computed Tomography Market
Asia Pacific Industrial Computed Tomography Market REPORT HIGHLIGHTS
| Aspects | Details |
|---|---|
| Study Period | 2020-2034 |
| Base Year | 2025 |
| Estimated Year | 2026 |
| Forecast Period | 2026-2034 |
| Historical Period | 2020-2025 |
| Growth Rate | CAGR of 19.04% from 2020-2034 |
| Segmentation |
|
Table of Contents
- 1. Introduction
- 1.1. Research Scope
- 1.2. Market Segmentation
- 1.3. Research Objective
- 1.4. Definitions and Assumptions
- 2. Executive Summary
- 2.1. Market Snapshot
- 3. Market Dynamics
- 3.1. Market Drivers
- 3.2. Market Restrains
- 3.3. Market Trends
- 3.4. Market Opportunities
- 4. Market Factor Analysis
- 4.1. Porters Five Forces
- 4.1.1. Bargaining Power of Suppliers
- 4.1.2. Bargaining Power of Buyers
- 4.1.3. Threat of New Entrants
- 4.1.4. Threat of Substitutes
- 4.1.5. Competitive Rivalry
- 4.2. PESTEL analysis
- 4.3. BCG Analysis
- 4.3.1. Stars (High Growth, High Market Share)
- 4.3.2. Cash Cows (Low Growth, High Market Share)
- 4.3.3. Question Mark (High Growth, Low Market Share)
- 4.3.4. Dogs (Low Growth, Low Market Share)
- 4.4. Ansoff Matrix Analysis
- 4.5. Supply Chain Analysis
- 4.6. Regulatory Landscape
- 4.7. Current Market Potential and Opportunity Assessment (TAM–SAM–SOM Framework)
- 4.8. VDR Analyst Note
- 4.1. Porters Five Forces
- 5. Market Analysis, Insights and Forecast 2021-2033
- 5.1. Market Analysis, Insights and Forecast - by Application
- 5.1.1. Flaw Detection and Inspection
- 5.1.2. Failure Analysis
- 5.1.3. Assembly Analysis
- 5.1.4. Other Applications
- 5.2. Market Analysis, Insights and Forecast - by End-User Industry
- 5.2.1. Aerospace
- 5.2.2. Automotive
- 5.2.3. Electronics
- 5.2.4. Oil and Gas
- 5.2.5. Other End-User Industries
- 5.3. Market Analysis, Insights and Forecast - by Region
- 5.3.1. Asia Pacific
- 5.1. Market Analysis, Insights and Forecast - by Application
- 6. Asia Pacific Industrial Computed Tomography Market Analysis, Insights and Forecast, 2021-2033
- 6.1. Market Analysis, Insights and Forecast - by Application
- 6.1.1. Flaw Detection and Inspection
- 6.1.2. Failure Analysis
- 6.1.3. Assembly Analysis
- 6.1.4. Other Applications
- 6.2. Market Analysis, Insights and Forecast - by End-User Industry
- 6.2.1. Aerospace
- 6.2.2. Automotive
- 6.2.3. Electronics
- 6.2.4. Oil and Gas
- 6.2.5. Other End-User Industries
- 6.1. Market Analysis, Insights and Forecast - by Application
- 7. Competitive Analysis
- 7.1. Company Profiles
- 7.1.1 Comet Group Limited
- 7.1.1.1. Company Overview
- 7.1.1.2. Products
- 7.1.1.3. Company Financials
- 7.1.1.4. SWOT Analysis
- 7.1.2 Nikon Corporation
- 7.1.2.1. Company Overview
- 7.1.2.2. Products
- 7.1.2.3. Company Financials
- 7.1.2.4. SWOT Analysis
- 7.1.3 Hitachi Ltd
- 7.1.3.1. Company Overview
- 7.1.3.2. Products
- 7.1.3.3. Company Financials
- 7.1.3.4. SWOT Analysis
- 7.1.4 Zeiss International
- 7.1.4.1. Company Overview
- 7.1.4.2. Products
- 7.1.4.3. Company Financials
- 7.1.4.4. SWOT Analysis
- 7.1.5 Omron Corporation
- 7.1.5.1. Company Overview
- 7.1.5.2. Products
- 7.1.5.3. Company Financials
- 7.1.5.4. SWOT Analysis
- 7.1.6 Thermo Fischer Scientific Inc
- 7.1.6.1. Company Overview
- 7.1.6.2. Products
- 7.1.6.3. Company Financials
- 7.1.6.4. SWOT Analysis
- 7.1.7 Shimadzu Corporation
- 7.1.7.1. Company Overview
- 7.1.7.2. Products
- 7.1.7.3. Company Financials
- 7.1.7.4. SWOT Analysis
- 7.1.8 Waygate Technologies (Baker Hughes Digital Solutions GmbH)
- 7.1.8.1. Company Overview
- 7.1.8.2. Products
- 7.1.8.3. Company Financials
- 7.1.8.4. SWOT Analysis
- 7.1.9 Bruker Corporation
- 7.1.9.1. Company Overview
- 7.1.9.2. Products
- 7.1.9.3. Company Financials
- 7.1.9.4. SWOT Analysis
- 7.1.10 Shimadzu Corporation
- 7.1.10.1. Company Overview
- 7.1.10.2. Products
- 7.1.10.3. Company Financials
- 7.1.10.4. SWOT Analysis
- 7.1.1 Comet Group Limited
- 7.2. Market Entropy
- 7.2.1 Company's Key Areas Served
- 7.2.2 Recent Developments
- 7.3. Company Market Share Analysis 2025
- 7.3.1 Top 5 Companies Market Share Analysis
- 7.3.2 Top 3 Companies Market Share Analysis
- 7.4. List of Potential Customers
- 8. Research Methodology
List of Figures
- Figure 1: Asia Pacific Industrial Computed Tomography Market Revenue Breakdown (million, %) by Product 2025 & 2033
- Figure 2: Asia Pacific Industrial Computed Tomography Market Share (%) by Company 2025
List of Tables
- Table 1: Asia Pacific Industrial Computed Tomography Market Revenue million Forecast, by Application 2020 & 2033
- Table 2: Asia Pacific Industrial Computed Tomography Market Revenue million Forecast, by End-User Industry 2020 & 2033
- Table 3: Asia Pacific Industrial Computed Tomography Market Revenue million Forecast, by Region 2020 & 2033
- Table 4: Asia Pacific Industrial Computed Tomography Market Revenue million Forecast, by Application 2020 & 2033
- Table 5: Asia Pacific Industrial Computed Tomography Market Revenue million Forecast, by End-User Industry 2020 & 2033
- Table 6: Asia Pacific Industrial Computed Tomography Market Revenue million Forecast, by Country 2020 & 2033
- Table 7: China Asia Pacific Industrial Computed Tomography Market Revenue (million) Forecast, by Application 2020 & 2033
- Table 8: Japan Asia Pacific Industrial Computed Tomography Market Revenue (million) Forecast, by Application 2020 & 2033
- Table 9: South Korea Asia Pacific Industrial Computed Tomography Market Revenue (million) Forecast, by Application 2020 & 2033
- Table 10: India Asia Pacific Industrial Computed Tomography Market Revenue (million) Forecast, by Application 2020 & 2033
- Table 11: Australia Asia Pacific Industrial Computed Tomography Market Revenue (million) Forecast, by Application 2020 & 2033
- Table 12: New Zealand Asia Pacific Industrial Computed Tomography Market Revenue (million) Forecast, by Application 2020 & 2033
- Table 13: Indonesia Asia Pacific Industrial Computed Tomography Market Revenue (million) Forecast, by Application 2020 & 2033
- Table 14: Malaysia Asia Pacific Industrial Computed Tomography Market Revenue (million) Forecast, by Application 2020 & 2033
- Table 15: Singapore Asia Pacific Industrial Computed Tomography Market Revenue (million) Forecast, by Application 2020 & 2033
- Table 16: Thailand Asia Pacific Industrial Computed Tomography Market Revenue (million) Forecast, by Application 2020 & 2033
- Table 17: Vietnam Asia Pacific Industrial Computed Tomography Market Revenue (million) Forecast, by Application 2020 & 2033
- Table 18: Philippines Asia Pacific Industrial Computed Tomography Market Revenue (million) Forecast, by Application 2020 & 2033
Frequently Asked Questions
1. What is the projected Compound Annual Growth Rate (CAGR) of the Asia Pacific Industrial Computed Tomography Market?
The projected CAGR is approximately 19.04%.
2. Which companies are prominent players in the Asia Pacific Industrial Computed Tomography Market?
Key companies in the market include Comet Group Limited, Nikon Corporation, Hitachi Ltd, Zeiss International, Omron Corporation, Thermo Fischer Scientific Inc, Shimadzu Corporation, Waygate Technologies (Baker Hughes Digital Solutions GmbH), Bruker Corporation, Shimadzu Corporation.
3. What are the main segments of the Asia Pacific Industrial Computed Tomography Market?
The market segments include Application, End-User Industry.
4. Can you provide details about the market size?
The market size is estimated to be USD 536 million as of 2022.
5. What are some drivers contributing to market growth?
Rising Demand for Portable Radiography Equipment; Technology Advancements in Resolution and Image Processing.
6. What are the notable trends driving market growth?
Automotive to Gain Significant Growth in the Region.
7. Are there any restraints impacting market growth?
High Installation Cost and Longer ROI Period; Longer Replacement Cycle of Water Meters.
8. Can you provide examples of recent developments in the market?
May 2022 - Shimadzu Corporation announced the release of the XSeeker 8000 bench-top X-ray CT system. It is considered to be the smallest and lightest X-ray system. It offers clear images of a variety of samples, from resin molded parts to aluminum die cast and other metallic elements.
9. What pricing options are available for accessing the report?
Pricing options include single-user, multi-user, and enterprise licenses priced at USD 4750, USD 5250, and USD 8750 respectively.
10. Is the market size provided in terms of value or volume?
The market size is provided in terms of value, measured in million.
11. Are there any specific market keywords associated with the report?
Yes, the market keyword associated with the report is "Asia Pacific Industrial Computed Tomography Market," which aids in identifying and referencing the specific market segment covered.
12. How do I determine which pricing option suits my needs best?
The pricing options vary based on user requirements and access needs. Individual users may opt for single-user licenses, while businesses requiring broader access may choose multi-user or enterprise licenses for cost-effective access to the report.
13. Are there any additional resources or data provided in the Asia Pacific Industrial Computed Tomography Market report?
While the report offers comprehensive insights, it's advisable to review the specific contents or supplementary materials provided to ascertain if additional resources or data are available.
14. How can I stay updated on further developments or reports in the Asia Pacific Industrial Computed Tomography Market?
To stay informed about further developments, trends, and reports in the Asia Pacific Industrial Computed Tomography Market, consider subscribing to industry newsletters, following relevant companies and organizations, or regularly checking reputable industry news sources and publications.
Methodology
Step 1 - Identification of Relevant Samples Size from Population Database


Step 2 - Approaches for Defining Global Market Size (Value, Volume* & Price*)

Note*: In applicable scenarios
Step 3 - Data Sources
Primary Research
- Web Analytics
- Survey Reports
- Research Institute
- Latest Research Reports
- Opinion Leaders
Secondary Research
- Annual Reports
- White Paper
- Latest Press Release
- Industry Association
- Paid Database
- Investor Presentations

Step 4 - Data Triangulation
Involves using different sources of information in order to increase the validity of a study
These sources are likely to be stakeholders in a program - participants, other researchers, program staff, other community members, and so on.
Then we put all data in single framework & apply various statistical tools to find out the dynamic on the market.
During the analysis stage, feedback from the stakeholder groups would be compared to determine areas of agreement as well as areas of divergence