
Key Insights
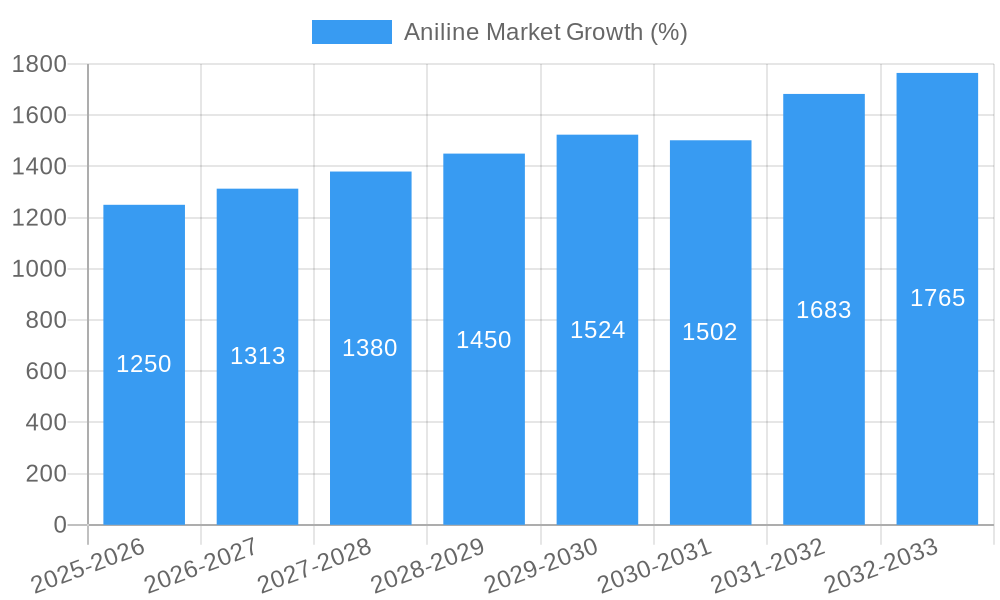
The global aniline market is experiencing robust growth, driven by increasing demand from key end-use industries such as the automotive, packaging, and building and construction sectors. A compound annual growth rate (CAGR) exceeding 5% indicates a significant expansion projected from 2025 to 2033. This growth is fueled by several factors including the rising global population, urbanization, and the consequent surge in infrastructure development. The automotive industry's reliance on aniline-derived products for tire manufacturing and other components also contributes significantly. Furthermore, the increasing demand for high-performance materials in various applications, including specialized fibers and agricultural chemicals, is expected to boost market expansion. Technological advancements aimed at improving production efficiency and reducing environmental impact are further bolstering market growth.
However, the market faces challenges such as price volatility in raw materials and stringent environmental regulations. Fluctuations in crude oil prices directly impact aniline production costs, creating uncertainty for manufacturers. Stringent regulations related to emissions and waste disposal also require substantial investments in advanced technologies, adding to the overall cost. Despite these hurdles, the continued expansion of key end-use sectors and the development of innovative applications will likely outweigh these challenges, resulting in sustained market growth over the forecast period. Regional disparities are expected, with Asia Pacific, particularly China and India, expected to lead market expansion due to rapid industrialization and infrastructural development. Established players like BASF, Huntsman, and Wanhua Chemical are anticipated to maintain a strong market presence while facing competition from emerging regional players.
Aniline Market Report: A Comprehensive Analysis (2019-2033)
This comprehensive report provides a deep dive into the Aniline Market, encompassing market dynamics, growth trends, regional analysis, product landscape, and competitive overview. The study period covers 2019-2033, with a base year of 2025 and a forecast period of 2025-2033. This report is crucial for industry professionals, investors, and strategic decision-makers seeking to understand the current state and future trajectory of this vital chemical market. Parent markets include the broader chemical industry and specific downstream sectors like polyurethane and rubber. Child markets include various applications of aniline derivatives, as detailed below. The total market size is projected to reach xx Million by 2033.
Aniline Market Dynamics & Structure
The Aniline market exhibits a moderately concentrated structure, with key players like BASF SE, Huntsman International LLC, and Covestro AG holding significant market share. Market concentration is expected to shift slightly with new entrants and expansion plans. Technological innovation, particularly in improving production efficiency and reducing environmental impact, is a key driver. Stringent regulatory frameworks concerning emissions and waste disposal pose challenges but also incentivize environmentally friendly production methods. The market faces competition from alternative materials in specific applications, but aniline's versatility and cost-effectiveness maintain its strong position. M&A activity in the sector is moderate, primarily focused on consolidating production capacity and expanding geographical reach.
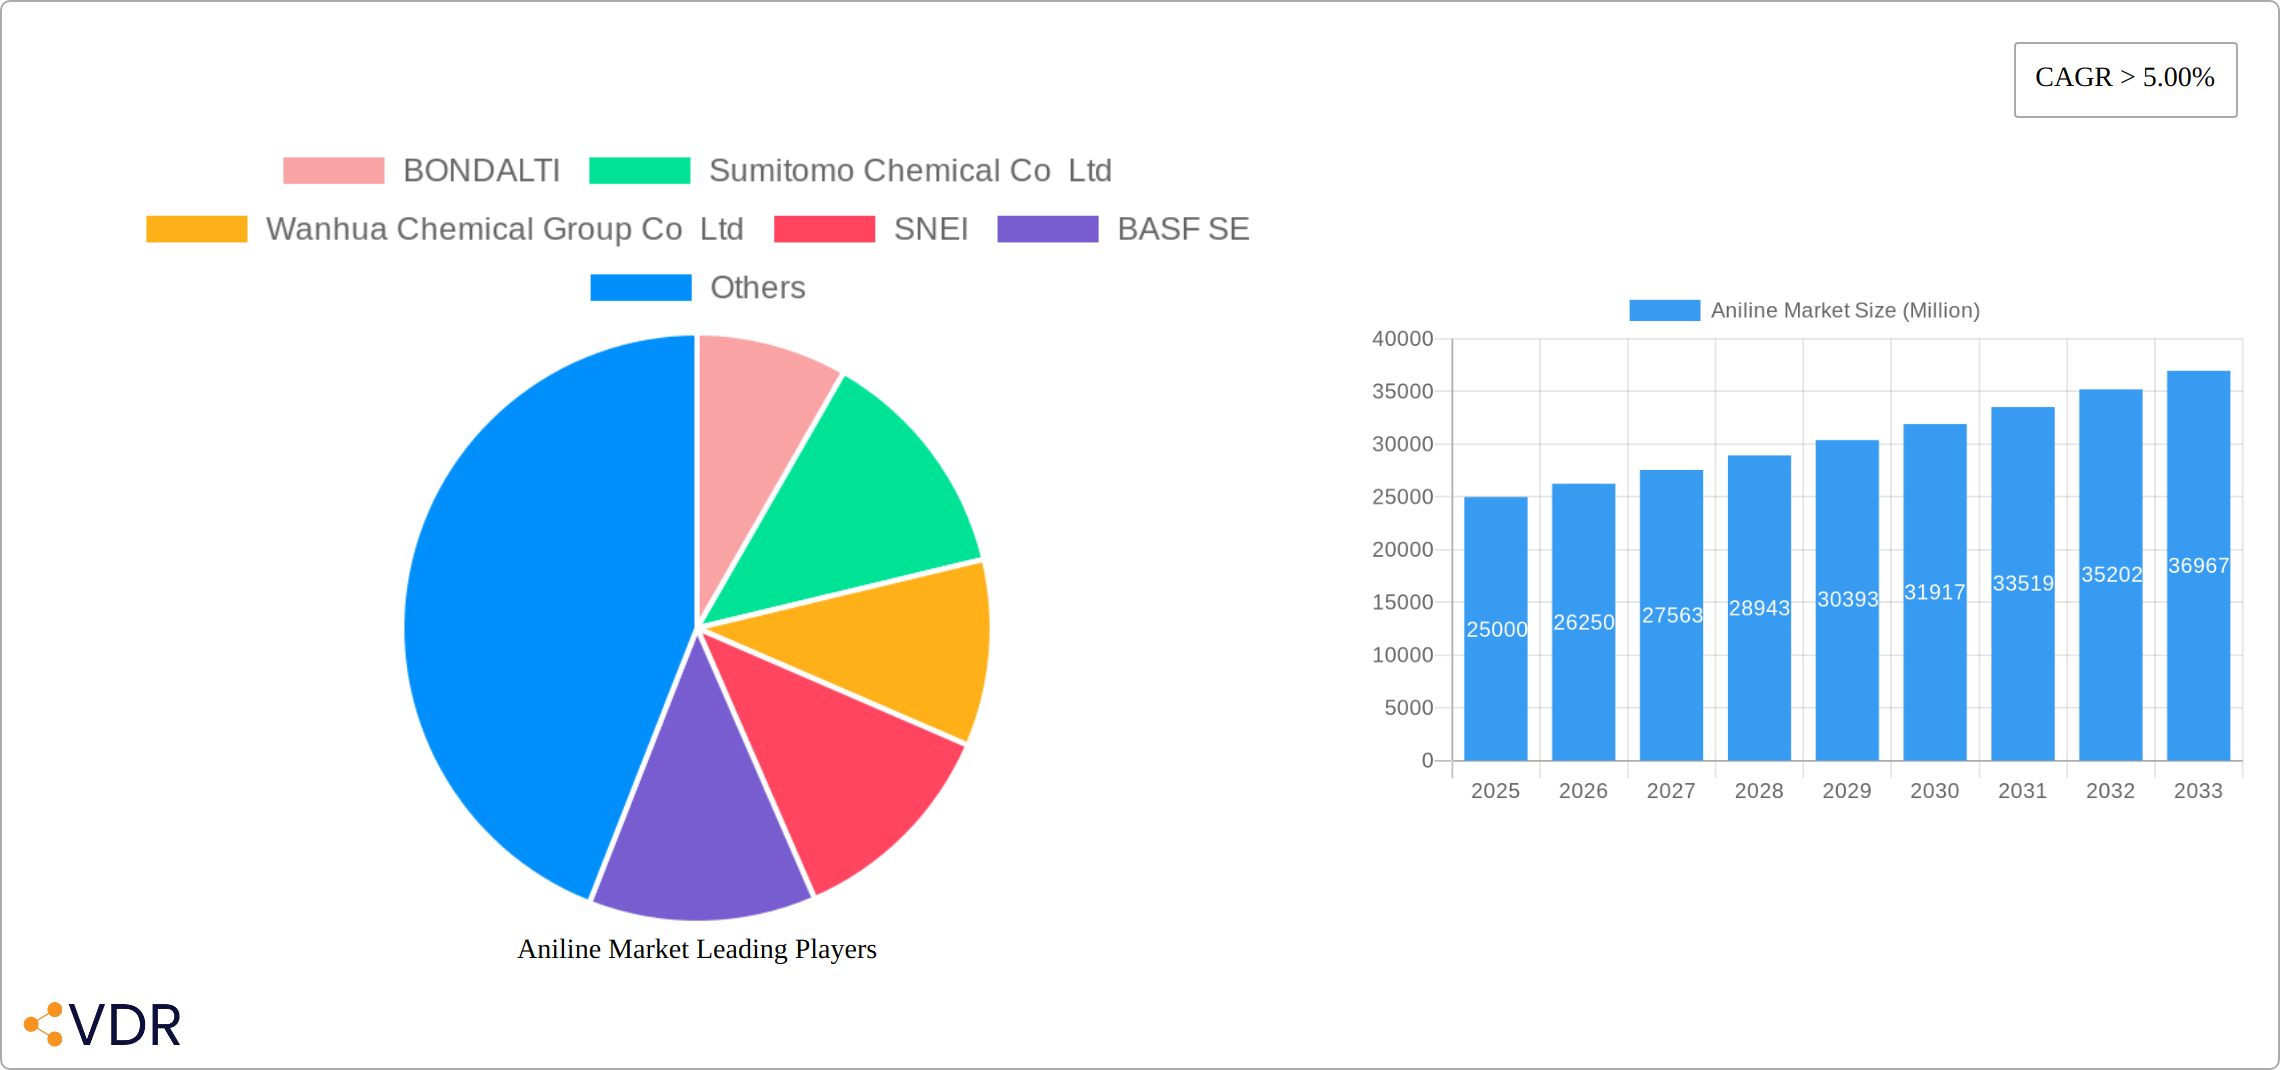
- Market Concentration: Moderately concentrated, with top 5 players holding approximately 60% market share in 2024.
- Technological Innovation: Focus on enhancing efficiency, reducing environmental footprint, and developing new aniline derivatives.
- Regulatory Landscape: Stringent environmental regulations influence production methods and operational costs.
- Competitive Substitutes: Limited, but some applications see competition from alternative materials.
- M&A Activity: Moderate level of consolidation, aiming for increased production capacity and geographic diversification. Approximately xx M&A deals were recorded between 2019 and 2024.
Aniline Market Growth Trends & Insights
The Aniline market witnessed robust growth between 2019 and 2024, driven by increasing demand from key end-use industries. The market size reached xx Million in 2024, and a CAGR of xx% is projected from 2025 to 2033. Technological advancements enabling improved production yield and wider application have further boosted growth. Shifting consumer preferences toward durable and sustainable products, particularly in the automotive and construction sectors, are fueling demand for aniline-based materials. Market penetration in emerging economies is expected to significantly contribute to future growth. Technological disruptions like improved catalysts and process optimization are contributing to increased efficiency and reduced production costs.
Dominant Regions, Countries, or Segments in Aniline Market
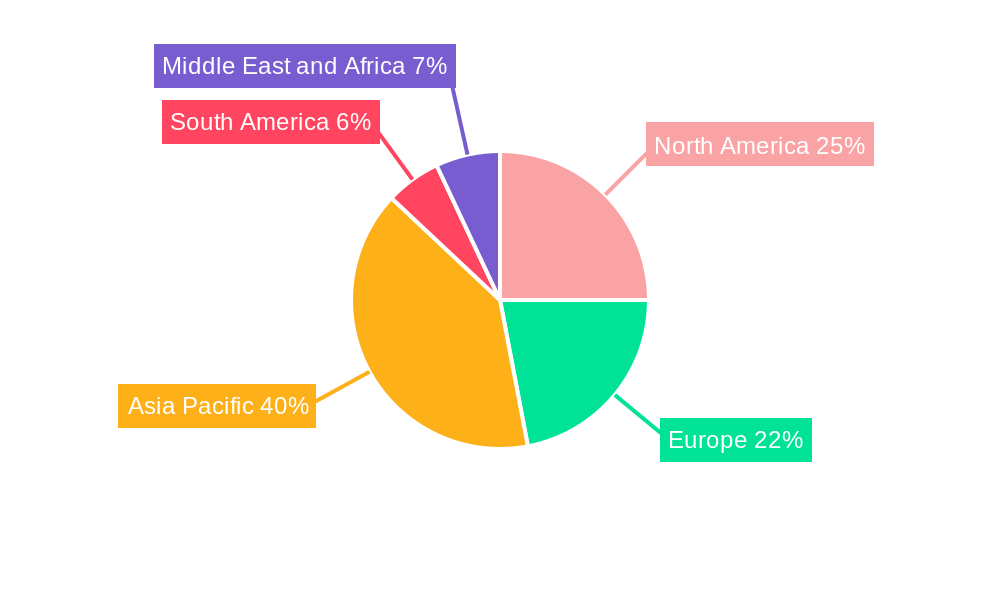
The aniline market is geographically diverse, with Asia-Pacific, particularly China, holding the dominant position in both production and consumption. This regional leadership is fueled by the robust expansion of construction, automotive, and consumer goods sectors. Within these end-user industries, the Building and Construction segment commands the largest market share, primarily driven by the significant demand for polyurethane foams and coatings. Among various applications, Methylene Diphenyl Diisocyanate (MDI) stands out as the leading application due to its extensive use in polyurethane foam production. The precise market values for key segments, like Building & Construction and MDI application, are available in our comprehensive market report. (Note: xx Million figures are available in the full report).
Key Regional Drivers:
- Asia-Pacific: Rapid economic growth, substantial infrastructure development, and escalating demand from key end-use sectors are propelling the market in this region. China's role as a manufacturing hub further strengthens this dominance.
- North America: While experiencing stable demand from established industries, North America benefits from continuous technological advancements and innovation in aniline production and application.
- Europe: The stringent environmental regulations in Europe are driving innovation towards more sustainable aniline production methods and pushing for the adoption of eco-friendly alternatives.
Dominant Segments:
- End-User Industry: The Building and Construction sector remains the leading consumer of aniline, followed by the Automotive and Rubber industries. (Detailed market share figures for 2024 are available in the full report.)
- Application: Methylene Diphenyl Diisocyanate (MDI) continues its dominance as the primary application of aniline, primarily due to its indispensable role in the polyurethane foam market. (Detailed market value figures for 2024 are available in the full report.)
Aniline Market Product Landscape
The Aniline market offers a range of products with varying specifications and purities, catering to the diverse needs of different applications. Product innovation focuses on improving performance characteristics such as purity, stability, and reactivity. Technological advancements like advanced purification techniques and improved production processes are enhancing product quality and reducing environmental impact. Unique selling propositions often center around superior performance, cost-effectiveness, and environmental compatibility.
Key Drivers, Barriers & Challenges in Aniline Market
Key Drivers:
- The burgeoning demand from key end-use sectors, notably building & construction and the automotive industry, is a major catalyst for market growth.
- Technological advancements are playing a crucial role, leading to increased production efficiency and reduced manufacturing costs.
- Significant investments in infrastructure development, particularly in emerging economies, further contribute to the market's expansion.
Key Challenges:
- Volatility in raw material prices, especially benzene, poses a significant risk to profitability and market stability.
- Stricter environmental regulations are increasing production costs and necessitate investment in cleaner technologies.
- Intense competition from both established market players and potential new entrants creates a challenging landscape.
- Supply chain disruptions, experienced in 2022, highlight the vulnerability of the market to external shocks and resulted in a notable increase (xx%) in production costs.
Emerging Opportunities in Aniline Market
- Expansion into untapped markets in developing economies.
- Development of new applications in emerging sectors like renewable energy and advanced materials.
- Growing demand for high-purity aniline for specialized applications.
- Increasing focus on sustainable and environmentally friendly aniline production methods.
Growth Accelerators in the Aniline Market Industry
Several key factors are poised to propel long-term growth within the Aniline market. Continuous technological advancements enhancing production efficiency, coupled with strategic partnerships aimed at securing a reliable supply of raw materials, will be crucial for sustained expansion. Government support for sustainable manufacturing practices and investments in large-scale infrastructure projects are expected to further stimulate market growth. Furthermore, the exploration of novel applications within niche markets, fueled by innovation and shifting consumer preferences, presents significant opportunities for long-term growth and market diversification.
Key Players Shaping the Aniline Market Market
- BONDALTI
- Sumitomo Chemical Co Ltd
- Wanhua Chemical Group Co Ltd
- SNEI
- BASF SE
- Huntsman International LLC
- Tosoh Corporation
- Dow
- Jilin Connell Chemical Industry Co Ltd
- Covestro AG
- SP Chemicals Holdings Ltd
- GNFC
Notable Milestones in Aniline Market Sector
- October 2022: Covestro announced the construction of a new USD 300 million aniline production facility in Antwerp, Belgium, strengthening its European MDI production network.
In-Depth Aniline Market Market Outlook
The Aniline market is poised for continued growth, driven by robust demand from key end-use sectors, technological advancements, and strategic investments in production capacity. The market's future potential is substantial, especially in emerging economies. Companies focusing on sustainable practices, innovation, and strategic partnerships will be well-positioned to capitalize on the numerous growth opportunities in this dynamic market. The market is expected to experience a continued CAGR of xx% through 2033, presenting significant opportunities for investors and industry players.
Aniline Market Segmentation
-
1. Application
- 1.1. Methylene Diphenyl Diisocyanate (MDI)
- 1.2. Rubber-processing Chemicals
- 1.3. Agricultural Chemicals
- 1.4. Dyes and Pigments
- 1.5. Specialty Fibers
- 1.6. Other Applications
-
2. End-user Industry
- 2.1. Building and Construction
- 2.2. Rubber
- 2.3. Consumer Goods
- 2.4. Automotive
- 2.5. Packaging
- 2.6. Agriculture
- 2.7. Other End-user Industries
Aniline Market Segmentation By Geography
-
1. Asia Pacific
- 1.1. China
- 1.2. India
- 1.3. Japan
- 1.4. South Korea
- 1.5. Rest of Asia Pacific
-
2. North America
- 2.1. United States
- 2.2. Canada
- 2.3. Mexico
-
3. Europe
- 3.1. Germany
- 3.2. United Kingdom
- 3.3. Italy
- 3.4. France
- 3.5. Rest of Europe
-
4. South America
- 4.1. Brazil
- 4.2. Argentina
- 4.3. Rest of South America
-
5. Middle East and Africa
- 5.1. South Africa
- 5.2. Saudi Arabia
- 5.3. Rest of Middle East and Africa
Aniline Market REPORT HIGHLIGHTS
| Aspects | Details |
|---|---|
| Study Period | 2019-2033 |
| Base Year | 2024 |
| Estimated Year | 2025 |
| Forecast Period | 2025-2033 |
| Historical Period | 2019-2024 |
| Growth Rate | CAGR of > 5.00% from 2019-2033 |
| Segmentation |
|
Table of Contents
- 1. Introduction
- 1.1. Research Scope
- 1.2. Market Segmentation
- 1.3. Research Methodology
- 1.4. Definitions and Assumptions
- 2. Executive Summary
- 2.1. Introduction
- 3. Market Dynamics
- 3.1. Introduction
- 3.2. Market Drivers
- 3.2.1 Increasing Demand for MDI in Coatings
- 3.2.2 Adhesives
- 3.2.3 and Sealants Industry; Rising Demand from the Polyurethane Industry
- 3.3. Market Restrains
- 3.3.1. Detrimental Effects of Methemoglobin on Health; Other Restraints
- 3.4. Market Trends
- 3.4.1. Growing Demand from the Building and Construction Sector
- 4. Market Factor Analysis
- 4.1. Porters Five Forces
- 4.2. Supply/Value Chain
- 4.3. PESTEL analysis
- 4.4. Market Entropy
- 4.5. Patent/Trademark Analysis
- 5. Global Aniline Market Analysis, Insights and Forecast, 2019-2031
- 5.1. Market Analysis, Insights and Forecast - by Application
- 5.1.1. Methylene Diphenyl Diisocyanate (MDI)
- 5.1.2. Rubber-processing Chemicals
- 5.1.3. Agricultural Chemicals
- 5.1.4. Dyes and Pigments
- 5.1.5. Specialty Fibers
- 5.1.6. Other Applications
- 5.2. Market Analysis, Insights and Forecast - by End-user Industry
- 5.2.1. Building and Construction
- 5.2.2. Rubber
- 5.2.3. Consumer Goods
- 5.2.4. Automotive
- 5.2.5. Packaging
- 5.2.6. Agriculture
- 5.2.7. Other End-user Industries
- 5.3. Market Analysis, Insights and Forecast - by Region
- 5.3.1. Asia Pacific
- 5.3.2. North America
- 5.3.3. Europe
- 5.3.4. South America
- 5.3.5. Middle East and Africa
- 5.1. Market Analysis, Insights and Forecast - by Application
- 6. Asia Pacific Aniline Market Analysis, Insights and Forecast, 2019-2031
- 6.1. Market Analysis, Insights and Forecast - by Application
- 6.1.1. Methylene Diphenyl Diisocyanate (MDI)
- 6.1.2. Rubber-processing Chemicals
- 6.1.3. Agricultural Chemicals
- 6.1.4. Dyes and Pigments
- 6.1.5. Specialty Fibers
- 6.1.6. Other Applications
- 6.2. Market Analysis, Insights and Forecast - by End-user Industry
- 6.2.1. Building and Construction
- 6.2.2. Rubber
- 6.2.3. Consumer Goods
- 6.2.4. Automotive
- 6.2.5. Packaging
- 6.2.6. Agriculture
- 6.2.7. Other End-user Industries
- 6.1. Market Analysis, Insights and Forecast - by Application
- 7. North America Aniline Market Analysis, Insights and Forecast, 2019-2031
- 7.1. Market Analysis, Insights and Forecast - by Application
- 7.1.1. Methylene Diphenyl Diisocyanate (MDI)
- 7.1.2. Rubber-processing Chemicals
- 7.1.3. Agricultural Chemicals
- 7.1.4. Dyes and Pigments
- 7.1.5. Specialty Fibers
- 7.1.6. Other Applications
- 7.2. Market Analysis, Insights and Forecast - by End-user Industry
- 7.2.1. Building and Construction
- 7.2.2. Rubber
- 7.2.3. Consumer Goods
- 7.2.4. Automotive
- 7.2.5. Packaging
- 7.2.6. Agriculture
- 7.2.7. Other End-user Industries
- 7.1. Market Analysis, Insights and Forecast - by Application
- 8. Europe Aniline Market Analysis, Insights and Forecast, 2019-2031
- 8.1. Market Analysis, Insights and Forecast - by Application
- 8.1.1. Methylene Diphenyl Diisocyanate (MDI)
- 8.1.2. Rubber-processing Chemicals
- 8.1.3. Agricultural Chemicals
- 8.1.4. Dyes and Pigments
- 8.1.5. Specialty Fibers
- 8.1.6. Other Applications
- 8.2. Market Analysis, Insights and Forecast - by End-user Industry
- 8.2.1. Building and Construction
- 8.2.2. Rubber
- 8.2.3. Consumer Goods
- 8.2.4. Automotive
- 8.2.5. Packaging
- 8.2.6. Agriculture
- 8.2.7. Other End-user Industries
- 8.1. Market Analysis, Insights and Forecast - by Application
- 9. South America Aniline Market Analysis, Insights and Forecast, 2019-2031
- 9.1. Market Analysis, Insights and Forecast - by Application
- 9.1.1. Methylene Diphenyl Diisocyanate (MDI)
- 9.1.2. Rubber-processing Chemicals
- 9.1.3. Agricultural Chemicals
- 9.1.4. Dyes and Pigments
- 9.1.5. Specialty Fibers
- 9.1.6. Other Applications
- 9.2. Market Analysis, Insights and Forecast - by End-user Industry
- 9.2.1. Building and Construction
- 9.2.2. Rubber
- 9.2.3. Consumer Goods
- 9.2.4. Automotive
- 9.2.5. Packaging
- 9.2.6. Agriculture
- 9.2.7. Other End-user Industries
- 9.1. Market Analysis, Insights and Forecast - by Application
- 10. Middle East and Africa Aniline Market Analysis, Insights and Forecast, 2019-2031
- 10.1. Market Analysis, Insights and Forecast - by Application
- 10.1.1. Methylene Diphenyl Diisocyanate (MDI)
- 10.1.2. Rubber-processing Chemicals
- 10.1.3. Agricultural Chemicals
- 10.1.4. Dyes and Pigments
- 10.1.5. Specialty Fibers
- 10.1.6. Other Applications
- 10.2. Market Analysis, Insights and Forecast - by End-user Industry
- 10.2.1. Building and Construction
- 10.2.2. Rubber
- 10.2.3. Consumer Goods
- 10.2.4. Automotive
- 10.2.5. Packaging
- 10.2.6. Agriculture
- 10.2.7. Other End-user Industries
- 10.1. Market Analysis, Insights and Forecast - by Application
- 11. Asia Pacific Aniline Market Analysis, Insights and Forecast, 2019-2031
- 11.1. Market Analysis, Insights and Forecast - By Country/Sub-region
- 11.1.1 China
- 11.1.2 India
- 11.1.3 Japan
- 11.1.4 South Korea
- 11.1.5 Rest of Asia Pacific
- 12. North America Aniline Market Analysis, Insights and Forecast, 2019-2031
- 12.1. Market Analysis, Insights and Forecast - By Country/Sub-region
- 12.1.1 United States
- 12.1.2 Canada
- 12.1.3 Mexico
- 13. Europe Aniline Market Analysis, Insights and Forecast, 2019-2031
- 13.1. Market Analysis, Insights and Forecast - By Country/Sub-region
- 13.1.1 Germany
- 13.1.2 United Kingdom
- 13.1.3 Italy
- 13.1.4 France
- 13.1.5 Rest of Europe
- 14. South America Aniline Market Analysis, Insights and Forecast, 2019-2031
- 14.1. Market Analysis, Insights and Forecast - By Country/Sub-region
- 14.1.1 Brazil
- 14.1.2 Argentina
- 14.1.3 Rest of South America
- 15. Middle East and Africa Aniline Market Analysis, Insights and Forecast, 2019-2031
- 15.1. Market Analysis, Insights and Forecast - By Country/Sub-region
- 15.1.1 South Africa
- 15.1.2 Saudi Arabia
- 15.1.3 Rest of Middle East and Africa
- 16. Competitive Analysis
- 16.1. Global Market Share Analysis 2024
- 16.2. Company Profiles
- 16.2.1 BONDALTI
- 16.2.1.1. Overview
- 16.2.1.2. Products
- 16.2.1.3. SWOT Analysis
- 16.2.1.4. Recent Developments
- 16.2.1.5. Financials (Based on Availability)
- 16.2.2 Sumitomo Chemical Co Ltd
- 16.2.2.1. Overview
- 16.2.2.2. Products
- 16.2.2.3. SWOT Analysis
- 16.2.2.4. Recent Developments
- 16.2.2.5. Financials (Based on Availability)
- 16.2.3 Wanhua Chemical Group Co Ltd
- 16.2.3.1. Overview
- 16.2.3.2. Products
- 16.2.3.3. SWOT Analysis
- 16.2.3.4. Recent Developments
- 16.2.3.5. Financials (Based on Availability)
- 16.2.4 SNEI
- 16.2.4.1. Overview
- 16.2.4.2. Products
- 16.2.4.3. SWOT Analysis
- 16.2.4.4. Recent Developments
- 16.2.4.5. Financials (Based on Availability)
- 16.2.5 BASF SE
- 16.2.5.1. Overview
- 16.2.5.2. Products
- 16.2.5.3. SWOT Analysis
- 16.2.5.4. Recent Developments
- 16.2.5.5. Financials (Based on Availability)
- 16.2.6 Huntsman International LLC
- 16.2.6.1. Overview
- 16.2.6.2. Products
- 16.2.6.3. SWOT Analysis
- 16.2.6.4. Recent Developments
- 16.2.6.5. Financials (Based on Availability)
- 16.2.7 Tosoh Corporation
- 16.2.7.1. Overview
- 16.2.7.2. Products
- 16.2.7.3. SWOT Analysis
- 16.2.7.4. Recent Developments
- 16.2.7.5. Financials (Based on Availability)
- 16.2.8 Dow
- 16.2.8.1. Overview
- 16.2.8.2. Products
- 16.2.8.3. SWOT Analysis
- 16.2.8.4. Recent Developments
- 16.2.8.5. Financials (Based on Availability)
- 16.2.9 Jilin Connell Chemical Industry Co Ltd
- 16.2.9.1. Overview
- 16.2.9.2. Products
- 16.2.9.3. SWOT Analysis
- 16.2.9.4. Recent Developments
- 16.2.9.5. Financials (Based on Availability)
- 16.2.10 Covestro AG
- 16.2.10.1. Overview
- 16.2.10.2. Products
- 16.2.10.3. SWOT Analysis
- 16.2.10.4. Recent Developments
- 16.2.10.5. Financials (Based on Availability)
- 16.2.11 SP Chemicals Holdings Ltd
- 16.2.11.1. Overview
- 16.2.11.2. Products
- 16.2.11.3. SWOT Analysis
- 16.2.11.4. Recent Developments
- 16.2.11.5. Financials (Based on Availability)
- 16.2.12 GNFC
- 16.2.12.1. Overview
- 16.2.12.2. Products
- 16.2.12.3. SWOT Analysis
- 16.2.12.4. Recent Developments
- 16.2.12.5. Financials (Based on Availability)
- 16.2.1 BONDALTI
List of Figures
- Figure 1: Global Aniline Market Revenue Breakdown (Million, %) by Region 2024 & 2032
- Figure 2: Global Aniline Market Volume Breakdown ( m³/mo, %) by Region 2024 & 2032
- Figure 3: Asia Pacific Aniline Market Revenue (Million), by Country 2024 & 2032
- Figure 4: Asia Pacific Aniline Market Volume ( m³/mo), by Country 2024 & 2032
- Figure 5: Asia Pacific Aniline Market Revenue Share (%), by Country 2024 & 2032
- Figure 6: Asia Pacific Aniline Market Volume Share (%), by Country 2024 & 2032
- Figure 7: North America Aniline Market Revenue (Million), by Country 2024 & 2032
- Figure 8: North America Aniline Market Volume ( m³/mo), by Country 2024 & 2032
- Figure 9: North America Aniline Market Revenue Share (%), by Country 2024 & 2032
- Figure 10: North America Aniline Market Volume Share (%), by Country 2024 & 2032
- Figure 11: Europe Aniline Market Revenue (Million), by Country 2024 & 2032
- Figure 12: Europe Aniline Market Volume ( m³/mo), by Country 2024 & 2032
- Figure 13: Europe Aniline Market Revenue Share (%), by Country 2024 & 2032
- Figure 14: Europe Aniline Market Volume Share (%), by Country 2024 & 2032
- Figure 15: South America Aniline Market Revenue (Million), by Country 2024 & 2032
- Figure 16: South America Aniline Market Volume ( m³/mo), by Country 2024 & 2032
- Figure 17: South America Aniline Market Revenue Share (%), by Country 2024 & 2032
- Figure 18: South America Aniline Market Volume Share (%), by Country 2024 & 2032
- Figure 19: Middle East and Africa Aniline Market Revenue (Million), by Country 2024 & 2032
- Figure 20: Middle East and Africa Aniline Market Volume ( m³/mo), by Country 2024 & 2032
- Figure 21: Middle East and Africa Aniline Market Revenue Share (%), by Country 2024 & 2032
- Figure 22: Middle East and Africa Aniline Market Volume Share (%), by Country 2024 & 2032
- Figure 23: Asia Pacific Aniline Market Revenue (Million), by Application 2024 & 2032
- Figure 24: Asia Pacific Aniline Market Volume ( m³/mo), by Application 2024 & 2032
- Figure 25: Asia Pacific Aniline Market Revenue Share (%), by Application 2024 & 2032
- Figure 26: Asia Pacific Aniline Market Volume Share (%), by Application 2024 & 2032
- Figure 27: Asia Pacific Aniline Market Revenue (Million), by End-user Industry 2024 & 2032
- Figure 28: Asia Pacific Aniline Market Volume ( m³/mo), by End-user Industry 2024 & 2032
- Figure 29: Asia Pacific Aniline Market Revenue Share (%), by End-user Industry 2024 & 2032
- Figure 30: Asia Pacific Aniline Market Volume Share (%), by End-user Industry 2024 & 2032
- Figure 31: Asia Pacific Aniline Market Revenue (Million), by Country 2024 & 2032
- Figure 32: Asia Pacific Aniline Market Volume ( m³/mo), by Country 2024 & 2032
- Figure 33: Asia Pacific Aniline Market Revenue Share (%), by Country 2024 & 2032
- Figure 34: Asia Pacific Aniline Market Volume Share (%), by Country 2024 & 2032
- Figure 35: North America Aniline Market Revenue (Million), by Application 2024 & 2032
- Figure 36: North America Aniline Market Volume ( m³/mo), by Application 2024 & 2032
- Figure 37: North America Aniline Market Revenue Share (%), by Application 2024 & 2032
- Figure 38: North America Aniline Market Volume Share (%), by Application 2024 & 2032
- Figure 39: North America Aniline Market Revenue (Million), by End-user Industry 2024 & 2032
- Figure 40: North America Aniline Market Volume ( m³/mo), by End-user Industry 2024 & 2032
- Figure 41: North America Aniline Market Revenue Share (%), by End-user Industry 2024 & 2032
- Figure 42: North America Aniline Market Volume Share (%), by End-user Industry 2024 & 2032
- Figure 43: North America Aniline Market Revenue (Million), by Country 2024 & 2032
- Figure 44: North America Aniline Market Volume ( m³/mo), by Country 2024 & 2032
- Figure 45: North America Aniline Market Revenue Share (%), by Country 2024 & 2032
- Figure 46: North America Aniline Market Volume Share (%), by Country 2024 & 2032
- Figure 47: Europe Aniline Market Revenue (Million), by Application 2024 & 2032
- Figure 48: Europe Aniline Market Volume ( m³/mo), by Application 2024 & 2032
- Figure 49: Europe Aniline Market Revenue Share (%), by Application 2024 & 2032
- Figure 50: Europe Aniline Market Volume Share (%), by Application 2024 & 2032
- Figure 51: Europe Aniline Market Revenue (Million), by End-user Industry 2024 & 2032
- Figure 52: Europe Aniline Market Volume ( m³/mo), by End-user Industry 2024 & 2032
- Figure 53: Europe Aniline Market Revenue Share (%), by End-user Industry 2024 & 2032
- Figure 54: Europe Aniline Market Volume Share (%), by End-user Industry 2024 & 2032
- Figure 55: Europe Aniline Market Revenue (Million), by Country 2024 & 2032
- Figure 56: Europe Aniline Market Volume ( m³/mo), by Country 2024 & 2032
- Figure 57: Europe Aniline Market Revenue Share (%), by Country 2024 & 2032
- Figure 58: Europe Aniline Market Volume Share (%), by Country 2024 & 2032
- Figure 59: South America Aniline Market Revenue (Million), by Application 2024 & 2032
- Figure 60: South America Aniline Market Volume ( m³/mo), by Application 2024 & 2032
- Figure 61: South America Aniline Market Revenue Share (%), by Application 2024 & 2032
- Figure 62: South America Aniline Market Volume Share (%), by Application 2024 & 2032
- Figure 63: South America Aniline Market Revenue (Million), by End-user Industry 2024 & 2032
- Figure 64: South America Aniline Market Volume ( m³/mo), by End-user Industry 2024 & 2032
- Figure 65: South America Aniline Market Revenue Share (%), by End-user Industry 2024 & 2032
- Figure 66: South America Aniline Market Volume Share (%), by End-user Industry 2024 & 2032
- Figure 67: South America Aniline Market Revenue (Million), by Country 2024 & 2032
- Figure 68: South America Aniline Market Volume ( m³/mo), by Country 2024 & 2032
- Figure 69: South America Aniline Market Revenue Share (%), by Country 2024 & 2032
- Figure 70: South America Aniline Market Volume Share (%), by Country 2024 & 2032
- Figure 71: Middle East and Africa Aniline Market Revenue (Million), by Application 2024 & 2032
- Figure 72: Middle East and Africa Aniline Market Volume ( m³/mo), by Application 2024 & 2032
- Figure 73: Middle East and Africa Aniline Market Revenue Share (%), by Application 2024 & 2032
- Figure 74: Middle East and Africa Aniline Market Volume Share (%), by Application 2024 & 2032
- Figure 75: Middle East and Africa Aniline Market Revenue (Million), by End-user Industry 2024 & 2032
- Figure 76: Middle East and Africa Aniline Market Volume ( m³/mo), by End-user Industry 2024 & 2032
- Figure 77: Middle East and Africa Aniline Market Revenue Share (%), by End-user Industry 2024 & 2032
- Figure 78: Middle East and Africa Aniline Market Volume Share (%), by End-user Industry 2024 & 2032
- Figure 79: Middle East and Africa Aniline Market Revenue (Million), by Country 2024 & 2032
- Figure 80: Middle East and Africa Aniline Market Volume ( m³/mo), by Country 2024 & 2032
- Figure 81: Middle East and Africa Aniline Market Revenue Share (%), by Country 2024 & 2032
- Figure 82: Middle East and Africa Aniline Market Volume Share (%), by Country 2024 & 2032
List of Tables
- Table 1: Global Aniline Market Revenue Million Forecast, by Region 2019 & 2032
- Table 2: Global Aniline Market Volume m³/mo Forecast, by Region 2019 & 2032
- Table 3: Global Aniline Market Revenue Million Forecast, by Application 2019 & 2032
- Table 4: Global Aniline Market Volume m³/mo Forecast, by Application 2019 & 2032
- Table 5: Global Aniline Market Revenue Million Forecast, by End-user Industry 2019 & 2032
- Table 6: Global Aniline Market Volume m³/mo Forecast, by End-user Industry 2019 & 2032
- Table 7: Global Aniline Market Revenue Million Forecast, by Region 2019 & 2032
- Table 8: Global Aniline Market Volume m³/mo Forecast, by Region 2019 & 2032
- Table 9: Global Aniline Market Revenue Million Forecast, by Country 2019 & 2032
- Table 10: Global Aniline Market Volume m³/mo Forecast, by Country 2019 & 2032
- Table 11: China Aniline Market Revenue (Million) Forecast, by Application 2019 & 2032
- Table 12: China Aniline Market Volume ( m³/mo) Forecast, by Application 2019 & 2032
- Table 13: India Aniline Market Revenue (Million) Forecast, by Application 2019 & 2032
- Table 14: India Aniline Market Volume ( m³/mo) Forecast, by Application 2019 & 2032
- Table 15: Japan Aniline Market Revenue (Million) Forecast, by Application 2019 & 2032
- Table 16: Japan Aniline Market Volume ( m³/mo) Forecast, by Application 2019 & 2032
- Table 17: South Korea Aniline Market Revenue (Million) Forecast, by Application 2019 & 2032
- Table 18: South Korea Aniline Market Volume ( m³/mo) Forecast, by Application 2019 & 2032
- Table 19: Rest of Asia Pacific Aniline Market Revenue (Million) Forecast, by Application 2019 & 2032
- Table 20: Rest of Asia Pacific Aniline Market Volume ( m³/mo) Forecast, by Application 2019 & 2032
- Table 21: Global Aniline Market Revenue Million Forecast, by Country 2019 & 2032
- Table 22: Global Aniline Market Volume m³/mo Forecast, by Country 2019 & 2032
- Table 23: United States Aniline Market Revenue (Million) Forecast, by Application 2019 & 2032
- Table 24: United States Aniline Market Volume ( m³/mo) Forecast, by Application 2019 & 2032
- Table 25: Canada Aniline Market Revenue (Million) Forecast, by Application 2019 & 2032
- Table 26: Canada Aniline Market Volume ( m³/mo) Forecast, by Application 2019 & 2032
- Table 27: Mexico Aniline Market Revenue (Million) Forecast, by Application 2019 & 2032
- Table 28: Mexico Aniline Market Volume ( m³/mo) Forecast, by Application 2019 & 2032
- Table 29: Global Aniline Market Revenue Million Forecast, by Country 2019 & 2032
- Table 30: Global Aniline Market Volume m³/mo Forecast, by Country 2019 & 2032
- Table 31: Germany Aniline Market Revenue (Million) Forecast, by Application 2019 & 2032
- Table 32: Germany Aniline Market Volume ( m³/mo) Forecast, by Application 2019 & 2032
- Table 33: United Kingdom Aniline Market Revenue (Million) Forecast, by Application 2019 & 2032
- Table 34: United Kingdom Aniline Market Volume ( m³/mo) Forecast, by Application 2019 & 2032
- Table 35: Italy Aniline Market Revenue (Million) Forecast, by Application 2019 & 2032
- Table 36: Italy Aniline Market Volume ( m³/mo) Forecast, by Application 2019 & 2032
- Table 37: France Aniline Market Revenue (Million) Forecast, by Application 2019 & 2032
- Table 38: France Aniline Market Volume ( m³/mo) Forecast, by Application 2019 & 2032
- Table 39: Rest of Europe Aniline Market Revenue (Million) Forecast, by Application 2019 & 2032
- Table 40: Rest of Europe Aniline Market Volume ( m³/mo) Forecast, by Application 2019 & 2032
- Table 41: Global Aniline Market Revenue Million Forecast, by Country 2019 & 2032
- Table 42: Global Aniline Market Volume m³/mo Forecast, by Country 2019 & 2032
- Table 43: Brazil Aniline Market Revenue (Million) Forecast, by Application 2019 & 2032
- Table 44: Brazil Aniline Market Volume ( m³/mo) Forecast, by Application 2019 & 2032
- Table 45: Argentina Aniline Market Revenue (Million) Forecast, by Application 2019 & 2032
- Table 46: Argentina Aniline Market Volume ( m³/mo) Forecast, by Application 2019 & 2032
- Table 47: Rest of South America Aniline Market Revenue (Million) Forecast, by Application 2019 & 2032
- Table 48: Rest of South America Aniline Market Volume ( m³/mo) Forecast, by Application 2019 & 2032
- Table 49: Global Aniline Market Revenue Million Forecast, by Country 2019 & 2032
- Table 50: Global Aniline Market Volume m³/mo Forecast, by Country 2019 & 2032
- Table 51: South Africa Aniline Market Revenue (Million) Forecast, by Application 2019 & 2032
- Table 52: South Africa Aniline Market Volume ( m³/mo) Forecast, by Application 2019 & 2032
- Table 53: Saudi Arabia Aniline Market Revenue (Million) Forecast, by Application 2019 & 2032
- Table 54: Saudi Arabia Aniline Market Volume ( m³/mo) Forecast, by Application 2019 & 2032
- Table 55: Rest of Middle East and Africa Aniline Market Revenue (Million) Forecast, by Application 2019 & 2032
- Table 56: Rest of Middle East and Africa Aniline Market Volume ( m³/mo) Forecast, by Application 2019 & 2032
- Table 57: Global Aniline Market Revenue Million Forecast, by Application 2019 & 2032
- Table 58: Global Aniline Market Volume m³/mo Forecast, by Application 2019 & 2032
- Table 59: Global Aniline Market Revenue Million Forecast, by End-user Industry 2019 & 2032
- Table 60: Global Aniline Market Volume m³/mo Forecast, by End-user Industry 2019 & 2032
- Table 61: Global Aniline Market Revenue Million Forecast, by Country 2019 & 2032
- Table 62: Global Aniline Market Volume m³/mo Forecast, by Country 2019 & 2032
- Table 63: China Aniline Market Revenue (Million) Forecast, by Application 2019 & 2032
- Table 64: China Aniline Market Volume ( m³/mo) Forecast, by Application 2019 & 2032
- Table 65: India Aniline Market Revenue (Million) Forecast, by Application 2019 & 2032
- Table 66: India Aniline Market Volume ( m³/mo) Forecast, by Application 2019 & 2032
- Table 67: Japan Aniline Market Revenue (Million) Forecast, by Application 2019 & 2032
- Table 68: Japan Aniline Market Volume ( m³/mo) Forecast, by Application 2019 & 2032
- Table 69: South Korea Aniline Market Revenue (Million) Forecast, by Application 2019 & 2032
- Table 70: South Korea Aniline Market Volume ( m³/mo) Forecast, by Application 2019 & 2032
- Table 71: Rest of Asia Pacific Aniline Market Revenue (Million) Forecast, by Application 2019 & 2032
- Table 72: Rest of Asia Pacific Aniline Market Volume ( m³/mo) Forecast, by Application 2019 & 2032
- Table 73: Global Aniline Market Revenue Million Forecast, by Application 2019 & 2032
- Table 74: Global Aniline Market Volume m³/mo Forecast, by Application 2019 & 2032
- Table 75: Global Aniline Market Revenue Million Forecast, by End-user Industry 2019 & 2032
- Table 76: Global Aniline Market Volume m³/mo Forecast, by End-user Industry 2019 & 2032
- Table 77: Global Aniline Market Revenue Million Forecast, by Country 2019 & 2032
- Table 78: Global Aniline Market Volume m³/mo Forecast, by Country 2019 & 2032
- Table 79: United States Aniline Market Revenue (Million) Forecast, by Application 2019 & 2032
- Table 80: United States Aniline Market Volume ( m³/mo) Forecast, by Application 2019 & 2032
- Table 81: Canada Aniline Market Revenue (Million) Forecast, by Application 2019 & 2032
- Table 82: Canada Aniline Market Volume ( m³/mo) Forecast, by Application 2019 & 2032
- Table 83: Mexico Aniline Market Revenue (Million) Forecast, by Application 2019 & 2032
- Table 84: Mexico Aniline Market Volume ( m³/mo) Forecast, by Application 2019 & 2032
- Table 85: Global Aniline Market Revenue Million Forecast, by Application 2019 & 2032
- Table 86: Global Aniline Market Volume m³/mo Forecast, by Application 2019 & 2032
- Table 87: Global Aniline Market Revenue Million Forecast, by End-user Industry 2019 & 2032
- Table 88: Global Aniline Market Volume m³/mo Forecast, by End-user Industry 2019 & 2032
- Table 89: Global Aniline Market Revenue Million Forecast, by Country 2019 & 2032
- Table 90: Global Aniline Market Volume m³/mo Forecast, by Country 2019 & 2032
- Table 91: Germany Aniline Market Revenue (Million) Forecast, by Application 2019 & 2032
- Table 92: Germany Aniline Market Volume ( m³/mo) Forecast, by Application 2019 & 2032
- Table 93: United Kingdom Aniline Market Revenue (Million) Forecast, by Application 2019 & 2032
- Table 94: United Kingdom Aniline Market Volume ( m³/mo) Forecast, by Application 2019 & 2032
- Table 95: Italy Aniline Market Revenue (Million) Forecast, by Application 2019 & 2032
- Table 96: Italy Aniline Market Volume ( m³/mo) Forecast, by Application 2019 & 2032
- Table 97: France Aniline Market Revenue (Million) Forecast, by Application 2019 & 2032
- Table 98: France Aniline Market Volume ( m³/mo) Forecast, by Application 2019 & 2032
- Table 99: Rest of Europe Aniline Market Revenue (Million) Forecast, by Application 2019 & 2032
- Table 100: Rest of Europe Aniline Market Volume ( m³/mo) Forecast, by Application 2019 & 2032
- Table 101: Global Aniline Market Revenue Million Forecast, by Application 2019 & 2032
- Table 102: Global Aniline Market Volume m³/mo Forecast, by Application 2019 & 2032
- Table 103: Global Aniline Market Revenue Million Forecast, by End-user Industry 2019 & 2032
- Table 104: Global Aniline Market Volume m³/mo Forecast, by End-user Industry 2019 & 2032
- Table 105: Global Aniline Market Revenue Million Forecast, by Country 2019 & 2032
- Table 106: Global Aniline Market Volume m³/mo Forecast, by Country 2019 & 2032
- Table 107: Brazil Aniline Market Revenue (Million) Forecast, by Application 2019 & 2032
- Table 108: Brazil Aniline Market Volume ( m³/mo) Forecast, by Application 2019 & 2032
- Table 109: Argentina Aniline Market Revenue (Million) Forecast, by Application 2019 & 2032
- Table 110: Argentina Aniline Market Volume ( m³/mo) Forecast, by Application 2019 & 2032
- Table 111: Rest of South America Aniline Market Revenue (Million) Forecast, by Application 2019 & 2032
- Table 112: Rest of South America Aniline Market Volume ( m³/mo) Forecast, by Application 2019 & 2032
- Table 113: Global Aniline Market Revenue Million Forecast, by Application 2019 & 2032
- Table 114: Global Aniline Market Volume m³/mo Forecast, by Application 2019 & 2032
- Table 115: Global Aniline Market Revenue Million Forecast, by End-user Industry 2019 & 2032
- Table 116: Global Aniline Market Volume m³/mo Forecast, by End-user Industry 2019 & 2032
- Table 117: Global Aniline Market Revenue Million Forecast, by Country 2019 & 2032
- Table 118: Global Aniline Market Volume m³/mo Forecast, by Country 2019 & 2032
- Table 119: South Africa Aniline Market Revenue (Million) Forecast, by Application 2019 & 2032
- Table 120: South Africa Aniline Market Volume ( m³/mo) Forecast, by Application 2019 & 2032
- Table 121: Saudi Arabia Aniline Market Revenue (Million) Forecast, by Application 2019 & 2032
- Table 122: Saudi Arabia Aniline Market Volume ( m³/mo) Forecast, by Application 2019 & 2032
- Table 123: Rest of Middle East and Africa Aniline Market Revenue (Million) Forecast, by Application 2019 & 2032
- Table 124: Rest of Middle East and Africa Aniline Market Volume ( m³/mo) Forecast, by Application 2019 & 2032
Frequently Asked Questions
1. What is the projected Compound Annual Growth Rate (CAGR) of the Aniline Market?
The projected CAGR is approximately > 5.00%.
2. Which companies are prominent players in the Aniline Market?
Key companies in the market include BONDALTI, Sumitomo Chemical Co Ltd, Wanhua Chemical Group Co Ltd, SNEI, BASF SE, Huntsman International LLC, Tosoh Corporation, Dow, Jilin Connell Chemical Industry Co Ltd , Covestro AG, SP Chemicals Holdings Ltd, GNFC.
3. What are the main segments of the Aniline Market?
The market segments include Application, End-user Industry.
4. Can you provide details about the market size?
The market size is estimated to be USD XX Million as of 2022.
5. What are some drivers contributing to market growth?
Increasing Demand for MDI in Coatings. Adhesives. and Sealants Industry; Rising Demand from the Polyurethane Industry.
6. What are the notable trends driving market growth?
Growing Demand from the Building and Construction Sector.
7. Are there any restraints impacting market growth?
Detrimental Effects of Methemoglobin on Health; Other Restraints.
8. Can you provide examples of recent developments in the market?
October 2022: Covestro announced the construction of its new production facility with an investment of more than USD 300 million to manufacture aniline in Antwerp, Belgium. The expansion strengthens its European production network for the foam component MDI.
9. What pricing options are available for accessing the report?
Pricing options include single-user, multi-user, and enterprise licenses priced at USD 4750, USD 5250, and USD 8750 respectively.
10. Is the market size provided in terms of value or volume?
The market size is provided in terms of value, measured in Million and volume, measured in m³/mo.
11. Are there any specific market keywords associated with the report?
Yes, the market keyword associated with the report is "Aniline Market," which aids in identifying and referencing the specific market segment covered.
12. How do I determine which pricing option suits my needs best?
The pricing options vary based on user requirements and access needs. Individual users may opt for single-user licenses, while businesses requiring broader access may choose multi-user or enterprise licenses for cost-effective access to the report.
13. Are there any additional resources or data provided in the Aniline Market report?
While the report offers comprehensive insights, it's advisable to review the specific contents or supplementary materials provided to ascertain if additional resources or data are available.
14. How can I stay updated on further developments or reports in the Aniline Market?
To stay informed about further developments, trends, and reports in the Aniline Market, consider subscribing to industry newsletters, following relevant companies and organizations, or regularly checking reputable industry news sources and publications.
Methodology
Step 1 - Identification of Relevant Samples Size from Population Database


Step 2 - Approaches for Defining Global Market Size (Value, Volume* & Price*)

Note*: In applicable scenarios
Step 3 - Data Sources
Primary Research
- Web Analytics
- Survey Reports
- Research Institute
- Latest Research Reports
- Opinion Leaders
Secondary Research
- Annual Reports
- White Paper
- Latest Press Release
- Industry Association
- Paid Database
- Investor Presentations

Step 4 - Data Triangulation
Involves using different sources of information in order to increase the validity of a study
These sources are likely to be stakeholders in a program - participants, other researchers, program staff, other community members, and so on.
Then we put all data in single framework & apply various statistical tools to find out the dynamic on the market.
During the analysis stage, feedback from the stakeholder groups would be compared to determine areas of agreement as well as areas of divergence


