
Key Insights
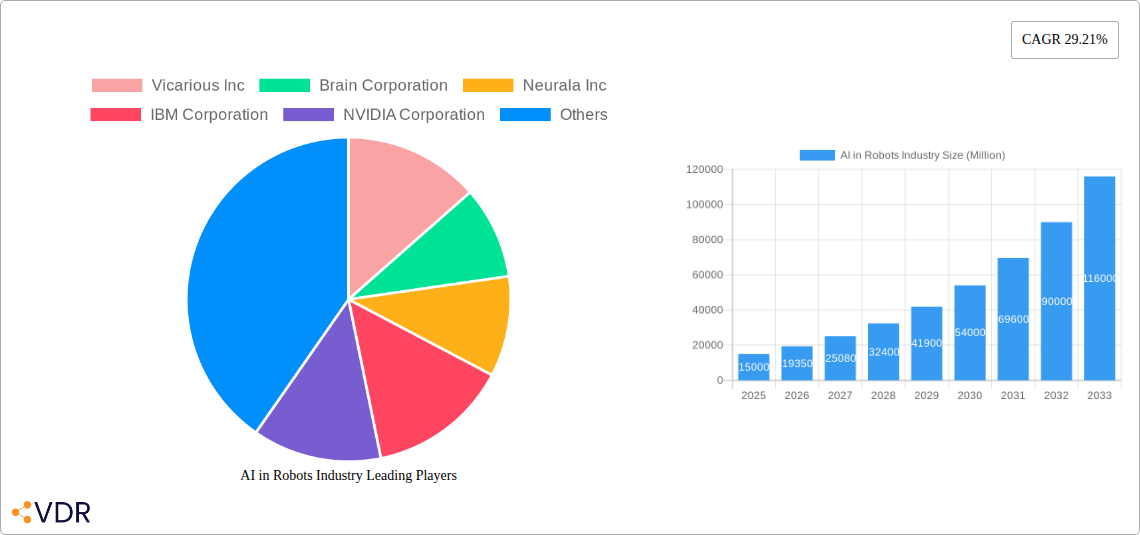
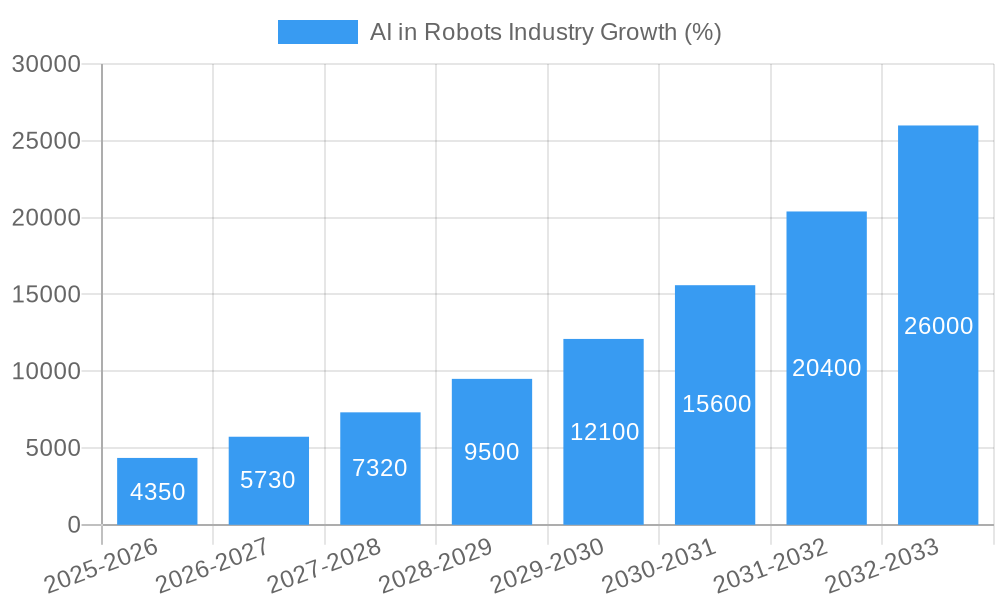
The AI in Robots market is experiencing explosive growth, projected to reach a substantial size with a remarkable Compound Annual Growth Rate (CAGR) of 29.21% from 2025 to 2033. This surge is driven by several key factors. The increasing adoption of automation across various industries, particularly automotive manufacturing, retail, and healthcare, fuels demand for sophisticated robotic systems capable of performing complex tasks with greater efficiency and precision. Advancements in artificial intelligence, including machine learning and deep learning algorithms, are empowering robots with enhanced capabilities such as object recognition, decision-making, and adaptive learning, leading to improved productivity and flexibility. Furthermore, the decreasing cost of AI-powered components and the rising availability of skilled workforce are accelerating market expansion. The market is segmented by robot type (industrial and service robots) and end-user industry, reflecting the diverse applications of AI-powered robotics. While initial investments in AI-powered robotic systems can be significant, the long-term returns on investment, driven by increased efficiency and reduced labor costs, are compelling businesses to adopt this technology.
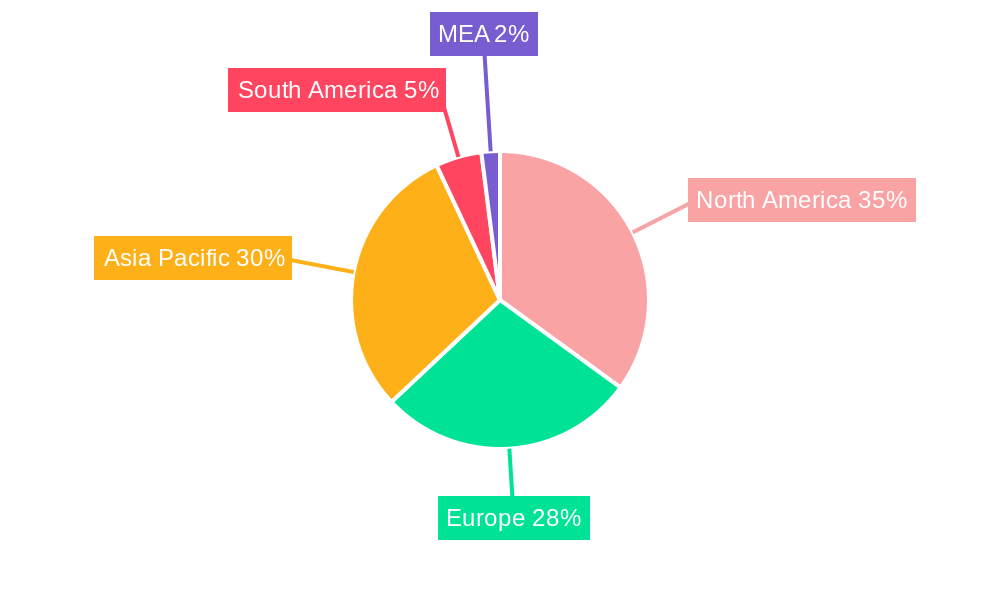
Growth is anticipated across all geographical regions, with North America and Asia Pacific expected to be key contributors. North America's strong technological infrastructure and early adoption of automation technologies contribute significantly to its market share. The Asia-Pacific region, particularly China, Japan, and South Korea, will witness substantial growth driven by increasing industrialization and government initiatives promoting technological advancement. Europe will also see steady expansion, spurred by increasing investments in automation and a focus on smart manufacturing. However, challenges such as regulatory hurdles related to data privacy and safety concerns regarding autonomous robots could potentially restrain market growth. Nevertheless, the ongoing technological advancements and the compelling benefits of AI-powered robots are expected to outweigh these challenges, resulting in sustained and substantial growth throughout the forecast period. The competitive landscape features a mix of established tech giants like IBM and NVIDIA, alongside innovative startups like Vicarious and Neurala, indicating a dynamic and evolving market.
AI in Robots Industry Market Report: 2019-2033
This comprehensive report provides a detailed analysis of the AI in Robots industry, encompassing market dynamics, growth trends, regional insights, product landscapes, and key players. The study period spans from 2019 to 2033, with 2025 serving as the base and estimated year. The report projects a robust expansion of the market, valued at xx Million units in 2025, and forecasts significant growth throughout the forecast period (2025-2033). This in-depth analysis is essential for industry professionals, investors, and anyone seeking a comprehensive understanding of this rapidly evolving sector.
AI in Robots Industry Market Dynamics & Structure
The AI in Robots market exhibits a moderately concentrated structure, with several prominent players holding significant market share. However, the market is dynamic, characterized by continuous technological innovation and a rising number of startups. The regulatory landscape is evolving, with varying regulations across regions impacting adoption rates. Competition from traditional robotic systems represents a significant challenge, while the emergence of new AI-powered solutions presents both opportunities and threats. The industry is witnessing increased mergers and acquisitions (M&A) activity, with larger companies strategically acquiring smaller, innovative firms to expand their capabilities.
- Market Concentration: Moderately concentrated, with top 5 players holding approximately xx% market share in 2025.
- Technological Innovation Drivers: Advancements in machine learning, deep learning, computer vision, and natural language processing.
- Regulatory Frameworks: Varying regulations across regions, impacting adoption and deployment strategies.
- Competitive Product Substitutes: Traditional robots, manual labor.
- End-User Demographics: Expanding across diverse industries, with significant growth in automotive, healthcare, and e-commerce.
- M&A Trends: Increasing M&A activity, driven by strategic acquisitions and technological integrations. xx M&A deals estimated in 2024.
AI in Robots Industry Growth Trends & Insights
The AI in Robots market has experienced substantial growth in recent years, driven by increasing demand for automation, improved efficiency, and the development of sophisticated AI algorithms. The market is expected to maintain a healthy Compound Annual Growth Rate (CAGR) of xx% during the forecast period (2025-2033). This growth is fueled by several factors, including increasing adoption rates across various industries, technological disruptions such as the emergence of collaborative robots (cobots), and evolving consumer behavior that favors automated and personalized solutions. Market penetration is expected to increase from xx% in 2025 to xx% by 2033. Specific market segments show even higher CAGRs; for example, the service robotics segment is projected to grow at xx% CAGR due to increasing demand for automated services in healthcare and retail. The rising integration of AI-powered functionalities such as predictive maintenance and advanced analytics further contributes to the market's expansion.
Dominant Regions, Countries, or Segments in AI in Robots Industry
North America currently holds the largest market share in the AI in Robots industry, driven by substantial investments in research and development, a strong technological infrastructure, and early adoption by major industries such as automotive and healthcare. However, the Asia-Pacific region is expected to witness the fastest growth rate during the forecast period, fueled by rapid industrialization, increasing automation needs, and supportive government policies promoting technological advancement. Within the market segmentation:
By Robot Type: The industrial robots segment currently dominates due to established applications in manufacturing, but the service robots segment demonstrates higher growth potential.
By End-user Industry: The automotive industry is a key driver due to the high demand for automation in manufacturing processes. The healthcare and retail & e-commerce sectors are also showing significant growth.
Key Drivers (North America): Strong R&D investments, advanced technological infrastructure, early adoption by key industries.
Key Drivers (Asia-Pacific): Rapid industrialization, increasing automation needs, supportive government policies.
Key Drivers (Europe): Focus on automation in manufacturing and logistics, investments in robotics research.
AI in Robots Industry Product Landscape
The AI in Robots industry is characterized by a diverse range of products, from sophisticated industrial robots with advanced AI capabilities to simpler service robots performing routine tasks. These robots are designed for various applications, including assembly, welding, material handling (Industrial), customer service, healthcare assistance, and home automation (Service). Key performance metrics include speed, accuracy, payload capacity, and operational efficiency. Many companies are focusing on developing robots with improved dexterity, greater autonomy, and enhanced human-robot interaction capabilities, providing unique selling propositions to differentiate themselves in the competitive market. Advancements in AI algorithms, sensor technologies, and robotic design are driving continuous improvements in robot performance and capabilities.
Key Drivers, Barriers & Challenges in AI in Robots Industry
Key Drivers:
- Increasing demand for automation across various industries.
- Advancements in AI and robotics technologies.
- Government initiatives and funding for robotics research.
- Growing adoption of Industry 4.0 technologies.
Key Challenges & Restraints:
- High initial investment costs for AI-powered robots.
- Concerns about job displacement due to automation.
- Complexity of integrating AI robots into existing systems.
- Cybersecurity vulnerabilities and data privacy concerns. The average cost of a data breach due to compromised robotic systems is estimated at xx million USD in 2025.
Emerging Opportunities in AI in Robots Industry
Emerging opportunities lie in the development of specialized robots for niche applications, such as surgical robots in healthcare, agricultural robots in farming, and delivery robots in logistics. The rise of collaborative robots (cobots) which work alongside humans offer new possibilities. Additionally, the expansion into previously untapped markets, like personal robotics for home assistance, presents further potential for growth. Finally, advancements in AI leading to more personalized and adaptive robotic solutions will greatly increase market appeal.
Growth Accelerators in the AI in Robots Industry
Technological breakthroughs, particularly in areas like computer vision and natural language processing, are critical in enhancing robot capabilities and driving market expansion. Strategic partnerships between AI companies and robotics manufacturers create synergies that lead to more efficient product development and market penetration. Expansion strategies that target emerging markets and the development of specialized solutions for unique industry needs further fuel the overall growth of the AI in Robots Industry.
Key Players Shaping the AI in Robots Industry Market
- Vicarious Inc
- Brain Corporation
- Neurala Inc
- IBM Corporation
- NVIDIA Corporation
- Preferred Networks Inc
- Microsoft Corporation
- Kindred Inc
- Veo Robotics Inc
- Hanson Robotics Ltd
Notable Milestones in AI in Robots Industry Sector
- July 2022: Guardforce AI Co., Limited collaborates with FLAIR to develop RaaS solutions and AI cloud platforms.
- November 2022: Brain Corp announces the development of a next-generation autonomy platform for commercial robots, BrainOS Gen 3.
In-Depth AI in Robots Industry Market Outlook
The future of the AI in Robots market is exceptionally promising. Continuous technological advancements, coupled with increasing industry adoption and strategic collaborations, will propel market growth beyond current projections. The focus on developing more sophisticated, adaptable, and user-friendly robotic solutions will unlock new markets and applications, leading to substantial long-term growth potential. Strategic partnerships and investments in emerging technologies will further define this market's future.
AI in Robots Industry Segmentation
-
1. Robot Type
- 1.1. Industrial Robots
- 1.2. Service Robots
-
2. End-user Industry
- 2.1. Automotive
- 2.2. Retail & E-commerce
- 2.3. Healthcare
- 2.4. Food & Beverage
- 2.5. Other End-user Industries
AI in Robots Industry Segmentation By Geography
- 1. North America
- 2. Europe
- 3. Asia Pacific
- 4. Rest of the World
AI in Robots Industry REPORT HIGHLIGHTS
| Aspects | Details |
|---|---|
| Study Period | 2019-2033 |
| Base Year | 2024 |
| Estimated Year | 2025 |
| Forecast Period | 2025-2033 |
| Historical Period | 2019-2024 |
| Growth Rate | CAGR of 29.21% from 2019-2033 |
| Segmentation |
|
Table of Contents
- 1. Introduction
- 1.1. Research Scope
- 1.2. Market Segmentation
- 1.3. Research Methodology
- 1.4. Definitions and Assumptions
- 2. Executive Summary
- 2.1. Introduction
- 3. Market Dynamics
- 3.1. Introduction
- 3.2. Market Drivers
- 3.2.1. Government Support to Develop Modern Technologies; Higher Adoption Rates of Robots in all End-user Verticals
- 3.3. Market Restrains
- 3.3.1. Reluctance to Adopt New Technologies; Lack of Skilled Workforce
- 3.4. Market Trends
- 3.4.1. Industrial Robots Expected to Grow Significantly
- 4. Market Factor Analysis
- 4.1. Porters Five Forces
- 4.2. Supply/Value Chain
- 4.3. PESTEL analysis
- 4.4. Market Entropy
- 4.5. Patent/Trademark Analysis
- 5. Global AI in Robots Industry Analysis, Insights and Forecast, 2019-2031
- 5.1. Market Analysis, Insights and Forecast - by Robot Type
- 5.1.1. Industrial Robots
- 5.1.2. Service Robots
- 5.2. Market Analysis, Insights and Forecast - by End-user Industry
- 5.2.1. Automotive
- 5.2.2. Retail & E-commerce
- 5.2.3. Healthcare
- 5.2.4. Food & Beverage
- 5.2.5. Other End-user Industries
- 5.3. Market Analysis, Insights and Forecast - by Region
- 5.3.1. North America
- 5.3.2. Europe
- 5.3.3. Asia Pacific
- 5.3.4. Rest of the World
- 5.1. Market Analysis, Insights and Forecast - by Robot Type
- 6. North America AI in Robots Industry Analysis, Insights and Forecast, 2019-2031
- 6.1. Market Analysis, Insights and Forecast - by Robot Type
- 6.1.1. Industrial Robots
- 6.1.2. Service Robots
- 6.2. Market Analysis, Insights and Forecast - by End-user Industry
- 6.2.1. Automotive
- 6.2.2. Retail & E-commerce
- 6.2.3. Healthcare
- 6.2.4. Food & Beverage
- 6.2.5. Other End-user Industries
- 6.1. Market Analysis, Insights and Forecast - by Robot Type
- 7. Europe AI in Robots Industry Analysis, Insights and Forecast, 2019-2031
- 7.1. Market Analysis, Insights and Forecast - by Robot Type
- 7.1.1. Industrial Robots
- 7.1.2. Service Robots
- 7.2. Market Analysis, Insights and Forecast - by End-user Industry
- 7.2.1. Automotive
- 7.2.2. Retail & E-commerce
- 7.2.3. Healthcare
- 7.2.4. Food & Beverage
- 7.2.5. Other End-user Industries
- 7.1. Market Analysis, Insights and Forecast - by Robot Type
- 8. Asia Pacific AI in Robots Industry Analysis, Insights and Forecast, 2019-2031
- 8.1. Market Analysis, Insights and Forecast - by Robot Type
- 8.1.1. Industrial Robots
- 8.1.2. Service Robots
- 8.2. Market Analysis, Insights and Forecast - by End-user Industry
- 8.2.1. Automotive
- 8.2.2. Retail & E-commerce
- 8.2.3. Healthcare
- 8.2.4. Food & Beverage
- 8.2.5. Other End-user Industries
- 8.1. Market Analysis, Insights and Forecast - by Robot Type
- 9. Rest of the World AI in Robots Industry Analysis, Insights and Forecast, 2019-2031
- 9.1. Market Analysis, Insights and Forecast - by Robot Type
- 9.1.1. Industrial Robots
- 9.1.2. Service Robots
- 9.2. Market Analysis, Insights and Forecast - by End-user Industry
- 9.2.1. Automotive
- 9.2.2. Retail & E-commerce
- 9.2.3. Healthcare
- 9.2.4. Food & Beverage
- 9.2.5. Other End-user Industries
- 9.1. Market Analysis, Insights and Forecast - by Robot Type
- 10. North America AI in Robots Industry Analysis, Insights and Forecast, 2019-2031
- 10.1. Market Analysis, Insights and Forecast - By Country/Sub-region
- 10.1.1 United States
- 10.1.2 Canada
- 10.1.3 Mexico
- 11. Europe AI in Robots Industry Analysis, Insights and Forecast, 2019-2031
- 11.1. Market Analysis, Insights and Forecast - By Country/Sub-region
- 11.1.1 Germany
- 11.1.2 United Kingdom
- 11.1.3 France
- 11.1.4 Spain
- 11.1.5 Italy
- 11.1.6 Spain
- 11.1.7 Belgium
- 11.1.8 Netherland
- 11.1.9 Nordics
- 11.1.10 Rest of Europe
- 12. Asia Pacific AI in Robots Industry Analysis, Insights and Forecast, 2019-2031
- 12.1. Market Analysis, Insights and Forecast - By Country/Sub-region
- 12.1.1 China
- 12.1.2 Japan
- 12.1.3 India
- 12.1.4 South Korea
- 12.1.5 Southeast Asia
- 12.1.6 Australia
- 12.1.7 Indonesia
- 12.1.8 Phillipes
- 12.1.9 Singapore
- 12.1.10 Thailandc
- 12.1.11 Rest of Asia Pacific
- 13. South America AI in Robots Industry Analysis, Insights and Forecast, 2019-2031
- 13.1. Market Analysis, Insights and Forecast - By Country/Sub-region
- 13.1.1 Brazil
- 13.1.2 Argentina
- 13.1.3 Peru
- 13.1.4 Chile
- 13.1.5 Colombia
- 13.1.6 Ecuador
- 13.1.7 Venezuela
- 13.1.8 Rest of South America
- 14. North America AI in Robots Industry Analysis, Insights and Forecast, 2019-2031
- 14.1. Market Analysis, Insights and Forecast - By Country/Sub-region
- 14.1.1 United States
- 14.1.2 Canada
- 14.1.3 Mexico
- 15. MEA AI in Robots Industry Analysis, Insights and Forecast, 2019-2031
- 15.1. Market Analysis, Insights and Forecast - By Country/Sub-region
- 15.1.1 United Arab Emirates
- 15.1.2 Saudi Arabia
- 15.1.3 South Africa
- 15.1.4 Rest of Middle East and Africa
- 16. Competitive Analysis
- 16.1. Global Market Share Analysis 2024
- 16.2. Company Profiles
- 16.2.1 Vicarious Inc
- 16.2.1.1. Overview
- 16.2.1.2. Products
- 16.2.1.3. SWOT Analysis
- 16.2.1.4. Recent Developments
- 16.2.1.5. Financials (Based on Availability)
- 16.2.2 Brain Corporation
- 16.2.2.1. Overview
- 16.2.2.2. Products
- 16.2.2.3. SWOT Analysis
- 16.2.2.4. Recent Developments
- 16.2.2.5. Financials (Based on Availability)
- 16.2.3 Neurala Inc
- 16.2.3.1. Overview
- 16.2.3.2. Products
- 16.2.3.3. SWOT Analysis
- 16.2.3.4. Recent Developments
- 16.2.3.5. Financials (Based on Availability)
- 16.2.4 IBM Corporation
- 16.2.4.1. Overview
- 16.2.4.2. Products
- 16.2.4.3. SWOT Analysis
- 16.2.4.4. Recent Developments
- 16.2.4.5. Financials (Based on Availability)
- 16.2.5 NVIDIA Corporation
- 16.2.5.1. Overview
- 16.2.5.2. Products
- 16.2.5.3. SWOT Analysis
- 16.2.5.4. Recent Developments
- 16.2.5.5. Financials (Based on Availability)
- 16.2.6 Preferred Networks Inc *List Not Exhaustive
- 16.2.6.1. Overview
- 16.2.6.2. Products
- 16.2.6.3. SWOT Analysis
- 16.2.6.4. Recent Developments
- 16.2.6.5. Financials (Based on Availability)
- 16.2.7 Microsoft Corporation
- 16.2.7.1. Overview
- 16.2.7.2. Products
- 16.2.7.3. SWOT Analysis
- 16.2.7.4. Recent Developments
- 16.2.7.5. Financials (Based on Availability)
- 16.2.8 Kindred Inc
- 16.2.8.1. Overview
- 16.2.8.2. Products
- 16.2.8.3. SWOT Analysis
- 16.2.8.4. Recent Developments
- 16.2.8.5. Financials (Based on Availability)
- 16.2.9 Veo Robotics Inc
- 16.2.9.1. Overview
- 16.2.9.2. Products
- 16.2.9.3. SWOT Analysis
- 16.2.9.4. Recent Developments
- 16.2.9.5. Financials (Based on Availability)
- 16.2.10 Hanson Robotics Ltd
- 16.2.10.1. Overview
- 16.2.10.2. Products
- 16.2.10.3. SWOT Analysis
- 16.2.10.4. Recent Developments
- 16.2.10.5. Financials (Based on Availability)
- 16.2.1 Vicarious Inc
List of Figures
- Figure 1: Global AI in Robots Industry Revenue Breakdown (Million, %) by Region 2024 & 2032
- Figure 2: North America AI in Robots Industry Revenue (Million), by Country 2024 & 2032
- Figure 3: North America AI in Robots Industry Revenue Share (%), by Country 2024 & 2032
- Figure 4: Europe AI in Robots Industry Revenue (Million), by Country 2024 & 2032
- Figure 5: Europe AI in Robots Industry Revenue Share (%), by Country 2024 & 2032
- Figure 6: Asia Pacific AI in Robots Industry Revenue (Million), by Country 2024 & 2032
- Figure 7: Asia Pacific AI in Robots Industry Revenue Share (%), by Country 2024 & 2032
- Figure 8: South America AI in Robots Industry Revenue (Million), by Country 2024 & 2032
- Figure 9: South America AI in Robots Industry Revenue Share (%), by Country 2024 & 2032
- Figure 10: North America AI in Robots Industry Revenue (Million), by Country 2024 & 2032
- Figure 11: North America AI in Robots Industry Revenue Share (%), by Country 2024 & 2032
- Figure 12: MEA AI in Robots Industry Revenue (Million), by Country 2024 & 2032
- Figure 13: MEA AI in Robots Industry Revenue Share (%), by Country 2024 & 2032
- Figure 14: North America AI in Robots Industry Revenue (Million), by Robot Type 2024 & 2032
- Figure 15: North America AI in Robots Industry Revenue Share (%), by Robot Type 2024 & 2032
- Figure 16: North America AI in Robots Industry Revenue (Million), by End-user Industry 2024 & 2032
- Figure 17: North America AI in Robots Industry Revenue Share (%), by End-user Industry 2024 & 2032
- Figure 18: North America AI in Robots Industry Revenue (Million), by Country 2024 & 2032
- Figure 19: North America AI in Robots Industry Revenue Share (%), by Country 2024 & 2032
- Figure 20: Europe AI in Robots Industry Revenue (Million), by Robot Type 2024 & 2032
- Figure 21: Europe AI in Robots Industry Revenue Share (%), by Robot Type 2024 & 2032
- Figure 22: Europe AI in Robots Industry Revenue (Million), by End-user Industry 2024 & 2032
- Figure 23: Europe AI in Robots Industry Revenue Share (%), by End-user Industry 2024 & 2032
- Figure 24: Europe AI in Robots Industry Revenue (Million), by Country 2024 & 2032
- Figure 25: Europe AI in Robots Industry Revenue Share (%), by Country 2024 & 2032
- Figure 26: Asia Pacific AI in Robots Industry Revenue (Million), by Robot Type 2024 & 2032
- Figure 27: Asia Pacific AI in Robots Industry Revenue Share (%), by Robot Type 2024 & 2032
- Figure 28: Asia Pacific AI in Robots Industry Revenue (Million), by End-user Industry 2024 & 2032
- Figure 29: Asia Pacific AI in Robots Industry Revenue Share (%), by End-user Industry 2024 & 2032
- Figure 30: Asia Pacific AI in Robots Industry Revenue (Million), by Country 2024 & 2032
- Figure 31: Asia Pacific AI in Robots Industry Revenue Share (%), by Country 2024 & 2032
- Figure 32: Rest of the World AI in Robots Industry Revenue (Million), by Robot Type 2024 & 2032
- Figure 33: Rest of the World AI in Robots Industry Revenue Share (%), by Robot Type 2024 & 2032
- Figure 34: Rest of the World AI in Robots Industry Revenue (Million), by End-user Industry 2024 & 2032
- Figure 35: Rest of the World AI in Robots Industry Revenue Share (%), by End-user Industry 2024 & 2032
- Figure 36: Rest of the World AI in Robots Industry Revenue (Million), by Country 2024 & 2032
- Figure 37: Rest of the World AI in Robots Industry Revenue Share (%), by Country 2024 & 2032
List of Tables
- Table 1: Global AI in Robots Industry Revenue Million Forecast, by Region 2019 & 2032
- Table 2: Global AI in Robots Industry Revenue Million Forecast, by Robot Type 2019 & 2032
- Table 3: Global AI in Robots Industry Revenue Million Forecast, by End-user Industry 2019 & 2032
- Table 4: Global AI in Robots Industry Revenue Million Forecast, by Region 2019 & 2032
- Table 5: Global AI in Robots Industry Revenue Million Forecast, by Country 2019 & 2032
- Table 6: United States AI in Robots Industry Revenue (Million) Forecast, by Application 2019 & 2032
- Table 7: Canada AI in Robots Industry Revenue (Million) Forecast, by Application 2019 & 2032
- Table 8: Mexico AI in Robots Industry Revenue (Million) Forecast, by Application 2019 & 2032
- Table 9: Global AI in Robots Industry Revenue Million Forecast, by Country 2019 & 2032
- Table 10: Germany AI in Robots Industry Revenue (Million) Forecast, by Application 2019 & 2032
- Table 11: United Kingdom AI in Robots Industry Revenue (Million) Forecast, by Application 2019 & 2032
- Table 12: France AI in Robots Industry Revenue (Million) Forecast, by Application 2019 & 2032
- Table 13: Spain AI in Robots Industry Revenue (Million) Forecast, by Application 2019 & 2032
- Table 14: Italy AI in Robots Industry Revenue (Million) Forecast, by Application 2019 & 2032
- Table 15: Spain AI in Robots Industry Revenue (Million) Forecast, by Application 2019 & 2032
- Table 16: Belgium AI in Robots Industry Revenue (Million) Forecast, by Application 2019 & 2032
- Table 17: Netherland AI in Robots Industry Revenue (Million) Forecast, by Application 2019 & 2032
- Table 18: Nordics AI in Robots Industry Revenue (Million) Forecast, by Application 2019 & 2032
- Table 19: Rest of Europe AI in Robots Industry Revenue (Million) Forecast, by Application 2019 & 2032
- Table 20: Global AI in Robots Industry Revenue Million Forecast, by Country 2019 & 2032
- Table 21: China AI in Robots Industry Revenue (Million) Forecast, by Application 2019 & 2032
- Table 22: Japan AI in Robots Industry Revenue (Million) Forecast, by Application 2019 & 2032
- Table 23: India AI in Robots Industry Revenue (Million) Forecast, by Application 2019 & 2032
- Table 24: South Korea AI in Robots Industry Revenue (Million) Forecast, by Application 2019 & 2032
- Table 25: Southeast Asia AI in Robots Industry Revenue (Million) Forecast, by Application 2019 & 2032
- Table 26: Australia AI in Robots Industry Revenue (Million) Forecast, by Application 2019 & 2032
- Table 27: Indonesia AI in Robots Industry Revenue (Million) Forecast, by Application 2019 & 2032
- Table 28: Phillipes AI in Robots Industry Revenue (Million) Forecast, by Application 2019 & 2032
- Table 29: Singapore AI in Robots Industry Revenue (Million) Forecast, by Application 2019 & 2032
- Table 30: Thailandc AI in Robots Industry Revenue (Million) Forecast, by Application 2019 & 2032
- Table 31: Rest of Asia Pacific AI in Robots Industry Revenue (Million) Forecast, by Application 2019 & 2032
- Table 32: Global AI in Robots Industry Revenue Million Forecast, by Country 2019 & 2032
- Table 33: Brazil AI in Robots Industry Revenue (Million) Forecast, by Application 2019 & 2032
- Table 34: Argentina AI in Robots Industry Revenue (Million) Forecast, by Application 2019 & 2032
- Table 35: Peru AI in Robots Industry Revenue (Million) Forecast, by Application 2019 & 2032
- Table 36: Chile AI in Robots Industry Revenue (Million) Forecast, by Application 2019 & 2032
- Table 37: Colombia AI in Robots Industry Revenue (Million) Forecast, by Application 2019 & 2032
- Table 38: Ecuador AI in Robots Industry Revenue (Million) Forecast, by Application 2019 & 2032
- Table 39: Venezuela AI in Robots Industry Revenue (Million) Forecast, by Application 2019 & 2032
- Table 40: Rest of South America AI in Robots Industry Revenue (Million) Forecast, by Application 2019 & 2032
- Table 41: Global AI in Robots Industry Revenue Million Forecast, by Country 2019 & 2032
- Table 42: United States AI in Robots Industry Revenue (Million) Forecast, by Application 2019 & 2032
- Table 43: Canada AI in Robots Industry Revenue (Million) Forecast, by Application 2019 & 2032
- Table 44: Mexico AI in Robots Industry Revenue (Million) Forecast, by Application 2019 & 2032
- Table 45: Global AI in Robots Industry Revenue Million Forecast, by Country 2019 & 2032
- Table 46: United Arab Emirates AI in Robots Industry Revenue (Million) Forecast, by Application 2019 & 2032
- Table 47: Saudi Arabia AI in Robots Industry Revenue (Million) Forecast, by Application 2019 & 2032
- Table 48: South Africa AI in Robots Industry Revenue (Million) Forecast, by Application 2019 & 2032
- Table 49: Rest of Middle East and Africa AI in Robots Industry Revenue (Million) Forecast, by Application 2019 & 2032
- Table 50: Global AI in Robots Industry Revenue Million Forecast, by Robot Type 2019 & 2032
- Table 51: Global AI in Robots Industry Revenue Million Forecast, by End-user Industry 2019 & 2032
- Table 52: Global AI in Robots Industry Revenue Million Forecast, by Country 2019 & 2032
- Table 53: Global AI in Robots Industry Revenue Million Forecast, by Robot Type 2019 & 2032
- Table 54: Global AI in Robots Industry Revenue Million Forecast, by End-user Industry 2019 & 2032
- Table 55: Global AI in Robots Industry Revenue Million Forecast, by Country 2019 & 2032
- Table 56: Global AI in Robots Industry Revenue Million Forecast, by Robot Type 2019 & 2032
- Table 57: Global AI in Robots Industry Revenue Million Forecast, by End-user Industry 2019 & 2032
- Table 58: Global AI in Robots Industry Revenue Million Forecast, by Country 2019 & 2032
- Table 59: Global AI in Robots Industry Revenue Million Forecast, by Robot Type 2019 & 2032
- Table 60: Global AI in Robots Industry Revenue Million Forecast, by End-user Industry 2019 & 2032
- Table 61: Global AI in Robots Industry Revenue Million Forecast, by Country 2019 & 2032
Frequently Asked Questions
1. What is the projected Compound Annual Growth Rate (CAGR) of the AI in Robots Industry?
The projected CAGR is approximately 29.21%.
2. Which companies are prominent players in the AI in Robots Industry?
Key companies in the market include Vicarious Inc, Brain Corporation, Neurala Inc, IBM Corporation, NVIDIA Corporation, Preferred Networks Inc *List Not Exhaustive, Microsoft Corporation, Kindred Inc, Veo Robotics Inc, Hanson Robotics Ltd.
3. What are the main segments of the AI in Robots Industry?
The market segments include Robot Type, End-user Industry.
4. Can you provide details about the market size?
The market size is estimated to be USD XX Million as of 2022.
5. What are some drivers contributing to market growth?
Government Support to Develop Modern Technologies; Higher Adoption Rates of Robots in all End-user Verticals.
6. What are the notable trends driving market growth?
Industrial Robots Expected to Grow Significantly.
7. Are there any restraints impacting market growth?
Reluctance to Adopt New Technologies; Lack of Skilled Workforce.
8. Can you provide examples of recent developments in the market?
July 2022: In order to develop robotics-as-a-service (RaaS) solutions and artificial intelligence (AI) cloud platforms globally, Guardforce AI Co., Limited, a provider of integrated security solutions, has announced a collaboration agreement with Hong Kong Industrial Artificial Intelligence and Robotics Centre Limited (FLAIR), founded by the Hong Kong Productivity Council (HKPC) with RWTH Aachen Campus in Germany as its major collaborator. In accordance with the agreement, Guardforce AI will have initial, two-year access to FLAIR technology and know-how beginning in August 2022.
9. What pricing options are available for accessing the report?
Pricing options include single-user, multi-user, and enterprise licenses priced at USD 4750, USD 5250, and USD 8750 respectively.
10. Is the market size provided in terms of value or volume?
The market size is provided in terms of value, measured in Million.
11. Are there any specific market keywords associated with the report?
Yes, the market keyword associated with the report is "AI in Robots Industry," which aids in identifying and referencing the specific market segment covered.
12. How do I determine which pricing option suits my needs best?
The pricing options vary based on user requirements and access needs. Individual users may opt for single-user licenses, while businesses requiring broader access may choose multi-user or enterprise licenses for cost-effective access to the report.
13. Are there any additional resources or data provided in the AI in Robots Industry report?
While the report offers comprehensive insights, it's advisable to review the specific contents or supplementary materials provided to ascertain if additional resources or data are available.
14. How can I stay updated on further developments or reports in the AI in Robots Industry?
To stay informed about further developments, trends, and reports in the AI in Robots Industry, consider subscribing to industry newsletters, following relevant companies and organizations, or regularly checking reputable industry news sources and publications.
Methodology
Step 1 - Identification of Relevant Samples Size from Population Database


Step 2 - Approaches for Defining Global Market Size (Value, Volume* & Price*)

Note*: In applicable scenarios
Step 3 - Data Sources
Primary Research
- Web Analytics
- Survey Reports
- Research Institute
- Latest Research Reports
- Opinion Leaders
Secondary Research
- Annual Reports
- White Paper
- Latest Press Release
- Industry Association
- Paid Database
- Investor Presentations

Step 4 - Data Triangulation
Involves using different sources of information in order to increase the validity of a study
These sources are likely to be stakeholders in a program - participants, other researchers, program staff, other community members, and so on.
Then we put all data in single framework & apply various statistical tools to find out the dynamic on the market.
During the analysis stage, feedback from the stakeholder groups would be compared to determine areas of agreement as well as areas of divergence


