
Key Insights
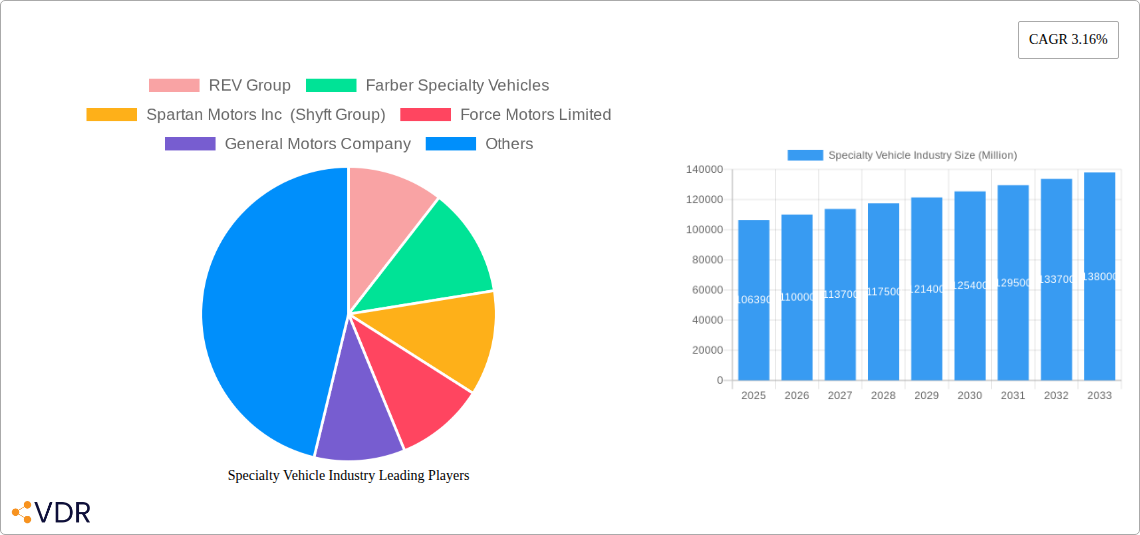
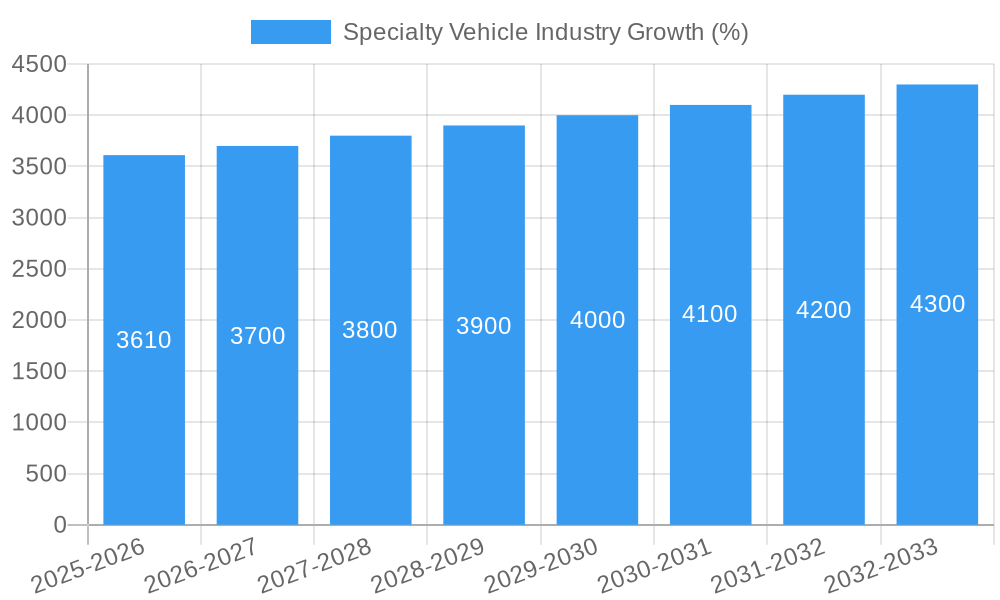
The specialty vehicle market, valued at $106.39 billion in 2025, is projected to experience steady growth, driven by increasing demand for emergency response vehicles, rising investments in public safety infrastructure, and the expansion of the healthcare sector. The 3.16% CAGR suggests a robust, albeit moderate, expansion over the forecast period (2025-2033). Key segments driving this growth include ambulances, fire extinguishing trucks, and mobile fuel tankers, fueled by government regulations and rising urbanization. The law enforcement and public safety application segment is expected to dominate, reflecting the continuous need for advanced and reliable vehicles in maintaining public order and responding to emergencies. Geographic distribution shows significant market presence in North America and Europe, though the Asia-Pacific region is poised for significant growth due to rapid infrastructure development and economic expansion in countries like China and India. Competitive dynamics are shaped by established players like REV Group, Oshkosh Corporation, and Daimler AG, alongside smaller specialized manufacturers. While technological advancements, such as the integration of advanced telematics and safety features, are driving innovation, potential market restraints include supply chain disruptions, fluctuating raw material costs, and stringent emission regulations.
Over the next decade, the specialty vehicle market is anticipated to witness a shift towards sustainable and technologically advanced vehicles. Manufacturers are increasingly focusing on electric and hybrid powertrains to reduce emissions and improve fuel efficiency, aligning with global environmental regulations. Furthermore, advancements in vehicle safety features, such as advanced driver-assistance systems (ADAS) and collision avoidance technologies, are becoming increasingly crucial in enhancing operational safety and minimizing risks. The market will likely see a further consolidation as larger players acquire smaller companies, leading to increased economies of scale and enhanced market share. The integration of data analytics and IoT capabilities is also expected to transform fleet management and operational efficiency for specialty vehicle operators.
Specialty Vehicle Industry Market Report: 2019-2033
This comprehensive report provides an in-depth analysis of the global specialty vehicle market, encompassing market dynamics, growth trends, regional dominance, product landscape, key players, and future outlook. The report covers the period from 2019 to 2033, with a focus on the forecast period of 2025-2033 and a base year of 2025. This invaluable resource is designed for industry professionals, investors, and researchers seeking to understand and capitalize on the opportunities within this dynamic sector. The market is segmented by Type (Ambulances, Fire Extinguishing Trucks, Mobile Fuel Carrying Tankers, Other Types) and Application Type (Law Enforcement and Public Safety, Medical and Healthcare, Recreational Vehicles, Other Services).
Specialty Vehicle Industry Market Dynamics & Structure
The specialty vehicle market is characterized by a moderately concentrated landscape with key players like REV Group, Daimler AG, and Oshkosh Corporation holding significant market share. Technological innovation, particularly in areas like electrification and autonomous driving, is a major driver, alongside stringent regulatory frameworks concerning safety and emissions. The market also faces competition from substitutes, including general-purpose vehicles adapted for specialized use. End-user demographics, such as aging populations and increasing urbanization, influence demand patterns. M&A activity has been moderate (xx million units in deals from 2019-2024), driven by strategic expansion and technology acquisition.
- Market Concentration: Moderately concentrated, with top 5 players holding xx% market share in 2024.
- Technological Innovation: Electrification, autonomous features, and advanced safety systems are key drivers.
- Regulatory Frameworks: Stringent safety and emission standards influence vehicle design and production.
- Competitive Substitutes: General-purpose vehicles adapted for specialized use pose competition.
- End-User Demographics: Aging populations and urbanization drive demand in specific segments (e.g., ambulances).
- M&A Trends: Moderate activity (xx million units in deal volume from 2019-2024), focused on technology and market expansion.
Specialty Vehicle Industry Growth Trends & Insights
The global specialty vehicle market experienced robust growth during the historical period (2019-2024), with a CAGR of xx%. This growth is attributed to increasing demand across various application segments, particularly in the medical and healthcare sector. The market size in 2024 reached xx million units. Technological advancements, such as the adoption of electric and alternative fuel vehicles, are reshaping the industry. Consumer behavior shifts towards enhanced safety, sustainability, and technological integration further fuel market expansion. The forecast period (2025-2033) projects continued growth, driven by expanding infrastructure, favorable government policies, and rising disposable incomes in emerging economies. The projected CAGR for 2025-2033 is xx%, leading to a market size of xx million units by 2033. Market penetration of electric specialty vehicles is expected to increase from xx% in 2024 to xx% by 2033.
Dominant Regions, Countries, or Segments in Specialty Vehicle Industry
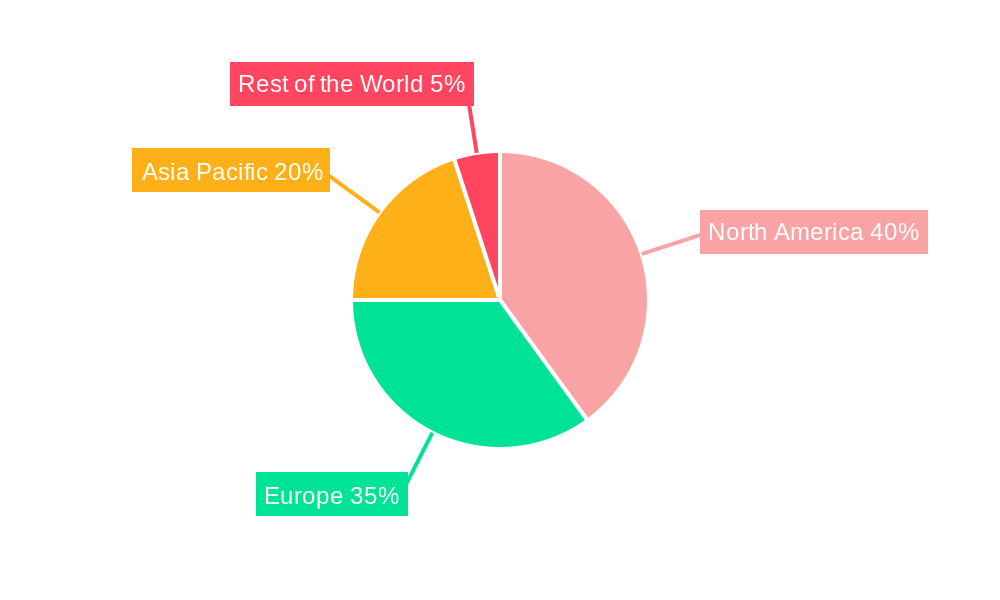
North America currently dominates the global specialty vehicle market, driven by strong demand for ambulances and fire extinguishing trucks, alongside robust infrastructure spending and a relatively high per capita income. Within North America, the United States holds the largest market share. Europe follows as a major market, primarily due to high adoption in the public safety sector and favorable government regulations. The Asia-Pacific region is experiencing significant growth, propelled by infrastructure development, increasing urbanization, and government initiatives promoting vehicle modernization.
- North America: Strong demand, robust infrastructure, high per capita income.
- Europe: High public safety adoption, favorable regulations.
- Asia-Pacific: Infrastructure development, urbanization, government initiatives.
- Segment Dominance: Ambulances and fire extinguishing trucks represent the largest segments by type. The medical and healthcare segment leads in application type.
Specialty Vehicle Industry Product Landscape
The specialty vehicle market showcases a diverse range of products tailored to specific applications, incorporating advanced features such as improved safety systems, enhanced fuel efficiency, and advanced telematics. Technological advancements are continuously enhancing vehicle performance, reliability, and safety. Unique selling propositions include specialized equipment integration, customized designs, and robust build quality to meet demanding operational needs. Innovations such as electric powertrains and autonomous driving capabilities are gaining traction.
Key Drivers, Barriers & Challenges in Specialty Vehicle Industry
Key Drivers:
- Increasing government spending on public safety and healthcare infrastructure.
- Growing demand for specialized vehicles in emerging economies.
- Technological advancements leading to enhanced safety and efficiency.
Challenges and Restraints:
- High initial investment costs associated with new technologies.
- Stringent emission regulations impacting manufacturing costs.
- Supply chain disruptions impacting production and delivery timelines. The impact of these disruptions was estimated at xx million units lost in 2022.
Emerging Opportunities in Specialty Vehicle Industry
- Untapped markets: Expansion into developing economies with growing infrastructure needs.
- Innovative applications: Development of specialized vehicles for disaster relief and emergency response.
- Evolving consumer preferences: Increased demand for electric and eco-friendly vehicles.
Growth Accelerators in the Specialty Vehicle Industry Industry
Technological breakthroughs in areas like electrification and automation are crucial growth catalysts. Strategic partnerships between vehicle manufacturers and technology providers are fostering innovation. Expansion into new markets and diversification into new application segments are further accelerating growth.
Key Players Shaping the Specialty Vehicle Industry Market
- REV Group
- Farber Specialty Vehicles
- Spartan Motors Inc (Shyft Group)
- Force Motors Limited
- General Motors Company
- Specialty Vehicles Inc
- Daimler AG
- Volvo Group
- Emergency One Group
- Matthews Specialty Vehicles Inc
- LDV Inc
- Oshkosh Corporation
Notable Milestones in Specialty Vehicle Industry Sector
- June 2022: Minsk Automobile Plant (MAZ) launched the MAZ minibus line, including the MAZ-365022, adaptable for ambulance use. This expands the range of available chassis for specialty vehicle conversions.
- March 2021: Mercedes-Benz Vans electrified its ambulance vehicles using the eSprinter, showcasing the industry shift towards sustainable solutions.
- March 2021: Falck's master agreement with MAN Truck & Bus strengthens the collaboration for ambulance and patient transport, indicating growing partnerships within the sector.
In-Depth Specialty Vehicle Industry Market Outlook
The specialty vehicle market is poised for continued growth, driven by technological advancements, expanding infrastructure, and increasing demand from diverse sectors. Strategic partnerships and investments in research and development will further shape the market landscape. Opportunities exist in developing sustainable and technologically advanced vehicles to meet the evolving needs of end-users. The market's future growth trajectory promises significant potential for players who can adapt to technological shifts and cater to diverse customer needs.
Specialty Vehicle Industry Segmentation
-
1. Type
- 1.1. Ambulances
- 1.2. Fire Extinguishing Trucks
- 1.3. Mobile Fuel Carrying Tankers
- 1.4. Other Types
-
2. Application Type
- 2.1. Law Enforcement And Public Safety
- 2.2. Medical And Healthcare
- 2.3. Recreational Vehicles
- 2.4. Other Services
Specialty Vehicle Industry Segmentation By Geography
-
1. North America
- 1.1. United States
- 1.2. Canada
- 1.3. Rest of North America
-
2. Europe
- 2.1. Germany
- 2.2. United Kingdom
- 2.3. France
- 2.4. Rest of Europe
-
3. Asia Pacific
- 3.1. China
- 3.2. India
- 3.3. Japan
- 3.4. South Korea
- 3.5. Rest of Asia Pacific
-
4. Rest of the World
- 4.1. South America
- 4.2. Middle East and Africa
Specialty Vehicle Industry REPORT HIGHLIGHTS
| Aspects | Details |
|---|---|
| Study Period | 2019-2033 |
| Base Year | 2024 |
| Estimated Year | 2025 |
| Forecast Period | 2025-2033 |
| Historical Period | 2019-2024 |
| Growth Rate | CAGR of 3.16% from 2019-2033 |
| Segmentation |
|
Table of Contents
- 1. Introduction
- 1.1. Research Scope
- 1.2. Market Segmentation
- 1.3. Research Methodology
- 1.4. Definitions and Assumptions
- 2. Executive Summary
- 2.1. Introduction
- 3. Market Dynamics
- 3.1. Introduction
- 3.2. Market Drivers
- 3.2.1. Rise in demand for Advanced Comfort Systems In Vehicles
- 3.3. Market Restrains
- 3.3.1. High Cost Assoicated with Advanced Features
- 3.4. Market Trends
- 3.4.1. Increase in Spending on Law Enforcement and Healthcare Facilities
- 4. Market Factor Analysis
- 4.1. Porters Five Forces
- 4.2. Supply/Value Chain
- 4.3. PESTEL analysis
- 4.4. Market Entropy
- 4.5. Patent/Trademark Analysis
- 5. Global Specialty Vehicle Industry Analysis, Insights and Forecast, 2019-2031
- 5.1. Market Analysis, Insights and Forecast - by Type
- 5.1.1. Ambulances
- 5.1.2. Fire Extinguishing Trucks
- 5.1.3. Mobile Fuel Carrying Tankers
- 5.1.4. Other Types
- 5.2. Market Analysis, Insights and Forecast - by Application Type
- 5.2.1. Law Enforcement And Public Safety
- 5.2.2. Medical And Healthcare
- 5.2.3. Recreational Vehicles
- 5.2.4. Other Services
- 5.3. Market Analysis, Insights and Forecast - by Region
- 5.3.1. North America
- 5.3.2. Europe
- 5.3.3. Asia Pacific
- 5.3.4. Rest of the World
- 5.1. Market Analysis, Insights and Forecast - by Type
- 6. North America Specialty Vehicle Industry Analysis, Insights and Forecast, 2019-2031
- 6.1. Market Analysis, Insights and Forecast - by Type
- 6.1.1. Ambulances
- 6.1.2. Fire Extinguishing Trucks
- 6.1.3. Mobile Fuel Carrying Tankers
- 6.1.4. Other Types
- 6.2. Market Analysis, Insights and Forecast - by Application Type
- 6.2.1. Law Enforcement And Public Safety
- 6.2.2. Medical And Healthcare
- 6.2.3. Recreational Vehicles
- 6.2.4. Other Services
- 6.1. Market Analysis, Insights and Forecast - by Type
- 7. Europe Specialty Vehicle Industry Analysis, Insights and Forecast, 2019-2031
- 7.1. Market Analysis, Insights and Forecast - by Type
- 7.1.1. Ambulances
- 7.1.2. Fire Extinguishing Trucks
- 7.1.3. Mobile Fuel Carrying Tankers
- 7.1.4. Other Types
- 7.2. Market Analysis, Insights and Forecast - by Application Type
- 7.2.1. Law Enforcement And Public Safety
- 7.2.2. Medical And Healthcare
- 7.2.3. Recreational Vehicles
- 7.2.4. Other Services
- 7.1. Market Analysis, Insights and Forecast - by Type
- 8. Asia Pacific Specialty Vehicle Industry Analysis, Insights and Forecast, 2019-2031
- 8.1. Market Analysis, Insights and Forecast - by Type
- 8.1.1. Ambulances
- 8.1.2. Fire Extinguishing Trucks
- 8.1.3. Mobile Fuel Carrying Tankers
- 8.1.4. Other Types
- 8.2. Market Analysis, Insights and Forecast - by Application Type
- 8.2.1. Law Enforcement And Public Safety
- 8.2.2. Medical And Healthcare
- 8.2.3. Recreational Vehicles
- 8.2.4. Other Services
- 8.1. Market Analysis, Insights and Forecast - by Type
- 9. Rest of the World Specialty Vehicle Industry Analysis, Insights and Forecast, 2019-2031
- 9.1. Market Analysis, Insights and Forecast - by Type
- 9.1.1. Ambulances
- 9.1.2. Fire Extinguishing Trucks
- 9.1.3. Mobile Fuel Carrying Tankers
- 9.1.4. Other Types
- 9.2. Market Analysis, Insights and Forecast - by Application Type
- 9.2.1. Law Enforcement And Public Safety
- 9.2.2. Medical And Healthcare
- 9.2.3. Recreational Vehicles
- 9.2.4. Other Services
- 9.1. Market Analysis, Insights and Forecast - by Type
- 10. North America Specialty Vehicle Industry Analysis, Insights and Forecast, 2019-2031
- 10.1. Market Analysis, Insights and Forecast - By Country/Sub-region
- 10.1.1 United States
- 10.1.2 Canada
- 10.1.3 Rest of North America
- 11. Europe Specialty Vehicle Industry Analysis, Insights and Forecast, 2019-2031
- 11.1. Market Analysis, Insights and Forecast - By Country/Sub-region
- 11.1.1 Germany
- 11.1.2 United Kingdom
- 11.1.3 France
- 11.1.4 Rest of Europe
- 12. Asia Pacific Specialty Vehicle Industry Analysis, Insights and Forecast, 2019-2031
- 12.1. Market Analysis, Insights and Forecast - By Country/Sub-region
- 12.1.1 China
- 12.1.2 India
- 12.1.3 Japan
- 12.1.4 South Korea
- 12.1.5 Rest of Asia Pacific
- 13. Rest of the World Specialty Vehicle Industry Analysis, Insights and Forecast, 2019-2031
- 13.1. Market Analysis, Insights and Forecast - By Country/Sub-region
- 13.1.1 South America
- 13.1.2 Middle East and Africa
- 14. Competitive Analysis
- 14.1. Global Market Share Analysis 2024
- 14.2. Company Profiles
- 14.2.1 REV Group
- 14.2.1.1. Overview
- 14.2.1.2. Products
- 14.2.1.3. SWOT Analysis
- 14.2.1.4. Recent Developments
- 14.2.1.5. Financials (Based on Availability)
- 14.2.2 Farber Specialty Vehicles
- 14.2.2.1. Overview
- 14.2.2.2. Products
- 14.2.2.3. SWOT Analysis
- 14.2.2.4. Recent Developments
- 14.2.2.5. Financials (Based on Availability)
- 14.2.3 Spartan Motors Inc (Shyft Group)
- 14.2.3.1. Overview
- 14.2.3.2. Products
- 14.2.3.3. SWOT Analysis
- 14.2.3.4. Recent Developments
- 14.2.3.5. Financials (Based on Availability)
- 14.2.4 Force Motors Limited
- 14.2.4.1. Overview
- 14.2.4.2. Products
- 14.2.4.3. SWOT Analysis
- 14.2.4.4. Recent Developments
- 14.2.4.5. Financials (Based on Availability)
- 14.2.5 General Motors Company
- 14.2.5.1. Overview
- 14.2.5.2. Products
- 14.2.5.3. SWOT Analysis
- 14.2.5.4. Recent Developments
- 14.2.5.5. Financials (Based on Availability)
- 14.2.6 Specialty Vehicles Inc
- 14.2.6.1. Overview
- 14.2.6.2. Products
- 14.2.6.3. SWOT Analysis
- 14.2.6.4. Recent Developments
- 14.2.6.5. Financials (Based on Availability)
- 14.2.7 Daimler AG
- 14.2.7.1. Overview
- 14.2.7.2. Products
- 14.2.7.3. SWOT Analysis
- 14.2.7.4. Recent Developments
- 14.2.7.5. Financials (Based on Availability)
- 14.2.8 Volvo Group
- 14.2.8.1. Overview
- 14.2.8.2. Products
- 14.2.8.3. SWOT Analysis
- 14.2.8.4. Recent Developments
- 14.2.8.5. Financials (Based on Availability)
- 14.2.9 Emergency One Group
- 14.2.9.1. Overview
- 14.2.9.2. Products
- 14.2.9.3. SWOT Analysis
- 14.2.9.4. Recent Developments
- 14.2.9.5. Financials (Based on Availability)
- 14.2.10 Matthews Specialty Vehicles Inc
- 14.2.10.1. Overview
- 14.2.10.2. Products
- 14.2.10.3. SWOT Analysis
- 14.2.10.4. Recent Developments
- 14.2.10.5. Financials (Based on Availability)
- 14.2.11 LDV Inc
- 14.2.11.1. Overview
- 14.2.11.2. Products
- 14.2.11.3. SWOT Analysis
- 14.2.11.4. Recent Developments
- 14.2.11.5. Financials (Based on Availability)
- 14.2.12 Oshkosh Corporatio
- 14.2.12.1. Overview
- 14.2.12.2. Products
- 14.2.12.3. SWOT Analysis
- 14.2.12.4. Recent Developments
- 14.2.12.5. Financials (Based on Availability)
- 14.2.1 REV Group
List of Figures
- Figure 1: Global Specialty Vehicle Industry Revenue Breakdown (Million, %) by Region 2024 & 2032
- Figure 2: North America Specialty Vehicle Industry Revenue (Million), by Country 2024 & 2032
- Figure 3: North America Specialty Vehicle Industry Revenue Share (%), by Country 2024 & 2032
- Figure 4: Europe Specialty Vehicle Industry Revenue (Million), by Country 2024 & 2032
- Figure 5: Europe Specialty Vehicle Industry Revenue Share (%), by Country 2024 & 2032
- Figure 6: Asia Pacific Specialty Vehicle Industry Revenue (Million), by Country 2024 & 2032
- Figure 7: Asia Pacific Specialty Vehicle Industry Revenue Share (%), by Country 2024 & 2032
- Figure 8: Rest of the World Specialty Vehicle Industry Revenue (Million), by Country 2024 & 2032
- Figure 9: Rest of the World Specialty Vehicle Industry Revenue Share (%), by Country 2024 & 2032
- Figure 10: North America Specialty Vehicle Industry Revenue (Million), by Type 2024 & 2032
- Figure 11: North America Specialty Vehicle Industry Revenue Share (%), by Type 2024 & 2032
- Figure 12: North America Specialty Vehicle Industry Revenue (Million), by Application Type 2024 & 2032
- Figure 13: North America Specialty Vehicle Industry Revenue Share (%), by Application Type 2024 & 2032
- Figure 14: North America Specialty Vehicle Industry Revenue (Million), by Country 2024 & 2032
- Figure 15: North America Specialty Vehicle Industry Revenue Share (%), by Country 2024 & 2032
- Figure 16: Europe Specialty Vehicle Industry Revenue (Million), by Type 2024 & 2032
- Figure 17: Europe Specialty Vehicle Industry Revenue Share (%), by Type 2024 & 2032
- Figure 18: Europe Specialty Vehicle Industry Revenue (Million), by Application Type 2024 & 2032
- Figure 19: Europe Specialty Vehicle Industry Revenue Share (%), by Application Type 2024 & 2032
- Figure 20: Europe Specialty Vehicle Industry Revenue (Million), by Country 2024 & 2032
- Figure 21: Europe Specialty Vehicle Industry Revenue Share (%), by Country 2024 & 2032
- Figure 22: Asia Pacific Specialty Vehicle Industry Revenue (Million), by Type 2024 & 2032
- Figure 23: Asia Pacific Specialty Vehicle Industry Revenue Share (%), by Type 2024 & 2032
- Figure 24: Asia Pacific Specialty Vehicle Industry Revenue (Million), by Application Type 2024 & 2032
- Figure 25: Asia Pacific Specialty Vehicle Industry Revenue Share (%), by Application Type 2024 & 2032
- Figure 26: Asia Pacific Specialty Vehicle Industry Revenue (Million), by Country 2024 & 2032
- Figure 27: Asia Pacific Specialty Vehicle Industry Revenue Share (%), by Country 2024 & 2032
- Figure 28: Rest of the World Specialty Vehicle Industry Revenue (Million), by Type 2024 & 2032
- Figure 29: Rest of the World Specialty Vehicle Industry Revenue Share (%), by Type 2024 & 2032
- Figure 30: Rest of the World Specialty Vehicle Industry Revenue (Million), by Application Type 2024 & 2032
- Figure 31: Rest of the World Specialty Vehicle Industry Revenue Share (%), by Application Type 2024 & 2032
- Figure 32: Rest of the World Specialty Vehicle Industry Revenue (Million), by Country 2024 & 2032
- Figure 33: Rest of the World Specialty Vehicle Industry Revenue Share (%), by Country 2024 & 2032
List of Tables
- Table 1: Global Specialty Vehicle Industry Revenue Million Forecast, by Region 2019 & 2032
- Table 2: Global Specialty Vehicle Industry Revenue Million Forecast, by Type 2019 & 2032
- Table 3: Global Specialty Vehicle Industry Revenue Million Forecast, by Application Type 2019 & 2032
- Table 4: Global Specialty Vehicle Industry Revenue Million Forecast, by Region 2019 & 2032
- Table 5: Global Specialty Vehicle Industry Revenue Million Forecast, by Country 2019 & 2032
- Table 6: United States Specialty Vehicle Industry Revenue (Million) Forecast, by Application 2019 & 2032
- Table 7: Canada Specialty Vehicle Industry Revenue (Million) Forecast, by Application 2019 & 2032
- Table 8: Rest of North America Specialty Vehicle Industry Revenue (Million) Forecast, by Application 2019 & 2032
- Table 9: Global Specialty Vehicle Industry Revenue Million Forecast, by Country 2019 & 2032
- Table 10: Germany Specialty Vehicle Industry Revenue (Million) Forecast, by Application 2019 & 2032
- Table 11: United Kingdom Specialty Vehicle Industry Revenue (Million) Forecast, by Application 2019 & 2032
- Table 12: France Specialty Vehicle Industry Revenue (Million) Forecast, by Application 2019 & 2032
- Table 13: Rest of Europe Specialty Vehicle Industry Revenue (Million) Forecast, by Application 2019 & 2032
- Table 14: Global Specialty Vehicle Industry Revenue Million Forecast, by Country 2019 & 2032
- Table 15: China Specialty Vehicle Industry Revenue (Million) Forecast, by Application 2019 & 2032
- Table 16: India Specialty Vehicle Industry Revenue (Million) Forecast, by Application 2019 & 2032
- Table 17: Japan Specialty Vehicle Industry Revenue (Million) Forecast, by Application 2019 & 2032
- Table 18: South Korea Specialty Vehicle Industry Revenue (Million) Forecast, by Application 2019 & 2032
- Table 19: Rest of Asia Pacific Specialty Vehicle Industry Revenue (Million) Forecast, by Application 2019 & 2032
- Table 20: Global Specialty Vehicle Industry Revenue Million Forecast, by Country 2019 & 2032
- Table 21: South America Specialty Vehicle Industry Revenue (Million) Forecast, by Application 2019 & 2032
- Table 22: Middle East and Africa Specialty Vehicle Industry Revenue (Million) Forecast, by Application 2019 & 2032
- Table 23: Global Specialty Vehicle Industry Revenue Million Forecast, by Type 2019 & 2032
- Table 24: Global Specialty Vehicle Industry Revenue Million Forecast, by Application Type 2019 & 2032
- Table 25: Global Specialty Vehicle Industry Revenue Million Forecast, by Country 2019 & 2032
- Table 26: United States Specialty Vehicle Industry Revenue (Million) Forecast, by Application 2019 & 2032
- Table 27: Canada Specialty Vehicle Industry Revenue (Million) Forecast, by Application 2019 & 2032
- Table 28: Rest of North America Specialty Vehicle Industry Revenue (Million) Forecast, by Application 2019 & 2032
- Table 29: Global Specialty Vehicle Industry Revenue Million Forecast, by Type 2019 & 2032
- Table 30: Global Specialty Vehicle Industry Revenue Million Forecast, by Application Type 2019 & 2032
- Table 31: Global Specialty Vehicle Industry Revenue Million Forecast, by Country 2019 & 2032
- Table 32: Germany Specialty Vehicle Industry Revenue (Million) Forecast, by Application 2019 & 2032
- Table 33: United Kingdom Specialty Vehicle Industry Revenue (Million) Forecast, by Application 2019 & 2032
- Table 34: France Specialty Vehicle Industry Revenue (Million) Forecast, by Application 2019 & 2032
- Table 35: Rest of Europe Specialty Vehicle Industry Revenue (Million) Forecast, by Application 2019 & 2032
- Table 36: Global Specialty Vehicle Industry Revenue Million Forecast, by Type 2019 & 2032
- Table 37: Global Specialty Vehicle Industry Revenue Million Forecast, by Application Type 2019 & 2032
- Table 38: Global Specialty Vehicle Industry Revenue Million Forecast, by Country 2019 & 2032
- Table 39: China Specialty Vehicle Industry Revenue (Million) Forecast, by Application 2019 & 2032
- Table 40: India Specialty Vehicle Industry Revenue (Million) Forecast, by Application 2019 & 2032
- Table 41: Japan Specialty Vehicle Industry Revenue (Million) Forecast, by Application 2019 & 2032
- Table 42: South Korea Specialty Vehicle Industry Revenue (Million) Forecast, by Application 2019 & 2032
- Table 43: Rest of Asia Pacific Specialty Vehicle Industry Revenue (Million) Forecast, by Application 2019 & 2032
- Table 44: Global Specialty Vehicle Industry Revenue Million Forecast, by Type 2019 & 2032
- Table 45: Global Specialty Vehicle Industry Revenue Million Forecast, by Application Type 2019 & 2032
- Table 46: Global Specialty Vehicle Industry Revenue Million Forecast, by Country 2019 & 2032
- Table 47: South America Specialty Vehicle Industry Revenue (Million) Forecast, by Application 2019 & 2032
- Table 48: Middle East and Africa Specialty Vehicle Industry Revenue (Million) Forecast, by Application 2019 & 2032
Frequently Asked Questions
1. What is the projected Compound Annual Growth Rate (CAGR) of the Specialty Vehicle Industry?
The projected CAGR is approximately 3.16%.
2. Which companies are prominent players in the Specialty Vehicle Industry?
Key companies in the market include REV Group, Farber Specialty Vehicles, Spartan Motors Inc (Shyft Group), Force Motors Limited, General Motors Company, Specialty Vehicles Inc, Daimler AG, Volvo Group, Emergency One Group, Matthews Specialty Vehicles Inc, LDV Inc, Oshkosh Corporatio.
3. What are the main segments of the Specialty Vehicle Industry?
The market segments include Type, Application Type.
4. Can you provide details about the market size?
The market size is estimated to be USD 106.39 Million as of 2022.
5. What are some drivers contributing to market growth?
Rise in demand for Advanced Comfort Systems In Vehicles.
6. What are the notable trends driving market growth?
Increase in Spending on Law Enforcement and Healthcare Facilities.
7. Are there any restraints impacting market growth?
High Cost Assoicated with Advanced Features.
8. Can you provide examples of recent developments in the market?
Jun 2022: Minsk Automobile Plant (MAZ) announced the launch of the MAZ minibus line. New products MAZ-281040 and MAZ-365022 were introduced at the event. MAZ-365022 is a light-duty commercial vehicle. This vehicle can be used to transport anything from a manufactured goods van to an ambulance.
9. What pricing options are available for accessing the report?
Pricing options include single-user, multi-user, and enterprise licenses priced at USD 4750, USD 5250, and USD 8750 respectively.
10. Is the market size provided in terms of value or volume?
The market size is provided in terms of value, measured in Million.
11. Are there any specific market keywords associated with the report?
Yes, the market keyword associated with the report is "Specialty Vehicle Industry," which aids in identifying and referencing the specific market segment covered.
12. How do I determine which pricing option suits my needs best?
The pricing options vary based on user requirements and access needs. Individual users may opt for single-user licenses, while businesses requiring broader access may choose multi-user or enterprise licenses for cost-effective access to the report.
13. Are there any additional resources or data provided in the Specialty Vehicle Industry report?
While the report offers comprehensive insights, it's advisable to review the specific contents or supplementary materials provided to ascertain if additional resources or data are available.
14. How can I stay updated on further developments or reports in the Specialty Vehicle Industry?
To stay informed about further developments, trends, and reports in the Specialty Vehicle Industry, consider subscribing to industry newsletters, following relevant companies and organizations, or regularly checking reputable industry news sources and publications.
Methodology
Step 1 - Identification of Relevant Samples Size from Population Database


Step 2 - Approaches for Defining Global Market Size (Value, Volume* & Price*)

Note*: In applicable scenarios
Step 3 - Data Sources
Primary Research
- Web Analytics
- Survey Reports
- Research Institute
- Latest Research Reports
- Opinion Leaders
Secondary Research
- Annual Reports
- White Paper
- Latest Press Release
- Industry Association
- Paid Database
- Investor Presentations

Step 4 - Data Triangulation
Involves using different sources of information in order to increase the validity of a study
These sources are likely to be stakeholders in a program - participants, other researchers, program staff, other community members, and so on.
Then we put all data in single framework & apply various statistical tools to find out the dynamic on the market.
During the analysis stage, feedback from the stakeholder groups would be compared to determine areas of agreement as well as areas of divergence


