
Key Insights
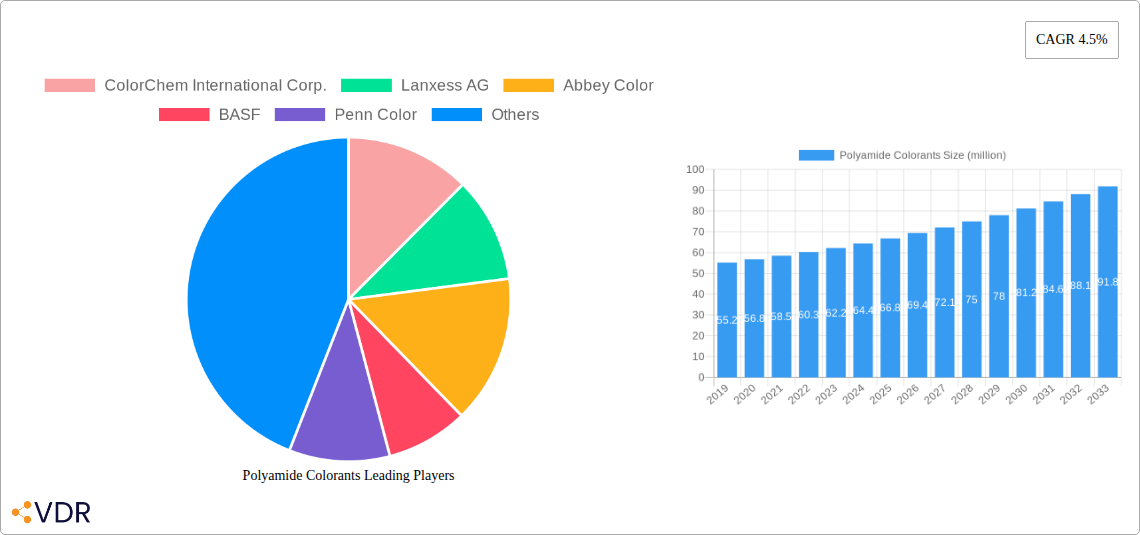
The global Polyamide Colorants market is poised for significant growth, projected to reach a substantial market size of approximately USD 66.8 million by 2025. This expansion is fueled by a healthy Compound Annual Growth Rate (CAGR) of 4.5% anticipated over the forecast period of 2025-2033. The demand for vibrant and durable coloration solutions across various industries is a primary driver for this market. Key applications such as automotive parts, where color consistency and UV resistance are paramount for aesthetics and longevity, are witnessing increased adoption of advanced polyamide colorants. Furthermore, the growing consumer goods sector, encompassing household items and packaging, is also contributing to market expansion as manufacturers seek innovative and safe coloring agents to enhance product appeal and brand differentiation. The inherent properties of polyamides, including their strength, flexibility, and chemical resistance, make them ideal for a wide array of demanding applications, further solidifying the market's upward trajectory.
The market is characterized by dynamic trends and strategic initiatives undertaken by leading companies to capture market share. Innovations in pigment and dye technologies, focusing on enhanced color fastness, eco-friendliness, and cost-effectiveness, are shaping the competitive landscape. Companies are investing in research and development to offer a broader spectrum of colors and specialized effect pigments that cater to evolving design preferences in consumer electronics and other high-value sectors. While the market presents strong growth opportunities, certain restraints such as fluctuating raw material prices and stringent environmental regulations in some regions necessitate agile business strategies and a focus on sustainable manufacturing processes. Nevertheless, the overarching demand for high-performance colorants in versatile polyamide applications, coupled with the strategic presence of major global players, indicates a robust and promising future for the Polyamide Colorants market.
Polyamide Colorants Market Report: Comprehensive Analysis and Future Outlook (2019–2033)
This in-depth report provides a thorough analysis of the global Polyamide Colorants market, covering its dynamics, growth trends, regional dominance, product landscape, key drivers, emerging opportunities, and future outlook. With a study period spanning from 2019 to 2033, including a base year of 2025 and a forecast period from 2025 to 2033, this report offers valuable insights for industry professionals, investors, and stakeholders.
Polyamide Colorants Market Dynamics & Structure
The global Polyamide Colorants market exhibits a moderate to high concentration, with a few key players holding significant market share. Technological innovation is a primary driver, with continuous advancements in pigment and dye formulations enhancing color fastness, thermal stability, and environmental sustainability. Regulatory frameworks, particularly concerning REACH compliance and eco-labeling, are increasingly influencing product development and market entry. Competitive product substitutes, while present in some niche applications, are largely outmatched by the performance and versatility of specialized polyamide colorants. End-user demographics are shifting towards industries demanding high-performance and visually appealing materials, such as automotive and consumer electronics. Mergers and acquisitions (M&A) are a notable trend, as established players seek to expand their product portfolios, geographical reach, and technological capabilities. For instance, the historical period saw several strategic acquisitions aimed at consolidating market share and acquiring innovative technologies, contributing to market consolidation.
- Market Concentration: Moderate to high, with key players dominating specific segments.
- Technological Innovation: Driven by demand for enhanced performance, sustainability, and novel color effects.
- Regulatory Frameworks: Increasingly stringent environmental and safety regulations shaping product offerings.
- Competitive Landscape: Primarily characterized by specialized polyamide colorants; substitutes are application-specific.
- End-User Demographics: Growing demand from automotive, consumer electronics, and high-end household goods sectors.
- M&A Trends: Strategic acquisitions to enhance market position and technological capabilities.
Polyamide Colorants Growth Trends & Insights
The global Polyamide Colorants market is poised for robust growth, projected to expand at a Compound Annual Growth Rate (CAGR) of approximately 5.5% during the forecast period of 2025–2033. The market size, estimated at around $1,850 million in the base year 2025, is expected to reach over $2,600 million by 2033. This growth is underpinned by a confluence of factors, including escalating demand from the automotive industry for vibrant and durable interior and exterior components, alongside the burgeoning packaging sector's need for aesthetically pleasing and functional color solutions. Furthermore, the increasing adoption of advanced coloring technologies in consumer electronics and the persistent demand for high-quality colorants in household goods are significant contributors.
Technological disruptions are playing a crucial role, with the development of eco-friendly and bio-based colorants gaining traction as manufacturers and consumers prioritize sustainability. Innovations in nano-pigments and effect pigments are also opening new avenues for product differentiation and enhanced performance, such as improved UV resistance and scratch durability. Consumer behavior shifts, driven by aesthetic preferences and brand image, are compelling manufacturers to invest in superior coloring solutions that enhance product appeal. The penetration of specialized polyamide colorants into emerging applications, such as technical textiles and 3D printing, is further accelerating market expansion. The historical period from 2019–2024 witnessed steady growth, fueled by industrial recovery and an increasing focus on value-added products. The market is also influenced by the parent market of the broader polymer additives sector, which provides essential raw materials and technological advancements that trickle down to polyamide colorants. The child market of specific polyamide applications, like automotive textiles or high-performance packaging films, also contributes to the overall growth trajectory by driving demand for tailored colorant solutions.

Dominant Regions, Countries, or Segments in Polyamide Colorants
The Asia Pacific region is emerging as the dominant force in the global Polyamide Colorants market, driven by its robust manufacturing base, rapidly expanding industrial sectors, and increasing consumer demand for colored plastic products. Within this region, China stands out as a primary growth engine, fueled by its substantial production of automotive parts, consumer electronics, and packaging materials, all significant end-users of polyamide colorants. The country’s supportive government policies, coupled with substantial investments in infrastructure and technological advancements, further bolster its market leadership.
The automotive sector is a key segment driving regional dominance. The burgeoning automotive production in Asia Pacific, particularly in China and India, necessitates a significant volume of high-quality polyamide colorants for interior components (dashboards, upholstery), exterior parts (bumpers, trim), and under-the-hood applications requiring heat and UV resistance. The packaging segment also plays a pivotal role. The increasing demand for visually appealing and brand-differentiating packaging solutions for food, beverages, and consumer goods in the region directly translates to higher consumption of polyamide colorants.
Furthermore, the household goods and consumer electronics sectors in Asia Pacific are experiencing substantial growth. The rising disposable incomes and the increasing popularity of aesthetically designed appliances, gadgets, and home furnishings contribute significantly to the demand for a wide spectrum of colors and finishes. The "Others" segment, encompassing technical textiles, medical devices, and industrial components, is also witnessing steady growth, propelled by innovation and diversification within the region's manufacturing ecosystem.
- Dominant Region: Asia Pacific, particularly China.
- Key Country: China, due to its manufacturing prowess and extensive end-user industries.
- Dominant Application Segment: Auto Parts, driven by extensive automotive manufacturing.
- Key Growth Drivers in Asia Pacific:
- Rapid industrialization and manufacturing expansion.
- Strong consumer demand for colored plastic products.
- Supportive government policies and infrastructure development.
- Growth in automotive production, packaging, and consumer electronics.
- Increasing focus on high-performance and aesthetically pleasing materials.
Polyamide Colorants Product Landscape
The Polyamide Colorants product landscape is characterized by a diverse range of pigments and dyes designed to meet specific application requirements. Innovations focus on developing colorants with enhanced thermal stability, excellent light and weather fastness, and superior dispersion properties within polyamide matrices. Key product developments include high-performance organic pigments offering vibrant hues and exceptional durability, as well as inorganic pigments providing excellent opacity and UV resistance. Specialty effect pigments, such as metallic and pearlescent finishes, are also gaining traction, catering to the demand for premium aesthetics in automotive and consumer goods. The development of bio-based and biodegradable colorants is another significant trend, aligning with growing sustainability demands. These products offer unique selling propositions by combining performance with environmental responsibility.
Key Drivers, Barriers & Challenges in Polyamide Colorants
Key Drivers:
- Growing Demand from Automotive Sector: Increasing production of vehicles globally, particularly in emerging economies, drives demand for vibrant, durable, and UV-resistant colorants for interior and exterior components.
- Expansion of Packaging Industry: The need for visually appealing and brand-differentiating packaging solutions across food & beverage, personal care, and consumer goods sectors fuels the consumption of polyamide colorants.
- Technological Advancements: Development of high-performance, eco-friendly, and specialty effect colorants enhances product appeal and functionality, opening new application avenues.
- Rising Disposable Incomes: Increased consumer spending power in developing regions translates to higher demand for colored consumer electronics, household goods, and other plastic-based products.
Barriers & Challenges:
- Raw Material Price Volatility: Fluctuations in the prices of key raw materials, such as petrochemical derivatives, can impact production costs and profit margins.
- Stringent Environmental Regulations: Evolving environmental and safety regulations, including restrictions on certain chemical compounds, necessitate ongoing product reformulation and compliance efforts, adding to R&D costs.
- Supply Chain Disruptions: Geopolitical events, logistics challenges, and natural disasters can disrupt the supply chain, leading to delays and increased costs for manufacturers.
- Intense Competition: The market is characterized by the presence of several established players and new entrants, leading to price pressures and the need for continuous innovation to maintain market share. The estimated impact of supply chain disruptions on market growth is around 0.5% to 1% annually.
Emerging Opportunities in Polyamide Colorants
Emerging opportunities in the Polyamide Colorants market lie in the growing demand for sustainable and bio-based colorants, catering to increasing consumer and regulatory pressure for eco-friendly solutions. The expansion of 3D printing technology presents a significant opportunity, as customized and high-performance colorants are required for various polyamide printing filaments used in prototyping and manufacturing. Furthermore, the development of smart colorants, capable of changing color in response to stimuli like temperature or light, opens doors for innovative applications in textiles and functional materials. Untapped markets in developing regions with a growing middle class and increasing adoption of plastic-based products also represent a considerable growth avenue.
Growth Accelerators in the Polyamide Colorants Industry
Key growth accelerators for the Polyamide Colorants industry include significant investments in research and development for novel pigment and dye technologies, particularly those focusing on enhanced performance and environmental sustainability. Strategic partnerships and collaborations between colorant manufacturers, polymer producers, and end-users are crucial for co-developing tailored solutions and expanding market reach. Furthermore, the continuous exploration of new applications for polyamides, such as in advanced composites, medical devices, and high-performance textiles, will unlock substantial demand for specialized colorants. Market expansion strategies targeting emerging economies and developing specific product portfolios for these regions are also critical growth catalysts.
Key Players Shaping the Polyamide Colorants Market
- ColorChem International Corp.
- Lanxess AG
- Abbey Color
- BASF
- Penn Color
- Sun Chemical
- Organic Dyes and Pigments
- First Source Worldwide
- Bonneau Company
- DIC Corporation
- Avient
- DAICOLOR SHANGHAI MFG
- Shanghai Juqi Plastic Technology
Notable Milestones in Polyamide Colorants Sector
- 2019: Launch of a new range of high-performance, bio-based pigments by a leading manufacturer, addressing sustainability demands.
- 2020: Significant M&A activity, with a major global player acquiring a niche producer of specialty effect pigments to expand its portfolio.
- 2021: Introduction of advanced colorant dispersion technologies improving ease of use and consistency in polyamide processing.
- 2022: Increased focus on regulatory compliance and product stewardship, with several companies achieving key certifications for eco-friendly formulations.
- 2023: Development and commercialization of novel temperature-sensitive colorants for smart textile applications.
- 2024: Growing trend of strategic partnerships between colorant suppliers and automotive OEMs for customized color solutions.
In-Depth Polyamide Colorants Market Outlook
The Polyamide Colorants market outlook is highly promising, driven by sustained demand from key sectors and continuous technological innovation. Growth accelerators such as the increasing emphasis on sustainability, the expansion of 3D printing applications, and the exploration of new high-performance end-uses will continue to propel market expansion. Strategic opportunities lie in capitalizing on the growing demand for eco-friendly colorants and developing specialized solutions for emerging technologies like additive manufacturing. The market is expected to witness further consolidation through strategic alliances and acquisitions, leading to a more competitive yet consolidated landscape. The industry's ability to adapt to evolving regulatory environments and consumer preferences will be crucial for future success. The overall market potential remains robust, with continued growth anticipated throughout the forecast period.
Polyamide Colorants Segmentation
-
1. Application
- 1.1. Auto Parts
- 1.2. Household Goods
- 1.3. Packaging
- 1.4. Consumer Electronics
- 1.5. Others
-
2. Types
- 2.1. Pigments
- 2.2. Dyes
Polyamide Colorants Segmentation By Geography
-
1. North America
- 1.1. United States
- 1.2. Canada
- 1.3. Mexico
-
2. South America
- 2.1. Brazil
- 2.2. Argentina
- 2.3. Rest of South America
-
3. Europe
- 3.1. United Kingdom
- 3.2. Germany
- 3.3. France
- 3.4. Italy
- 3.5. Spain
- 3.6. Russia
- 3.7. Benelux
- 3.8. Nordics
- 3.9. Rest of Europe
-
4. Middle East & Africa
- 4.1. Turkey
- 4.2. Israel
- 4.3. GCC
- 4.4. North Africa
- 4.5. South Africa
- 4.6. Rest of Middle East & Africa
-
5. Asia Pacific
- 5.1. China
- 5.2. India
- 5.3. Japan
- 5.4. South Korea
- 5.5. ASEAN
- 5.6. Oceania
- 5.7. Rest of Asia Pacific

Polyamide Colorants REPORT HIGHLIGHTS
| Aspects | Details |
|---|---|
| Study Period | 2019-2033 |
| Base Year | 2024 |
| Estimated Year | 2025 |
| Forecast Period | 2025-2033 |
| Historical Period | 2019-2024 |
| Growth Rate | CAGR of 4.5% from 2019-2033 |
| Segmentation |
|
Table of Contents
- 1. Introduction
- 1.1. Research Scope
- 1.2. Market Segmentation
- 1.3. Research Methodology
- 1.4. Definitions and Assumptions
- 2. Executive Summary
- 2.1. Introduction
- 3. Market Dynamics
- 3.1. Introduction
- 3.2. Market Drivers
- 3.3. Market Restrains
- 3.4. Market Trends
- 4. Market Factor Analysis
- 4.1. Porters Five Forces
- 4.2. Supply/Value Chain
- 4.3. PESTEL analysis
- 4.4. Market Entropy
- 4.5. Patent/Trademark Analysis
- 5. Global Polyamide Colorants Analysis, Insights and Forecast, 2019-2031
- 5.1. Market Analysis, Insights and Forecast - by Application
- 5.1.1. Auto Parts
- 5.1.2. Household Goods
- 5.1.3. Packaging
- 5.1.4. Consumer Electronics
- 5.1.5. Others
- 5.2. Market Analysis, Insights and Forecast - by Types
- 5.2.1. Pigments
- 5.2.2. Dyes
- 5.3. Market Analysis, Insights and Forecast - by Region
- 5.3.1. North America
- 5.3.2. South America
- 5.3.3. Europe
- 5.3.4. Middle East & Africa
- 5.3.5. Asia Pacific
- 5.1. Market Analysis, Insights and Forecast - by Application
- 6. North America Polyamide Colorants Analysis, Insights and Forecast, 2019-2031
- 6.1. Market Analysis, Insights and Forecast - by Application
- 6.1.1. Auto Parts
- 6.1.2. Household Goods
- 6.1.3. Packaging
- 6.1.4. Consumer Electronics
- 6.1.5. Others
- 6.2. Market Analysis, Insights and Forecast - by Types
- 6.2.1. Pigments
- 6.2.2. Dyes
- 6.1. Market Analysis, Insights and Forecast - by Application
- 7. South America Polyamide Colorants Analysis, Insights and Forecast, 2019-2031
- 7.1. Market Analysis, Insights and Forecast - by Application
- 7.1.1. Auto Parts
- 7.1.2. Household Goods
- 7.1.3. Packaging
- 7.1.4. Consumer Electronics
- 7.1.5. Others
- 7.2. Market Analysis, Insights and Forecast - by Types
- 7.2.1. Pigments
- 7.2.2. Dyes
- 7.1. Market Analysis, Insights and Forecast - by Application
- 8. Europe Polyamide Colorants Analysis, Insights and Forecast, 2019-2031
- 8.1. Market Analysis, Insights and Forecast - by Application
- 8.1.1. Auto Parts
- 8.1.2. Household Goods
- 8.1.3. Packaging
- 8.1.4. Consumer Electronics
- 8.1.5. Others
- 8.2. Market Analysis, Insights and Forecast - by Types
- 8.2.1. Pigments
- 8.2.2. Dyes
- 8.1. Market Analysis, Insights and Forecast - by Application
- 9. Middle East & Africa Polyamide Colorants Analysis, Insights and Forecast, 2019-2031
- 9.1. Market Analysis, Insights and Forecast - by Application
- 9.1.1. Auto Parts
- 9.1.2. Household Goods
- 9.1.3. Packaging
- 9.1.4. Consumer Electronics
- 9.1.5. Others
- 9.2. Market Analysis, Insights and Forecast - by Types
- 9.2.1. Pigments
- 9.2.2. Dyes
- 9.1. Market Analysis, Insights and Forecast - by Application
- 10. Asia Pacific Polyamide Colorants Analysis, Insights and Forecast, 2019-2031
- 10.1. Market Analysis, Insights and Forecast - by Application
- 10.1.1. Auto Parts
- 10.1.2. Household Goods
- 10.1.3. Packaging
- 10.1.4. Consumer Electronics
- 10.1.5. Others
- 10.2. Market Analysis, Insights and Forecast - by Types
- 10.2.1. Pigments
- 10.2.2. Dyes
- 10.1. Market Analysis, Insights and Forecast - by Application
- 11. Competitive Analysis
- 11.1. Global Market Share Analysis 2024
- 11.2. Company Profiles
- 11.2.1 ColorChem International Corp.
- 11.2.1.1. Overview
- 11.2.1.2. Products
- 11.2.1.3. SWOT Analysis
- 11.2.1.4. Recent Developments
- 11.2.1.5. Financials (Based on Availability)
- 11.2.2 Lanxess AG
- 11.2.2.1. Overview
- 11.2.2.2. Products
- 11.2.2.3. SWOT Analysis
- 11.2.2.4. Recent Developments
- 11.2.2.5. Financials (Based on Availability)
- 11.2.3 Abbey Color
- 11.2.3.1. Overview
- 11.2.3.2. Products
- 11.2.3.3. SWOT Analysis
- 11.2.3.4. Recent Developments
- 11.2.3.5. Financials (Based on Availability)
- 11.2.4 BASF
- 11.2.4.1. Overview
- 11.2.4.2. Products
- 11.2.4.3. SWOT Analysis
- 11.2.4.4. Recent Developments
- 11.2.4.5. Financials (Based on Availability)
- 11.2.5 Penn Color
- 11.2.5.1. Overview
- 11.2.5.2. Products
- 11.2.5.3. SWOT Analysis
- 11.2.5.4. Recent Developments
- 11.2.5.5. Financials (Based on Availability)
- 11.2.6 Sun Chemical
- 11.2.6.1. Overview
- 11.2.6.2. Products
- 11.2.6.3. SWOT Analysis
- 11.2.6.4. Recent Developments
- 11.2.6.5. Financials (Based on Availability)
- 11.2.7 Organic Dyes and Pigments
- 11.2.7.1. Overview
- 11.2.7.2. Products
- 11.2.7.3. SWOT Analysis
- 11.2.7.4. Recent Developments
- 11.2.7.5. Financials (Based on Availability)
- 11.2.8 First Source Worldwide
- 11.2.8.1. Overview
- 11.2.8.2. Products
- 11.2.8.3. SWOT Analysis
- 11.2.8.4. Recent Developments
- 11.2.8.5. Financials (Based on Availability)
- 11.2.9 Bonneau Company
- 11.2.9.1. Overview
- 11.2.9.2. Products
- 11.2.9.3. SWOT Analysis
- 11.2.9.4. Recent Developments
- 11.2.9.5. Financials (Based on Availability)
- 11.2.10 DIC Corporation
- 11.2.10.1. Overview
- 11.2.10.2. Products
- 11.2.10.3. SWOT Analysis
- 11.2.10.4. Recent Developments
- 11.2.10.5. Financials (Based on Availability)
- 11.2.11 Avient
- 11.2.11.1. Overview
- 11.2.11.2. Products
- 11.2.11.3. SWOT Analysis
- 11.2.11.4. Recent Developments
- 11.2.11.5. Financials (Based on Availability)
- 11.2.12 DAICOLOR SHANGHAI MFG
- 11.2.12.1. Overview
- 11.2.12.2. Products
- 11.2.12.3. SWOT Analysis
- 11.2.12.4. Recent Developments
- 11.2.12.5. Financials (Based on Availability)
- 11.2.13 Shanghai Juqi Plastic Technology
- 11.2.13.1. Overview
- 11.2.13.2. Products
- 11.2.13.3. SWOT Analysis
- 11.2.13.4. Recent Developments
- 11.2.13.5. Financials (Based on Availability)
- 11.2.1 ColorChem International Corp.
List of Figures
- Figure 1: Global Polyamide Colorants Revenue Breakdown (million, %) by Region 2024 & 2032
- Figure 2: Global Polyamide Colorants Volume Breakdown (K, %) by Region 2024 & 2032
- Figure 3: North America Polyamide Colorants Revenue (million), by Application 2024 & 2032
- Figure 4: North America Polyamide Colorants Volume (K), by Application 2024 & 2032
- Figure 5: North America Polyamide Colorants Revenue Share (%), by Application 2024 & 2032
- Figure 6: North America Polyamide Colorants Volume Share (%), by Application 2024 & 2032
- Figure 7: North America Polyamide Colorants Revenue (million), by Types 2024 & 2032
- Figure 8: North America Polyamide Colorants Volume (K), by Types 2024 & 2032
- Figure 9: North America Polyamide Colorants Revenue Share (%), by Types 2024 & 2032
- Figure 10: North America Polyamide Colorants Volume Share (%), by Types 2024 & 2032
- Figure 11: North America Polyamide Colorants Revenue (million), by Country 2024 & 2032
- Figure 12: North America Polyamide Colorants Volume (K), by Country 2024 & 2032
- Figure 13: North America Polyamide Colorants Revenue Share (%), by Country 2024 & 2032
- Figure 14: North America Polyamide Colorants Volume Share (%), by Country 2024 & 2032
- Figure 15: South America Polyamide Colorants Revenue (million), by Application 2024 & 2032
- Figure 16: South America Polyamide Colorants Volume (K), by Application 2024 & 2032
- Figure 17: South America Polyamide Colorants Revenue Share (%), by Application 2024 & 2032
- Figure 18: South America Polyamide Colorants Volume Share (%), by Application 2024 & 2032
- Figure 19: South America Polyamide Colorants Revenue (million), by Types 2024 & 2032
- Figure 20: South America Polyamide Colorants Volume (K), by Types 2024 & 2032
- Figure 21: South America Polyamide Colorants Revenue Share (%), by Types 2024 & 2032
- Figure 22: South America Polyamide Colorants Volume Share (%), by Types 2024 & 2032
- Figure 23: South America Polyamide Colorants Revenue (million), by Country 2024 & 2032
- Figure 24: South America Polyamide Colorants Volume (K), by Country 2024 & 2032
- Figure 25: South America Polyamide Colorants Revenue Share (%), by Country 2024 & 2032
- Figure 26: South America Polyamide Colorants Volume Share (%), by Country 2024 & 2032
- Figure 27: Europe Polyamide Colorants Revenue (million), by Application 2024 & 2032
- Figure 28: Europe Polyamide Colorants Volume (K), by Application 2024 & 2032
- Figure 29: Europe Polyamide Colorants Revenue Share (%), by Application 2024 & 2032
- Figure 30: Europe Polyamide Colorants Volume Share (%), by Application 2024 & 2032
- Figure 31: Europe Polyamide Colorants Revenue (million), by Types 2024 & 2032
- Figure 32: Europe Polyamide Colorants Volume (K), by Types 2024 & 2032
- Figure 33: Europe Polyamide Colorants Revenue Share (%), by Types 2024 & 2032
- Figure 34: Europe Polyamide Colorants Volume Share (%), by Types 2024 & 2032
- Figure 35: Europe Polyamide Colorants Revenue (million), by Country 2024 & 2032
- Figure 36: Europe Polyamide Colorants Volume (K), by Country 2024 & 2032
- Figure 37: Europe Polyamide Colorants Revenue Share (%), by Country 2024 & 2032
- Figure 38: Europe Polyamide Colorants Volume Share (%), by Country 2024 & 2032
- Figure 39: Middle East & Africa Polyamide Colorants Revenue (million), by Application 2024 & 2032
- Figure 40: Middle East & Africa Polyamide Colorants Volume (K), by Application 2024 & 2032
- Figure 41: Middle East & Africa Polyamide Colorants Revenue Share (%), by Application 2024 & 2032
- Figure 42: Middle East & Africa Polyamide Colorants Volume Share (%), by Application 2024 & 2032
- Figure 43: Middle East & Africa Polyamide Colorants Revenue (million), by Types 2024 & 2032
- Figure 44: Middle East & Africa Polyamide Colorants Volume (K), by Types 2024 & 2032
- Figure 45: Middle East & Africa Polyamide Colorants Revenue Share (%), by Types 2024 & 2032
- Figure 46: Middle East & Africa Polyamide Colorants Volume Share (%), by Types 2024 & 2032
- Figure 47: Middle East & Africa Polyamide Colorants Revenue (million), by Country 2024 & 2032
- Figure 48: Middle East & Africa Polyamide Colorants Volume (K), by Country 2024 & 2032
- Figure 49: Middle East & Africa Polyamide Colorants Revenue Share (%), by Country 2024 & 2032
- Figure 50: Middle East & Africa Polyamide Colorants Volume Share (%), by Country 2024 & 2032
- Figure 51: Asia Pacific Polyamide Colorants Revenue (million), by Application 2024 & 2032
- Figure 52: Asia Pacific Polyamide Colorants Volume (K), by Application 2024 & 2032
- Figure 53: Asia Pacific Polyamide Colorants Revenue Share (%), by Application 2024 & 2032
- Figure 54: Asia Pacific Polyamide Colorants Volume Share (%), by Application 2024 & 2032
- Figure 55: Asia Pacific Polyamide Colorants Revenue (million), by Types 2024 & 2032
- Figure 56: Asia Pacific Polyamide Colorants Volume (K), by Types 2024 & 2032
- Figure 57: Asia Pacific Polyamide Colorants Revenue Share (%), by Types 2024 & 2032
- Figure 58: Asia Pacific Polyamide Colorants Volume Share (%), by Types 2024 & 2032
- Figure 59: Asia Pacific Polyamide Colorants Revenue (million), by Country 2024 & 2032
- Figure 60: Asia Pacific Polyamide Colorants Volume (K), by Country 2024 & 2032
- Figure 61: Asia Pacific Polyamide Colorants Revenue Share (%), by Country 2024 & 2032
- Figure 62: Asia Pacific Polyamide Colorants Volume Share (%), by Country 2024 & 2032
List of Tables
- Table 1: Global Polyamide Colorants Revenue million Forecast, by Region 2019 & 2032
- Table 2: Global Polyamide Colorants Volume K Forecast, by Region 2019 & 2032
- Table 3: Global Polyamide Colorants Revenue million Forecast, by Application 2019 & 2032
- Table 4: Global Polyamide Colorants Volume K Forecast, by Application 2019 & 2032
- Table 5: Global Polyamide Colorants Revenue million Forecast, by Types 2019 & 2032
- Table 6: Global Polyamide Colorants Volume K Forecast, by Types 2019 & 2032
- Table 7: Global Polyamide Colorants Revenue million Forecast, by Region 2019 & 2032
- Table 8: Global Polyamide Colorants Volume K Forecast, by Region 2019 & 2032
- Table 9: Global Polyamide Colorants Revenue million Forecast, by Application 2019 & 2032
- Table 10: Global Polyamide Colorants Volume K Forecast, by Application 2019 & 2032
- Table 11: Global Polyamide Colorants Revenue million Forecast, by Types 2019 & 2032
- Table 12: Global Polyamide Colorants Volume K Forecast, by Types 2019 & 2032
- Table 13: Global Polyamide Colorants Revenue million Forecast, by Country 2019 & 2032
- Table 14: Global Polyamide Colorants Volume K Forecast, by Country 2019 & 2032
- Table 15: United States Polyamide Colorants Revenue (million) Forecast, by Application 2019 & 2032
- Table 16: United States Polyamide Colorants Volume (K) Forecast, by Application 2019 & 2032
- Table 17: Canada Polyamide Colorants Revenue (million) Forecast, by Application 2019 & 2032
- Table 18: Canada Polyamide Colorants Volume (K) Forecast, by Application 2019 & 2032
- Table 19: Mexico Polyamide Colorants Revenue (million) Forecast, by Application 2019 & 2032
- Table 20: Mexico Polyamide Colorants Volume (K) Forecast, by Application 2019 & 2032
- Table 21: Global Polyamide Colorants Revenue million Forecast, by Application 2019 & 2032
- Table 22: Global Polyamide Colorants Volume K Forecast, by Application 2019 & 2032
- Table 23: Global Polyamide Colorants Revenue million Forecast, by Types 2019 & 2032
- Table 24: Global Polyamide Colorants Volume K Forecast, by Types 2019 & 2032
- Table 25: Global Polyamide Colorants Revenue million Forecast, by Country 2019 & 2032
- Table 26: Global Polyamide Colorants Volume K Forecast, by Country 2019 & 2032
- Table 27: Brazil Polyamide Colorants Revenue (million) Forecast, by Application 2019 & 2032
- Table 28: Brazil Polyamide Colorants Volume (K) Forecast, by Application 2019 & 2032
- Table 29: Argentina Polyamide Colorants Revenue (million) Forecast, by Application 2019 & 2032
- Table 30: Argentina Polyamide Colorants Volume (K) Forecast, by Application 2019 & 2032
- Table 31: Rest of South America Polyamide Colorants Revenue (million) Forecast, by Application 2019 & 2032
- Table 32: Rest of South America Polyamide Colorants Volume (K) Forecast, by Application 2019 & 2032
- Table 33: Global Polyamide Colorants Revenue million Forecast, by Application 2019 & 2032
- Table 34: Global Polyamide Colorants Volume K Forecast, by Application 2019 & 2032
- Table 35: Global Polyamide Colorants Revenue million Forecast, by Types 2019 & 2032
- Table 36: Global Polyamide Colorants Volume K Forecast, by Types 2019 & 2032
- Table 37: Global Polyamide Colorants Revenue million Forecast, by Country 2019 & 2032
- Table 38: Global Polyamide Colorants Volume K Forecast, by Country 2019 & 2032
- Table 39: United Kingdom Polyamide Colorants Revenue (million) Forecast, by Application 2019 & 2032
- Table 40: United Kingdom Polyamide Colorants Volume (K) Forecast, by Application 2019 & 2032
- Table 41: Germany Polyamide Colorants Revenue (million) Forecast, by Application 2019 & 2032
- Table 42: Germany Polyamide Colorants Volume (K) Forecast, by Application 2019 & 2032
- Table 43: France Polyamide Colorants Revenue (million) Forecast, by Application 2019 & 2032
- Table 44: France Polyamide Colorants Volume (K) Forecast, by Application 2019 & 2032
- Table 45: Italy Polyamide Colorants Revenue (million) Forecast, by Application 2019 & 2032
- Table 46: Italy Polyamide Colorants Volume (K) Forecast, by Application 2019 & 2032
- Table 47: Spain Polyamide Colorants Revenue (million) Forecast, by Application 2019 & 2032
- Table 48: Spain Polyamide Colorants Volume (K) Forecast, by Application 2019 & 2032
- Table 49: Russia Polyamide Colorants Revenue (million) Forecast, by Application 2019 & 2032
- Table 50: Russia Polyamide Colorants Volume (K) Forecast, by Application 2019 & 2032
- Table 51: Benelux Polyamide Colorants Revenue (million) Forecast, by Application 2019 & 2032
- Table 52: Benelux Polyamide Colorants Volume (K) Forecast, by Application 2019 & 2032
- Table 53: Nordics Polyamide Colorants Revenue (million) Forecast, by Application 2019 & 2032
- Table 54: Nordics Polyamide Colorants Volume (K) Forecast, by Application 2019 & 2032
- Table 55: Rest of Europe Polyamide Colorants Revenue (million) Forecast, by Application 2019 & 2032
- Table 56: Rest of Europe Polyamide Colorants Volume (K) Forecast, by Application 2019 & 2032
- Table 57: Global Polyamide Colorants Revenue million Forecast, by Application 2019 & 2032
- Table 58: Global Polyamide Colorants Volume K Forecast, by Application 2019 & 2032
- Table 59: Global Polyamide Colorants Revenue million Forecast, by Types 2019 & 2032
- Table 60: Global Polyamide Colorants Volume K Forecast, by Types 2019 & 2032
- Table 61: Global Polyamide Colorants Revenue million Forecast, by Country 2019 & 2032
- Table 62: Global Polyamide Colorants Volume K Forecast, by Country 2019 & 2032
- Table 63: Turkey Polyamide Colorants Revenue (million) Forecast, by Application 2019 & 2032
- Table 64: Turkey Polyamide Colorants Volume (K) Forecast, by Application 2019 & 2032
- Table 65: Israel Polyamide Colorants Revenue (million) Forecast, by Application 2019 & 2032
- Table 66: Israel Polyamide Colorants Volume (K) Forecast, by Application 2019 & 2032
- Table 67: GCC Polyamide Colorants Revenue (million) Forecast, by Application 2019 & 2032
- Table 68: GCC Polyamide Colorants Volume (K) Forecast, by Application 2019 & 2032
- Table 69: North Africa Polyamide Colorants Revenue (million) Forecast, by Application 2019 & 2032
- Table 70: North Africa Polyamide Colorants Volume (K) Forecast, by Application 2019 & 2032
- Table 71: South Africa Polyamide Colorants Revenue (million) Forecast, by Application 2019 & 2032
- Table 72: South Africa Polyamide Colorants Volume (K) Forecast, by Application 2019 & 2032
- Table 73: Rest of Middle East & Africa Polyamide Colorants Revenue (million) Forecast, by Application 2019 & 2032
- Table 74: Rest of Middle East & Africa Polyamide Colorants Volume (K) Forecast, by Application 2019 & 2032
- Table 75: Global Polyamide Colorants Revenue million Forecast, by Application 2019 & 2032
- Table 76: Global Polyamide Colorants Volume K Forecast, by Application 2019 & 2032
- Table 77: Global Polyamide Colorants Revenue million Forecast, by Types 2019 & 2032
- Table 78: Global Polyamide Colorants Volume K Forecast, by Types 2019 & 2032
- Table 79: Global Polyamide Colorants Revenue million Forecast, by Country 2019 & 2032
- Table 80: Global Polyamide Colorants Volume K Forecast, by Country 2019 & 2032
- Table 81: China Polyamide Colorants Revenue (million) Forecast, by Application 2019 & 2032
- Table 82: China Polyamide Colorants Volume (K) Forecast, by Application 2019 & 2032
- Table 83: India Polyamide Colorants Revenue (million) Forecast, by Application 2019 & 2032
- Table 84: India Polyamide Colorants Volume (K) Forecast, by Application 2019 & 2032
- Table 85: Japan Polyamide Colorants Revenue (million) Forecast, by Application 2019 & 2032
- Table 86: Japan Polyamide Colorants Volume (K) Forecast, by Application 2019 & 2032
- Table 87: South Korea Polyamide Colorants Revenue (million) Forecast, by Application 2019 & 2032
- Table 88: South Korea Polyamide Colorants Volume (K) Forecast, by Application 2019 & 2032
- Table 89: ASEAN Polyamide Colorants Revenue (million) Forecast, by Application 2019 & 2032
- Table 90: ASEAN Polyamide Colorants Volume (K) Forecast, by Application 2019 & 2032
- Table 91: Oceania Polyamide Colorants Revenue (million) Forecast, by Application 2019 & 2032
- Table 92: Oceania Polyamide Colorants Volume (K) Forecast, by Application 2019 & 2032
- Table 93: Rest of Asia Pacific Polyamide Colorants Revenue (million) Forecast, by Application 2019 & 2032
- Table 94: Rest of Asia Pacific Polyamide Colorants Volume (K) Forecast, by Application 2019 & 2032
Frequently Asked Questions
1. What is the projected Compound Annual Growth Rate (CAGR) of the Polyamide Colorants?
The projected CAGR is approximately 4.5%.
2. Which companies are prominent players in the Polyamide Colorants?
Key companies in the market include ColorChem International Corp., Lanxess AG, Abbey Color, BASF, Penn Color, Sun Chemical, Organic Dyes and Pigments, First Source Worldwide, Bonneau Company, DIC Corporation, Avient, DAICOLOR SHANGHAI MFG, Shanghai Juqi Plastic Technology.
3. What are the main segments of the Polyamide Colorants?
The market segments include Application, Types.
4. Can you provide details about the market size?
The market size is estimated to be USD 66.8 million as of 2022.
5. What are some drivers contributing to market growth?
N/A
6. What are the notable trends driving market growth?
N/A
7. Are there any restraints impacting market growth?
N/A
8. Can you provide examples of recent developments in the market?
N/A
9. What pricing options are available for accessing the report?
Pricing options include single-user, multi-user, and enterprise licenses priced at USD 4350.00, USD 6525.00, and USD 8700.00 respectively.
10. Is the market size provided in terms of value or volume?
The market size is provided in terms of value, measured in million and volume, measured in K.
11. Are there any specific market keywords associated with the report?
Yes, the market keyword associated with the report is "Polyamide Colorants," which aids in identifying and referencing the specific market segment covered.
12. How do I determine which pricing option suits my needs best?
The pricing options vary based on user requirements and access needs. Individual users may opt for single-user licenses, while businesses requiring broader access may choose multi-user or enterprise licenses for cost-effective access to the report.
13. Are there any additional resources or data provided in the Polyamide Colorants report?
While the report offers comprehensive insights, it's advisable to review the specific contents or supplementary materials provided to ascertain if additional resources or data are available.
14. How can I stay updated on further developments or reports in the Polyamide Colorants?
To stay informed about further developments, trends, and reports in the Polyamide Colorants, consider subscribing to industry newsletters, following relevant companies and organizations, or regularly checking reputable industry news sources and publications.
Methodology
Step 1 - Identification of Relevant Samples Size from Population Database


Step 2 - Approaches for Defining Global Market Size (Value, Volume* & Price*)

Note*: In applicable scenarios
Step 3 - Data Sources
Primary Research
- Web Analytics
- Survey Reports
- Research Institute
- Latest Research Reports
- Opinion Leaders
Secondary Research
- Annual Reports
- White Paper
- Latest Press Release
- Industry Association
- Paid Database
- Investor Presentations

Step 4 - Data Triangulation
Involves using different sources of information in order to increase the validity of a study
These sources are likely to be stakeholders in a program - participants, other researchers, program staff, other community members, and so on.
Then we put all data in single framework & apply various statistical tools to find out the dynamic on the market.
During the analysis stage, feedback from the stakeholder groups would be compared to determine areas of agreement as well as areas of divergence


