
Key Insights
The nanoporous membranes market, valued at $871.3 million in 2025, is projected to experience robust growth, driven by increasing demand across diverse applications. A compound annual growth rate (CAGR) of 6% from 2025 to 2033 indicates a significant market expansion. Key drivers include the rising need for efficient water purification solutions in both developed and developing nations, the burgeoning fuel cell industry seeking high-performance membranes for energy generation, and the expanding biomedical sector utilizing nanoporous membranes for drug delivery and diagnostics. The diverse material types, including organic, inorganic (ceramics, carbon nanotubes, and graphene), and hybrid membranes, cater to specific application requirements, fostering market segmentation and specialized innovation. Trends such as the development of advanced membrane materials with enhanced selectivity and permeability, coupled with miniaturization technologies, contribute to the market's upward trajectory. However, high manufacturing costs and the need for specialized expertise in membrane fabrication and operation pose potential restraints. The market is geographically diversified, with North America and Asia-Pacific expected to dominate due to significant investments in water treatment infrastructure and technological advancements in these regions. Leading players, including MICRODYN-NADIR GmbH, Hydranautics, and others, are actively engaged in R&D and strategic partnerships to enhance their market share and meet growing demand.
The market's segmentation by application reveals significant potential. Water treatment remains a dominant segment, driven by escalating water scarcity and stringent environmental regulations. Fuel cell applications are witnessing rapid growth due to the increasing focus on renewable energy sources. Biomedical applications are gaining traction, fueled by advancements in drug delivery systems and medical diagnostics. Food processing applications are also exhibiting steady growth, benefiting from the demand for enhanced filtration and purification technologies. Future market dynamics will be shaped by technological innovations, including the development of more sustainable and cost-effective membrane materials, along with government regulations promoting cleaner technologies and sustainable practices. Competition among established players and emerging companies will further intensify, creating opportunities for strategic collaborations and acquisitions.

Nanoporous Membranes Industry Market Report: 2019-2033
This comprehensive report provides an in-depth analysis of the Nanoporous Membranes industry, encompassing market dynamics, growth trends, regional segmentation, product landscape, key players, and future outlook. The study period covers 2019-2033, with 2025 as the base and estimated year. The report is crucial for industry professionals, investors, and researchers seeking a clear understanding of this rapidly evolving market.
Keywords: Nanoporous Membranes, Organic Membranes, Inorganic Membranes, Ceramics, Carbon Nanotubes, Graphene, Hybrid Membranes, Water Treatment, Fuel Cells, Biomedical, Food Processing, Market Size, Market Share, CAGR, Market Growth, Market Analysis, Industry Trends, Key Players, Competitive Landscape, MICRODYN-NADIR GmbH, Hydranautics, SiMPore Inc, InRedox LLC, SUEZ Environnement SA
Nanoporous Membranes Industry Market Dynamics & Structure
The nanoporous membranes market is characterized by moderate concentration, with a few major players holding significant market share. The market is driven by technological advancements in membrane materials and manufacturing processes, particularly in the development of high-performance membranes with enhanced selectivity and permeability. Stringent environmental regulations, particularly concerning water purification and pollution control, are further boosting market growth. However, high initial investment costs and the complexity of membrane fabrication pose significant barriers to entry. Mergers and acquisitions (M&A) activity is relatively frequent, driven by the need for companies to expand their product portfolios and access new technologies. Competition from substitute technologies, such as advanced oxidation processes, also presents a challenge.
Market Concentration: Moderately concentrated, with the top 5 players holding approximately xx% of the market share in 2025 (Estimated).
- Technological Innovation Drivers: Development of novel materials (e.g., graphene, carbon nanotubes), advanced manufacturing techniques (e.g., 3D printing), and improved membrane functionalities (e.g., self-cleaning, antifouling).
- Regulatory Frameworks: Stringent environmental regulations related to water purification and emissions are driving demand.
- Competitive Product Substitutes: Advanced oxidation processes, reverse osmosis, and other filtration technologies present competition.
- End-User Demographics: Key end-users include water treatment plants, pharmaceutical companies, food and beverage manufacturers, and energy producers.
- M&A Trends: A moderate number of M&A deals are observed annually, primarily driven by strategic expansion and technological acquisition. xx M&A deals were recorded between 2019-2024.
Nanoporous Membranes Industry Growth Trends & Insights
The nanoporous membranes market is experiencing robust growth, fueled by escalating demands for clean water and energy, coupled with the expansion of applications across diverse industries. While precise figures for market size and CAGR require further specification (e.g., replace "xx million units" and "xx%"), projections indicate significant expansion from 2025 to 2033. This accelerated adoption stems from technological advancements yielding higher efficiency and lower costs. The increasing awareness of global water scarcity, stringent regulations on industrial wastewater, and a consumer shift towards eco-friendly solutions are key drivers. Furthermore, innovative membrane materials and fabrication techniques are substantially reshaping market dynamics. The market is ripe for disruption and significant expansion in the coming decade.
Dominant Regions, Countries, or Segments in Nanoporous Membranes Industry
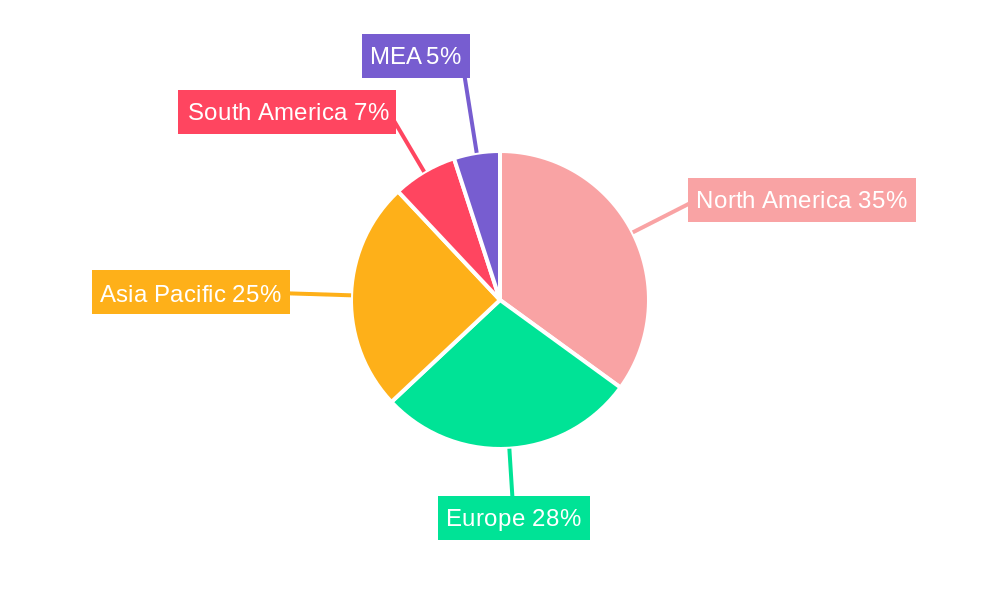
The water treatment sector currently dominates the nanoporous membranes market, commanding an estimated xx% market share in 2025. North America and Europe maintain leading positions due to stringent environmental regulations, established industrial bases, and substantial investments in water treatment infrastructure. However, the Asia-Pacific region presents a compelling growth opportunity, driven by rapid industrialization and urbanization, and a burgeoning need for advanced water purification solutions. This presents significant potential for market entrants and expansion for existing players.
- Leading Segment: Water Treatment (with further segmentation opportunities to be explored, such as desalination, wastewater treatment, etc.)
- Key Regional Drivers:
- North America: Stringent environmental regulations, advanced water treatment infrastructure, and a focus on technological innovation.
- Europe: Similar to North America, with a strong emphasis on sustainable practices and circular economy principles.
- Asia-Pacific: Rapid industrialization, urbanization, increasing water scarcity, and government initiatives promoting water security.
- Material Type Segmentation: Inorganic materials, especially ceramics, currently hold the largest market share. However, organic and hybrid materials are experiencing strong growth, driven by their superior performance characteristics, including enhanced selectivity, durability, and fouling resistance. This segment is expected to witness significant expansion in the coming years.
Nanoporous Membranes Industry Product Landscape
Nanoporous membranes are continuously evolving, with ongoing innovations focusing on enhancing membrane selectivity, permeability, and fouling resistance. Recent advancements include the development of membranes with tailored pore sizes and functionalities, using novel materials like graphene and carbon nanotubes. These advancements have led to improved efficiency and reduced operating costs in various applications, such as water purification, gas separation, and biomedicine. Unique selling propositions include enhanced filtration capacity, durability, and chemical resistance.
Key Drivers, Barriers & Challenges in Nanoporous Membranes Industry
Key Drivers:
- The ever-increasing global demand for clean water and energy-efficient separation technologies.
- Stringent environmental regulations and governmental incentives promoting sustainable practices.
- Continuous technological advancements leading to improved membrane performance, including higher flux, selectivity, and longer operational lifespan.
- Expansion of applications across diverse sectors, including biomedical, food and beverage processing, pharmaceutical, and chemical industries.
Key Challenges and Restraints:
- High initial capital expenditure (CAPEX) associated with membrane production, installation, and infrastructure development.
- Membrane fouling and the resulting reduction in performance over time, requiring regular cleaning and maintenance.
- Complexity in membrane fabrication, demanding precise quality control measures throughout the manufacturing process.
- Competition from alternative water treatment and separation technologies, such as advanced oxidation processes (AOPs) and reverse osmosis (RO).
- Potential supply chain disruptions impacting the availability and cost of raw materials, especially for specialized membrane materials.
Emerging Opportunities in Nanoporous Membranes Industry
Untapped markets in developing economies represent a significant opportunity, along with the growing demand for advanced filtration solutions in emerging applications, such as desalination, gas separation for carbon capture, and personalized medicine. The increasing focus on sustainability and circular economy principles is also opening up new opportunities for environmentally friendly membrane technologies.
Growth Accelerators in the Nanoporous Membranes Industry Industry
Technological breakthroughs, particularly in materials science and membrane fabrication, are accelerating market growth. Strategic partnerships and collaborations between membrane manufacturers and end-users are further boosting innovation and market expansion. Government initiatives promoting sustainable water management and clean energy technologies are also playing a crucial role in driving market expansion.
Key Players Shaping the Nanoporous Membranes Industry Market
- MICRODYN-NADIR GmbH
- Hydranautics A Nitto Group Company
- SiMPore Inc
- InRedox LLC
- SUEZ Environnement SA
- Osmotech Membranes Pvt Ltd
- Hunan Keensen Technology Co Ltd
- Synder Filtration Inc
- AXEON Water Technologies Inc
- inopor GmbH
- BASF SE
- Toray Chemical Korea Inc
- DowDuPont Inc
- Koch Membrane Systems Inc
- SmartMembranes GmbH
- Applied Membranes Inc
- Alfa Laval AB
- Pure-Pro Water Corporation
Notable Milestones in Nanoporous Membranes Industry Sector
- 2020: Introduction of a novel graphene-based membrane by SiMPore Inc., demonstrating significant improvements in water purification efficiency and potentially impacting various separation processes.
- 2022: Partnership between Hydranautics and a major water treatment company to develop customized membrane solutions for large-scale projects, showcasing the growing importance of tailored solutions and collaborative efforts within the industry.
- 2023: Acquisition of a smaller membrane technology company by SUEZ Environnement SA, highlighting the consolidation and expansion efforts within the industry's landscape. This strengthens the market position of larger players.
- (Further milestones to be added based on available data)
In-Depth Nanoporous Membranes Industry Market Outlook
The nanoporous membranes market is poised for sustained growth, driven by the increasing demand for advanced filtration solutions across diverse industries. Strategic investments in research and development, coupled with ongoing technological advancements, will continue to drive innovation and market expansion. Opportunities exist in emerging markets and applications, creating significant potential for market players to capitalize on. The focus on sustainability and environmental protection will further accelerate the adoption of nanoporous membrane technologies in the coming years.
Nanoporous Membranes Industry Segmentation
-
1. Material Type
- 1.1. Organic
- 1.2. Inorgani
- 1.3. Hybrid
-
2. Application
- 2.1. Water Treatment
- 2.2. Fuel Cells
- 2.3. Biomedical
- 2.4. Food Processing
- 2.5. Other Applications
Nanoporous Membranes Industry Segmentation By Geography
-
1. Asia Pacific
- 1.1. China
- 1.2. India
- 1.3. Japan
- 1.4. South Korea
- 1.5. ASEAN Countries
- 1.6. Rest of Asia Pacific
-
2. North America
- 2.1. United States
- 2.2. Canada
- 2.3. Rest of North America
-
3. Europe
- 3.1. Germany
- 3.2. United Kingdom
- 3.3. Italy
- 3.4. France
- 3.5. Spain
- 3.6. Rest of Europe
-
4. South America
- 4.1. Brazil
- 4.2. Argentina
- 4.3. Rest of South America
- 5. Middle East
-
6. Saudi Arabia
- 6.1. South Africa
- 6.2. Rest of Middle East
Nanoporous Membranes Industry REPORT HIGHLIGHTS
| Aspects | Details |
|---|---|
| Study Period | 2019-2033 |
| Base Year | 2024 |
| Estimated Year | 2025 |
| Forecast Period | 2025-2033 |
| Historical Period | 2019-2024 |
| Growth Rate | CAGR of 6% from 2019-2033 |
| Segmentation |
|
Table of Contents
- 1. Introduction
- 1.1. Research Scope
- 1.2. Market Segmentation
- 1.3. Research Methodology
- 1.4. Definitions and Assumptions
- 2. Executive Summary
- 2.1. Introduction
- 3. Market Dynamics
- 3.1. Introduction
- 3.2. Market Drivers
- 3.2.1. ; Growing Need to Treat Wastewater; Rising Water Desalination Activities
- 3.3. Market Restrains
- 3.3.1. ; Low Adoption in the Developing Countries; Poor Fouling Resistance of Nanoporous Membranes; Supply Deficiency of Nanomaterials
- 3.4. Market Trends
- 3.4.1. Growing Demand from Water Treatment Application
- 4. Market Factor Analysis
- 4.1. Porters Five Forces
- 4.2. Supply/Value Chain
- 4.3. PESTEL analysis
- 4.4. Market Entropy
- 4.5. Patent/Trademark Analysis
- 5. Global Nanoporous Membranes Industry Analysis, Insights and Forecast, 2019-2031
- 5.1. Market Analysis, Insights and Forecast - by Material Type
- 5.1.1. Organic
- 5.1.2. Inorgani
- 5.1.3. Hybrid
- 5.2. Market Analysis, Insights and Forecast - by Application
- 5.2.1. Water Treatment
- 5.2.2. Fuel Cells
- 5.2.3. Biomedical
- 5.2.4. Food Processing
- 5.2.5. Other Applications
- 5.3. Market Analysis, Insights and Forecast - by Region
- 5.3.1. Asia Pacific
- 5.3.2. North America
- 5.3.3. Europe
- 5.3.4. South America
- 5.3.5. Middle East
- 5.3.6. Saudi Arabia
- 5.1. Market Analysis, Insights and Forecast - by Material Type
- 6. Asia Pacific Nanoporous Membranes Industry Analysis, Insights and Forecast, 2019-2031
- 6.1. Market Analysis, Insights and Forecast - by Material Type
- 6.1.1. Organic
- 6.1.2. Inorgani
- 6.1.3. Hybrid
- 6.2. Market Analysis, Insights and Forecast - by Application
- 6.2.1. Water Treatment
- 6.2.2. Fuel Cells
- 6.2.3. Biomedical
- 6.2.4. Food Processing
- 6.2.5. Other Applications
- 6.1. Market Analysis, Insights and Forecast - by Material Type
- 7. North America Nanoporous Membranes Industry Analysis, Insights and Forecast, 2019-2031
- 7.1. Market Analysis, Insights and Forecast - by Material Type
- 7.1.1. Organic
- 7.1.2. Inorgani
- 7.1.3. Hybrid
- 7.2. Market Analysis, Insights and Forecast - by Application
- 7.2.1. Water Treatment
- 7.2.2. Fuel Cells
- 7.2.3. Biomedical
- 7.2.4. Food Processing
- 7.2.5. Other Applications
- 7.1. Market Analysis, Insights and Forecast - by Material Type
- 8. Europe Nanoporous Membranes Industry Analysis, Insights and Forecast, 2019-2031
- 8.1. Market Analysis, Insights and Forecast - by Material Type
- 8.1.1. Organic
- 8.1.2. Inorgani
- 8.1.3. Hybrid
- 8.2. Market Analysis, Insights and Forecast - by Application
- 8.2.1. Water Treatment
- 8.2.2. Fuel Cells
- 8.2.3. Biomedical
- 8.2.4. Food Processing
- 8.2.5. Other Applications
- 8.1. Market Analysis, Insights and Forecast - by Material Type
- 9. South America Nanoporous Membranes Industry Analysis, Insights and Forecast, 2019-2031
- 9.1. Market Analysis, Insights and Forecast - by Material Type
- 9.1.1. Organic
- 9.1.2. Inorgani
- 9.1.3. Hybrid
- 9.2. Market Analysis, Insights and Forecast - by Application
- 9.2.1. Water Treatment
- 9.2.2. Fuel Cells
- 9.2.3. Biomedical
- 9.2.4. Food Processing
- 9.2.5. Other Applications
- 9.1. Market Analysis, Insights and Forecast - by Material Type
- 10. Middle East Nanoporous Membranes Industry Analysis, Insights and Forecast, 2019-2031
- 10.1. Market Analysis, Insights and Forecast - by Material Type
- 10.1.1. Organic
- 10.1.2. Inorgani
- 10.1.3. Hybrid
- 10.2. Market Analysis, Insights and Forecast - by Application
- 10.2.1. Water Treatment
- 10.2.2. Fuel Cells
- 10.2.3. Biomedical
- 10.2.4. Food Processing
- 10.2.5. Other Applications
- 10.1. Market Analysis, Insights and Forecast - by Material Type
- 11. Saudi Arabia Nanoporous Membranes Industry Analysis, Insights and Forecast, 2019-2031
- 11.1. Market Analysis, Insights and Forecast - by Material Type
- 11.1.1. Organic
- 11.1.2. Inorgani
- 11.1.3. Hybrid
- 11.2. Market Analysis, Insights and Forecast - by Application
- 11.2.1. Water Treatment
- 11.2.2. Fuel Cells
- 11.2.3. Biomedical
- 11.2.4. Food Processing
- 11.2.5. Other Applications
- 11.1. Market Analysis, Insights and Forecast - by Material Type
- 12. North America Nanoporous Membranes Industry Analysis, Insights and Forecast, 2019-2031
- 12.1. Market Analysis, Insights and Forecast - By Country/Sub-region
- 12.1.1 United States
- 12.1.2 Canada
- 13. Europe Nanoporous Membranes Industry Analysis, Insights and Forecast, 2019-2031
- 13.1. Market Analysis, Insights and Forecast - By Country/Sub-region
- 13.1.1 Germany
- 13.1.2 France
- 13.1.3 Italy
- 13.1.4 United Kingdom
- 13.1.5 Netherlands
- 13.1.6 Rest of Europe
- 14. Asia Pacific Nanoporous Membranes Industry Analysis, Insights and Forecast, 2019-2031
- 14.1. Market Analysis, Insights and Forecast - By Country/Sub-region
- 14.1.1 China
- 14.1.2 Japan
- 14.1.3 India
- 14.1.4 South Korea
- 14.1.5 Taiwan
- 14.1.6 Australia
- 14.1.7 Rest of Asia-Pacific
- 15. South America Nanoporous Membranes Industry Analysis, Insights and Forecast, 2019-2031
- 15.1. Market Analysis, Insights and Forecast - By Country/Sub-region
- 15.1.1 Brazil
- 15.1.2 Argentina
- 15.1.3 Rest of South America
- 16. MEA Nanoporous Membranes Industry Analysis, Insights and Forecast, 2019-2031
- 16.1. Market Analysis, Insights and Forecast - By Country/Sub-region
- 16.1.1 Middle East
- 16.1.2 Africa
- 17. Competitive Analysis
- 17.1. Global Market Share Analysis 2024
- 17.2. Company Profiles
- 17.2.1 MICRODYN-NADIR GmbH
- 17.2.1.1. Overview
- 17.2.1.2. Products
- 17.2.1.3. SWOT Analysis
- 17.2.1.4. Recent Developments
- 17.2.1.5. Financials (Based on Availability)
- 17.2.2 Hydranautics A Nitto Group Company
- 17.2.2.1. Overview
- 17.2.2.2. Products
- 17.2.2.3. SWOT Analysis
- 17.2.2.4. Recent Developments
- 17.2.2.5. Financials (Based on Availability)
- 17.2.3 SiMPore Inc
- 17.2.3.1. Overview
- 17.2.3.2. Products
- 17.2.3.3. SWOT Analysis
- 17.2.3.4. Recent Developments
- 17.2.3.5. Financials (Based on Availability)
- 17.2.4 InRedox LLC
- 17.2.4.1. Overview
- 17.2.4.2. Products
- 17.2.4.3. SWOT Analysis
- 17.2.4.4. Recent Developments
- 17.2.4.5. Financials (Based on Availability)
- 17.2.5 SUEZ Environnement SA
- 17.2.5.1. Overview
- 17.2.5.2. Products
- 17.2.5.3. SWOT Analysis
- 17.2.5.4. Recent Developments
- 17.2.5.5. Financials (Based on Availability)
- 17.2.6 Osmotech Membranes Pvt Ltd
- 17.2.6.1. Overview
- 17.2.6.2. Products
- 17.2.6.3. SWOT Analysis
- 17.2.6.4. Recent Developments
- 17.2.6.5. Financials (Based on Availability)
- 17.2.7 Hunan Keensen Technology Co Ltd
- 17.2.7.1. Overview
- 17.2.7.2. Products
- 17.2.7.3. SWOT Analysis
- 17.2.7.4. Recent Developments
- 17.2.7.5. Financials (Based on Availability)
- 17.2.8 Synder Filtration Inc
- 17.2.8.1. Overview
- 17.2.8.2. Products
- 17.2.8.3. SWOT Analysis
- 17.2.8.4. Recent Developments
- 17.2.8.5. Financials (Based on Availability)
- 17.2.9 AXEON Water Technologies Inc
- 17.2.9.1. Overview
- 17.2.9.2. Products
- 17.2.9.3. SWOT Analysis
- 17.2.9.4. Recent Developments
- 17.2.9.5. Financials (Based on Availability)
- 17.2.10 inopor GmbH
- 17.2.10.1. Overview
- 17.2.10.2. Products
- 17.2.10.3. SWOT Analysis
- 17.2.10.4. Recent Developments
- 17.2.10.5. Financials (Based on Availability)
- 17.2.11 BASF SE
- 17.2.11.1. Overview
- 17.2.11.2. Products
- 17.2.11.3. SWOT Analysis
- 17.2.11.4. Recent Developments
- 17.2.11.5. Financials (Based on Availability)
- 17.2.12 Toray Chemical Korea Inc
- 17.2.12.1. Overview
- 17.2.12.2. Products
- 17.2.12.3. SWOT Analysis
- 17.2.12.4. Recent Developments
- 17.2.12.5. Financials (Based on Availability)
- 17.2.13 DowDuPont Inc
- 17.2.13.1. Overview
- 17.2.13.2. Products
- 17.2.13.3. SWOT Analysis
- 17.2.13.4. Recent Developments
- 17.2.13.5. Financials (Based on Availability)
- 17.2.14 Koch Membrane Systems Inc
- 17.2.14.1. Overview
- 17.2.14.2. Products
- 17.2.14.3. SWOT Analysis
- 17.2.14.4. Recent Developments
- 17.2.14.5. Financials (Based on Availability)
- 17.2.15 SmartMembranes GmbH
- 17.2.15.1. Overview
- 17.2.15.2. Products
- 17.2.15.3. SWOT Analysis
- 17.2.15.4. Recent Developments
- 17.2.15.5. Financials (Based on Availability)
- 17.2.16 Applied Membranes Inc
- 17.2.16.1. Overview
- 17.2.16.2. Products
- 17.2.16.3. SWOT Analysis
- 17.2.16.4. Recent Developments
- 17.2.16.5. Financials (Based on Availability)
- 17.2.17 Alfa Laval AB
- 17.2.17.1. Overview
- 17.2.17.2. Products
- 17.2.17.3. SWOT Analysis
- 17.2.17.4. Recent Developments
- 17.2.17.5. Financials (Based on Availability)
- 17.2.18 Pure-Pro Water Corporation
- 17.2.18.1. Overview
- 17.2.18.2. Products
- 17.2.18.3. SWOT Analysis
- 17.2.18.4. Recent Developments
- 17.2.18.5. Financials (Based on Availability)
- 17.2.1 MICRODYN-NADIR GmbH
List of Figures
- Figure 1: Global Nanoporous Membranes Industry Revenue Breakdown (Million, %) by Region 2024 & 2032
- Figure 2: Global Nanoporous Membranes Industry Volume Breakdown (K Units, %) by Region 2024 & 2032
- Figure 3: North America Nanoporous Membranes Industry Revenue (Million), by Country 2024 & 2032
- Figure 4: North America Nanoporous Membranes Industry Volume (K Units), by Country 2024 & 2032
- Figure 5: North America Nanoporous Membranes Industry Revenue Share (%), by Country 2024 & 2032
- Figure 6: North America Nanoporous Membranes Industry Volume Share (%), by Country 2024 & 2032
- Figure 7: Europe Nanoporous Membranes Industry Revenue (Million), by Country 2024 & 2032
- Figure 8: Europe Nanoporous Membranes Industry Volume (K Units), by Country 2024 & 2032
- Figure 9: Europe Nanoporous Membranes Industry Revenue Share (%), by Country 2024 & 2032
- Figure 10: Europe Nanoporous Membranes Industry Volume Share (%), by Country 2024 & 2032
- Figure 11: Asia Pacific Nanoporous Membranes Industry Revenue (Million), by Country 2024 & 2032
- Figure 12: Asia Pacific Nanoporous Membranes Industry Volume (K Units), by Country 2024 & 2032
- Figure 13: Asia Pacific Nanoporous Membranes Industry Revenue Share (%), by Country 2024 & 2032
- Figure 14: Asia Pacific Nanoporous Membranes Industry Volume Share (%), by Country 2024 & 2032
- Figure 15: South America Nanoporous Membranes Industry Revenue (Million), by Country 2024 & 2032
- Figure 16: South America Nanoporous Membranes Industry Volume (K Units), by Country 2024 & 2032
- Figure 17: South America Nanoporous Membranes Industry Revenue Share (%), by Country 2024 & 2032
- Figure 18: South America Nanoporous Membranes Industry Volume Share (%), by Country 2024 & 2032
- Figure 19: MEA Nanoporous Membranes Industry Revenue (Million), by Country 2024 & 2032
- Figure 20: MEA Nanoporous Membranes Industry Volume (K Units), by Country 2024 & 2032
- Figure 21: MEA Nanoporous Membranes Industry Revenue Share (%), by Country 2024 & 2032
- Figure 22: MEA Nanoporous Membranes Industry Volume Share (%), by Country 2024 & 2032
- Figure 23: Asia Pacific Nanoporous Membranes Industry Revenue (Million), by Material Type 2024 & 2032
- Figure 24: Asia Pacific Nanoporous Membranes Industry Volume (K Units), by Material Type 2024 & 2032
- Figure 25: Asia Pacific Nanoporous Membranes Industry Revenue Share (%), by Material Type 2024 & 2032
- Figure 26: Asia Pacific Nanoporous Membranes Industry Volume Share (%), by Material Type 2024 & 2032
- Figure 27: Asia Pacific Nanoporous Membranes Industry Revenue (Million), by Application 2024 & 2032
- Figure 28: Asia Pacific Nanoporous Membranes Industry Volume (K Units), by Application 2024 & 2032
- Figure 29: Asia Pacific Nanoporous Membranes Industry Revenue Share (%), by Application 2024 & 2032
- Figure 30: Asia Pacific Nanoporous Membranes Industry Volume Share (%), by Application 2024 & 2032
- Figure 31: Asia Pacific Nanoporous Membranes Industry Revenue (Million), by Country 2024 & 2032
- Figure 32: Asia Pacific Nanoporous Membranes Industry Volume (K Units), by Country 2024 & 2032
- Figure 33: Asia Pacific Nanoporous Membranes Industry Revenue Share (%), by Country 2024 & 2032
- Figure 34: Asia Pacific Nanoporous Membranes Industry Volume Share (%), by Country 2024 & 2032
- Figure 35: North America Nanoporous Membranes Industry Revenue (Million), by Material Type 2024 & 2032
- Figure 36: North America Nanoporous Membranes Industry Volume (K Units), by Material Type 2024 & 2032
- Figure 37: North America Nanoporous Membranes Industry Revenue Share (%), by Material Type 2024 & 2032
- Figure 38: North America Nanoporous Membranes Industry Volume Share (%), by Material Type 2024 & 2032
- Figure 39: North America Nanoporous Membranes Industry Revenue (Million), by Application 2024 & 2032
- Figure 40: North America Nanoporous Membranes Industry Volume (K Units), by Application 2024 & 2032
- Figure 41: North America Nanoporous Membranes Industry Revenue Share (%), by Application 2024 & 2032
- Figure 42: North America Nanoporous Membranes Industry Volume Share (%), by Application 2024 & 2032
- Figure 43: North America Nanoporous Membranes Industry Revenue (Million), by Country 2024 & 2032
- Figure 44: North America Nanoporous Membranes Industry Volume (K Units), by Country 2024 & 2032
- Figure 45: North America Nanoporous Membranes Industry Revenue Share (%), by Country 2024 & 2032
- Figure 46: North America Nanoporous Membranes Industry Volume Share (%), by Country 2024 & 2032
- Figure 47: Europe Nanoporous Membranes Industry Revenue (Million), by Material Type 2024 & 2032
- Figure 48: Europe Nanoporous Membranes Industry Volume (K Units), by Material Type 2024 & 2032
- Figure 49: Europe Nanoporous Membranes Industry Revenue Share (%), by Material Type 2024 & 2032
- Figure 50: Europe Nanoporous Membranes Industry Volume Share (%), by Material Type 2024 & 2032
- Figure 51: Europe Nanoporous Membranes Industry Revenue (Million), by Application 2024 & 2032
- Figure 52: Europe Nanoporous Membranes Industry Volume (K Units), by Application 2024 & 2032
- Figure 53: Europe Nanoporous Membranes Industry Revenue Share (%), by Application 2024 & 2032
- Figure 54: Europe Nanoporous Membranes Industry Volume Share (%), by Application 2024 & 2032
- Figure 55: Europe Nanoporous Membranes Industry Revenue (Million), by Country 2024 & 2032
- Figure 56: Europe Nanoporous Membranes Industry Volume (K Units), by Country 2024 & 2032
- Figure 57: Europe Nanoporous Membranes Industry Revenue Share (%), by Country 2024 & 2032
- Figure 58: Europe Nanoporous Membranes Industry Volume Share (%), by Country 2024 & 2032
- Figure 59: South America Nanoporous Membranes Industry Revenue (Million), by Material Type 2024 & 2032
- Figure 60: South America Nanoporous Membranes Industry Volume (K Units), by Material Type 2024 & 2032
- Figure 61: South America Nanoporous Membranes Industry Revenue Share (%), by Material Type 2024 & 2032
- Figure 62: South America Nanoporous Membranes Industry Volume Share (%), by Material Type 2024 & 2032
- Figure 63: South America Nanoporous Membranes Industry Revenue (Million), by Application 2024 & 2032
- Figure 64: South America Nanoporous Membranes Industry Volume (K Units), by Application 2024 & 2032
- Figure 65: South America Nanoporous Membranes Industry Revenue Share (%), by Application 2024 & 2032
- Figure 66: South America Nanoporous Membranes Industry Volume Share (%), by Application 2024 & 2032
- Figure 67: South America Nanoporous Membranes Industry Revenue (Million), by Country 2024 & 2032
- Figure 68: South America Nanoporous Membranes Industry Volume (K Units), by Country 2024 & 2032
- Figure 69: South America Nanoporous Membranes Industry Revenue Share (%), by Country 2024 & 2032
- Figure 70: South America Nanoporous Membranes Industry Volume Share (%), by Country 2024 & 2032
- Figure 71: Middle East Nanoporous Membranes Industry Revenue (Million), by Material Type 2024 & 2032
- Figure 72: Middle East Nanoporous Membranes Industry Volume (K Units), by Material Type 2024 & 2032
- Figure 73: Middle East Nanoporous Membranes Industry Revenue Share (%), by Material Type 2024 & 2032
- Figure 74: Middle East Nanoporous Membranes Industry Volume Share (%), by Material Type 2024 & 2032
- Figure 75: Middle East Nanoporous Membranes Industry Revenue (Million), by Application 2024 & 2032
- Figure 76: Middle East Nanoporous Membranes Industry Volume (K Units), by Application 2024 & 2032
- Figure 77: Middle East Nanoporous Membranes Industry Revenue Share (%), by Application 2024 & 2032
- Figure 78: Middle East Nanoporous Membranes Industry Volume Share (%), by Application 2024 & 2032
- Figure 79: Middle East Nanoporous Membranes Industry Revenue (Million), by Country 2024 & 2032
- Figure 80: Middle East Nanoporous Membranes Industry Volume (K Units), by Country 2024 & 2032
- Figure 81: Middle East Nanoporous Membranes Industry Revenue Share (%), by Country 2024 & 2032
- Figure 82: Middle East Nanoporous Membranes Industry Volume Share (%), by Country 2024 & 2032
- Figure 83: Saudi Arabia Nanoporous Membranes Industry Revenue (Million), by Material Type 2024 & 2032
- Figure 84: Saudi Arabia Nanoporous Membranes Industry Volume (K Units), by Material Type 2024 & 2032
- Figure 85: Saudi Arabia Nanoporous Membranes Industry Revenue Share (%), by Material Type 2024 & 2032
- Figure 86: Saudi Arabia Nanoporous Membranes Industry Volume Share (%), by Material Type 2024 & 2032
- Figure 87: Saudi Arabia Nanoporous Membranes Industry Revenue (Million), by Application 2024 & 2032
- Figure 88: Saudi Arabia Nanoporous Membranes Industry Volume (K Units), by Application 2024 & 2032
- Figure 89: Saudi Arabia Nanoporous Membranes Industry Revenue Share (%), by Application 2024 & 2032
- Figure 90: Saudi Arabia Nanoporous Membranes Industry Volume Share (%), by Application 2024 & 2032
- Figure 91: Saudi Arabia Nanoporous Membranes Industry Revenue (Million), by Country 2024 & 2032
- Figure 92: Saudi Arabia Nanoporous Membranes Industry Volume (K Units), by Country 2024 & 2032
- Figure 93: Saudi Arabia Nanoporous Membranes Industry Revenue Share (%), by Country 2024 & 2032
- Figure 94: Saudi Arabia Nanoporous Membranes Industry Volume Share (%), by Country 2024 & 2032
List of Tables
- Table 1: Global Nanoporous Membranes Industry Revenue Million Forecast, by Region 2019 & 2032
- Table 2: Global Nanoporous Membranes Industry Volume K Units Forecast, by Region 2019 & 2032
- Table 3: Global Nanoporous Membranes Industry Revenue Million Forecast, by Material Type 2019 & 2032
- Table 4: Global Nanoporous Membranes Industry Volume K Units Forecast, by Material Type 2019 & 2032
- Table 5: Global Nanoporous Membranes Industry Revenue Million Forecast, by Application 2019 & 2032
- Table 6: Global Nanoporous Membranes Industry Volume K Units Forecast, by Application 2019 & 2032
- Table 7: Global Nanoporous Membranes Industry Revenue Million Forecast, by Region 2019 & 2032
- Table 8: Global Nanoporous Membranes Industry Volume K Units Forecast, by Region 2019 & 2032
- Table 9: Global Nanoporous Membranes Industry Revenue Million Forecast, by Country 2019 & 2032
- Table 10: Global Nanoporous Membranes Industry Volume K Units Forecast, by Country 2019 & 2032
- Table 11: United States Nanoporous Membranes Industry Revenue (Million) Forecast, by Application 2019 & 2032
- Table 12: United States Nanoporous Membranes Industry Volume (K Units) Forecast, by Application 2019 & 2032
- Table 13: Canada Nanoporous Membranes Industry Revenue (Million) Forecast, by Application 2019 & 2032
- Table 14: Canada Nanoporous Membranes Industry Volume (K Units) Forecast, by Application 2019 & 2032
- Table 15: Global Nanoporous Membranes Industry Revenue Million Forecast, by Country 2019 & 2032
- Table 16: Global Nanoporous Membranes Industry Volume K Units Forecast, by Country 2019 & 2032
- Table 17: Germany Nanoporous Membranes Industry Revenue (Million) Forecast, by Application 2019 & 2032
- Table 18: Germany Nanoporous Membranes Industry Volume (K Units) Forecast, by Application 2019 & 2032
- Table 19: France Nanoporous Membranes Industry Revenue (Million) Forecast, by Application 2019 & 2032
- Table 20: France Nanoporous Membranes Industry Volume (K Units) Forecast, by Application 2019 & 2032
- Table 21: Italy Nanoporous Membranes Industry Revenue (Million) Forecast, by Application 2019 & 2032
- Table 22: Italy Nanoporous Membranes Industry Volume (K Units) Forecast, by Application 2019 & 2032
- Table 23: United Kingdom Nanoporous Membranes Industry Revenue (Million) Forecast, by Application 2019 & 2032
- Table 24: United Kingdom Nanoporous Membranes Industry Volume (K Units) Forecast, by Application 2019 & 2032
- Table 25: Netherlands Nanoporous Membranes Industry Revenue (Million) Forecast, by Application 2019 & 2032
- Table 26: Netherlands Nanoporous Membranes Industry Volume (K Units) Forecast, by Application 2019 & 2032
- Table 27: Rest of Europe Nanoporous Membranes Industry Revenue (Million) Forecast, by Application 2019 & 2032
- Table 28: Rest of Europe Nanoporous Membranes Industry Volume (K Units) Forecast, by Application 2019 & 2032
- Table 29: Global Nanoporous Membranes Industry Revenue Million Forecast, by Country 2019 & 2032
- Table 30: Global Nanoporous Membranes Industry Volume K Units Forecast, by Country 2019 & 2032
- Table 31: China Nanoporous Membranes Industry Revenue (Million) Forecast, by Application 2019 & 2032
- Table 32: China Nanoporous Membranes Industry Volume (K Units) Forecast, by Application 2019 & 2032
- Table 33: Japan Nanoporous Membranes Industry Revenue (Million) Forecast, by Application 2019 & 2032
- Table 34: Japan Nanoporous Membranes Industry Volume (K Units) Forecast, by Application 2019 & 2032
- Table 35: India Nanoporous Membranes Industry Revenue (Million) Forecast, by Application 2019 & 2032
- Table 36: India Nanoporous Membranes Industry Volume (K Units) Forecast, by Application 2019 & 2032
- Table 37: South Korea Nanoporous Membranes Industry Revenue (Million) Forecast, by Application 2019 & 2032
- Table 38: South Korea Nanoporous Membranes Industry Volume (K Units) Forecast, by Application 2019 & 2032
- Table 39: Taiwan Nanoporous Membranes Industry Revenue (Million) Forecast, by Application 2019 & 2032
- Table 40: Taiwan Nanoporous Membranes Industry Volume (K Units) Forecast, by Application 2019 & 2032
- Table 41: Australia Nanoporous Membranes Industry Revenue (Million) Forecast, by Application 2019 & 2032
- Table 42: Australia Nanoporous Membranes Industry Volume (K Units) Forecast, by Application 2019 & 2032
- Table 43: Rest of Asia-Pacific Nanoporous Membranes Industry Revenue (Million) Forecast, by Application 2019 & 2032
- Table 44: Rest of Asia-Pacific Nanoporous Membranes Industry Volume (K Units) Forecast, by Application 2019 & 2032
- Table 45: Global Nanoporous Membranes Industry Revenue Million Forecast, by Country 2019 & 2032
- Table 46: Global Nanoporous Membranes Industry Volume K Units Forecast, by Country 2019 & 2032
- Table 47: Brazil Nanoporous Membranes Industry Revenue (Million) Forecast, by Application 2019 & 2032
- Table 48: Brazil Nanoporous Membranes Industry Volume (K Units) Forecast, by Application 2019 & 2032
- Table 49: Argentina Nanoporous Membranes Industry Revenue (Million) Forecast, by Application 2019 & 2032
- Table 50: Argentina Nanoporous Membranes Industry Volume (K Units) Forecast, by Application 2019 & 2032
- Table 51: Rest of South America Nanoporous Membranes Industry Revenue (Million) Forecast, by Application 2019 & 2032
- Table 52: Rest of South America Nanoporous Membranes Industry Volume (K Units) Forecast, by Application 2019 & 2032
- Table 53: Global Nanoporous Membranes Industry Revenue Million Forecast, by Country 2019 & 2032
- Table 54: Global Nanoporous Membranes Industry Volume K Units Forecast, by Country 2019 & 2032
- Table 55: Middle East Nanoporous Membranes Industry Revenue (Million) Forecast, by Application 2019 & 2032
- Table 56: Middle East Nanoporous Membranes Industry Volume (K Units) Forecast, by Application 2019 & 2032
- Table 57: Africa Nanoporous Membranes Industry Revenue (Million) Forecast, by Application 2019 & 2032
- Table 58: Africa Nanoporous Membranes Industry Volume (K Units) Forecast, by Application 2019 & 2032
- Table 59: Global Nanoporous Membranes Industry Revenue Million Forecast, by Material Type 2019 & 2032
- Table 60: Global Nanoporous Membranes Industry Volume K Units Forecast, by Material Type 2019 & 2032
- Table 61: Global Nanoporous Membranes Industry Revenue Million Forecast, by Application 2019 & 2032
- Table 62: Global Nanoporous Membranes Industry Volume K Units Forecast, by Application 2019 & 2032
- Table 63: Global Nanoporous Membranes Industry Revenue Million Forecast, by Country 2019 & 2032
- Table 64: Global Nanoporous Membranes Industry Volume K Units Forecast, by Country 2019 & 2032
- Table 65: China Nanoporous Membranes Industry Revenue (Million) Forecast, by Application 2019 & 2032
- Table 66: China Nanoporous Membranes Industry Volume (K Units) Forecast, by Application 2019 & 2032
- Table 67: India Nanoporous Membranes Industry Revenue (Million) Forecast, by Application 2019 & 2032
- Table 68: India Nanoporous Membranes Industry Volume (K Units) Forecast, by Application 2019 & 2032
- Table 69: Japan Nanoporous Membranes Industry Revenue (Million) Forecast, by Application 2019 & 2032
- Table 70: Japan Nanoporous Membranes Industry Volume (K Units) Forecast, by Application 2019 & 2032
- Table 71: South Korea Nanoporous Membranes Industry Revenue (Million) Forecast, by Application 2019 & 2032
- Table 72: South Korea Nanoporous Membranes Industry Volume (K Units) Forecast, by Application 2019 & 2032
- Table 73: ASEAN Countries Nanoporous Membranes Industry Revenue (Million) Forecast, by Application 2019 & 2032
- Table 74: ASEAN Countries Nanoporous Membranes Industry Volume (K Units) Forecast, by Application 2019 & 2032
- Table 75: Rest of Asia Pacific Nanoporous Membranes Industry Revenue (Million) Forecast, by Application 2019 & 2032
- Table 76: Rest of Asia Pacific Nanoporous Membranes Industry Volume (K Units) Forecast, by Application 2019 & 2032
- Table 77: Global Nanoporous Membranes Industry Revenue Million Forecast, by Material Type 2019 & 2032
- Table 78: Global Nanoporous Membranes Industry Volume K Units Forecast, by Material Type 2019 & 2032
- Table 79: Global Nanoporous Membranes Industry Revenue Million Forecast, by Application 2019 & 2032
- Table 80: Global Nanoporous Membranes Industry Volume K Units Forecast, by Application 2019 & 2032
- Table 81: Global Nanoporous Membranes Industry Revenue Million Forecast, by Country 2019 & 2032
- Table 82: Global Nanoporous Membranes Industry Volume K Units Forecast, by Country 2019 & 2032
- Table 83: United States Nanoporous Membranes Industry Revenue (Million) Forecast, by Application 2019 & 2032
- Table 84: United States Nanoporous Membranes Industry Volume (K Units) Forecast, by Application 2019 & 2032
- Table 85: Canada Nanoporous Membranes Industry Revenue (Million) Forecast, by Application 2019 & 2032
- Table 86: Canada Nanoporous Membranes Industry Volume (K Units) Forecast, by Application 2019 & 2032
- Table 87: Rest of North America Nanoporous Membranes Industry Revenue (Million) Forecast, by Application 2019 & 2032
- Table 88: Rest of North America Nanoporous Membranes Industry Volume (K Units) Forecast, by Application 2019 & 2032
- Table 89: Global Nanoporous Membranes Industry Revenue Million Forecast, by Material Type 2019 & 2032
- Table 90: Global Nanoporous Membranes Industry Volume K Units Forecast, by Material Type 2019 & 2032
- Table 91: Global Nanoporous Membranes Industry Revenue Million Forecast, by Application 2019 & 2032
- Table 92: Global Nanoporous Membranes Industry Volume K Units Forecast, by Application 2019 & 2032
- Table 93: Global Nanoporous Membranes Industry Revenue Million Forecast, by Country 2019 & 2032
- Table 94: Global Nanoporous Membranes Industry Volume K Units Forecast, by Country 2019 & 2032
- Table 95: Germany Nanoporous Membranes Industry Revenue (Million) Forecast, by Application 2019 & 2032
- Table 96: Germany Nanoporous Membranes Industry Volume (K Units) Forecast, by Application 2019 & 2032
- Table 97: United Kingdom Nanoporous Membranes Industry Revenue (Million) Forecast, by Application 2019 & 2032
- Table 98: United Kingdom Nanoporous Membranes Industry Volume (K Units) Forecast, by Application 2019 & 2032
- Table 99: Italy Nanoporous Membranes Industry Revenue (Million) Forecast, by Application 2019 & 2032
- Table 100: Italy Nanoporous Membranes Industry Volume (K Units) Forecast, by Application 2019 & 2032
- Table 101: France Nanoporous Membranes Industry Revenue (Million) Forecast, by Application 2019 & 2032
- Table 102: France Nanoporous Membranes Industry Volume (K Units) Forecast, by Application 2019 & 2032
- Table 103: Spain Nanoporous Membranes Industry Revenue (Million) Forecast, by Application 2019 & 2032
- Table 104: Spain Nanoporous Membranes Industry Volume (K Units) Forecast, by Application 2019 & 2032
- Table 105: Rest of Europe Nanoporous Membranes Industry Revenue (Million) Forecast, by Application 2019 & 2032
- Table 106: Rest of Europe Nanoporous Membranes Industry Volume (K Units) Forecast, by Application 2019 & 2032
- Table 107: Global Nanoporous Membranes Industry Revenue Million Forecast, by Material Type 2019 & 2032
- Table 108: Global Nanoporous Membranes Industry Volume K Units Forecast, by Material Type 2019 & 2032
- Table 109: Global Nanoporous Membranes Industry Revenue Million Forecast, by Application 2019 & 2032
- Table 110: Global Nanoporous Membranes Industry Volume K Units Forecast, by Application 2019 & 2032
- Table 111: Global Nanoporous Membranes Industry Revenue Million Forecast, by Country 2019 & 2032
- Table 112: Global Nanoporous Membranes Industry Volume K Units Forecast, by Country 2019 & 2032
- Table 113: Brazil Nanoporous Membranes Industry Revenue (Million) Forecast, by Application 2019 & 2032
- Table 114: Brazil Nanoporous Membranes Industry Volume (K Units) Forecast, by Application 2019 & 2032
- Table 115: Argentina Nanoporous Membranes Industry Revenue (Million) Forecast, by Application 2019 & 2032
- Table 116: Argentina Nanoporous Membranes Industry Volume (K Units) Forecast, by Application 2019 & 2032
- Table 117: Rest of South America Nanoporous Membranes Industry Revenue (Million) Forecast, by Application 2019 & 2032
- Table 118: Rest of South America Nanoporous Membranes Industry Volume (K Units) Forecast, by Application 2019 & 2032
- Table 119: Global Nanoporous Membranes Industry Revenue Million Forecast, by Material Type 2019 & 2032
- Table 120: Global Nanoporous Membranes Industry Volume K Units Forecast, by Material Type 2019 & 2032
- Table 121: Global Nanoporous Membranes Industry Revenue Million Forecast, by Application 2019 & 2032
- Table 122: Global Nanoporous Membranes Industry Volume K Units Forecast, by Application 2019 & 2032
- Table 123: Global Nanoporous Membranes Industry Revenue Million Forecast, by Country 2019 & 2032
- Table 124: Global Nanoporous Membranes Industry Volume K Units Forecast, by Country 2019 & 2032
- Table 125: Global Nanoporous Membranes Industry Revenue Million Forecast, by Material Type 2019 & 2032
- Table 126: Global Nanoporous Membranes Industry Volume K Units Forecast, by Material Type 2019 & 2032
- Table 127: Global Nanoporous Membranes Industry Revenue Million Forecast, by Application 2019 & 2032
- Table 128: Global Nanoporous Membranes Industry Volume K Units Forecast, by Application 2019 & 2032
- Table 129: Global Nanoporous Membranes Industry Revenue Million Forecast, by Country 2019 & 2032
- Table 130: Global Nanoporous Membranes Industry Volume K Units Forecast, by Country 2019 & 2032
- Table 131: South Africa Nanoporous Membranes Industry Revenue (Million) Forecast, by Application 2019 & 2032
- Table 132: South Africa Nanoporous Membranes Industry Volume (K Units) Forecast, by Application 2019 & 2032
- Table 133: Rest of Middle East Nanoporous Membranes Industry Revenue (Million) Forecast, by Application 2019 & 2032
- Table 134: Rest of Middle East Nanoporous Membranes Industry Volume (K Units) Forecast, by Application 2019 & 2032
Frequently Asked Questions
1. What is the projected Compound Annual Growth Rate (CAGR) of the Nanoporous Membranes Industry?
The projected CAGR is approximately 6%.
2. Which companies are prominent players in the Nanoporous Membranes Industry?
Key companies in the market include MICRODYN-NADIR GmbH, Hydranautics A Nitto Group Company, SiMPore Inc, InRedox LLC, SUEZ Environnement SA, Osmotech Membranes Pvt Ltd, Hunan Keensen Technology Co Ltd, Synder Filtration Inc, AXEON Water Technologies Inc, inopor GmbH, BASF SE, Toray Chemical Korea Inc, DowDuPont Inc, Koch Membrane Systems Inc, SmartMembranes GmbH, Applied Membranes Inc, Alfa Laval AB, Pure-Pro Water Corporation.
3. What are the main segments of the Nanoporous Membranes Industry?
The market segments include Material Type, Application.
4. Can you provide details about the market size?
The market size is estimated to be USD 871.3 Million as of 2022.
5. What are some drivers contributing to market growth?
; Growing Need to Treat Wastewater; Rising Water Desalination Activities.
6. What are the notable trends driving market growth?
Growing Demand from Water Treatment Application.
7. Are there any restraints impacting market growth?
; Low Adoption in the Developing Countries; Poor Fouling Resistance of Nanoporous Membranes; Supply Deficiency of Nanomaterials.
8. Can you provide examples of recent developments in the market?
N/A
9. What pricing options are available for accessing the report?
Pricing options include single-user, multi-user, and enterprise licenses priced at USD 4750, USD 5250, and USD 8750 respectively.
10. Is the market size provided in terms of value or volume?
The market size is provided in terms of value, measured in Million and volume, measured in K Units.
11. Are there any specific market keywords associated with the report?
Yes, the market keyword associated with the report is "Nanoporous Membranes Industry," which aids in identifying and referencing the specific market segment covered.
12. How do I determine which pricing option suits my needs best?
The pricing options vary based on user requirements and access needs. Individual users may opt for single-user licenses, while businesses requiring broader access may choose multi-user or enterprise licenses for cost-effective access to the report.
13. Are there any additional resources or data provided in the Nanoporous Membranes Industry report?
While the report offers comprehensive insights, it's advisable to review the specific contents or supplementary materials provided to ascertain if additional resources or data are available.
14. How can I stay updated on further developments or reports in the Nanoporous Membranes Industry?
To stay informed about further developments, trends, and reports in the Nanoporous Membranes Industry, consider subscribing to industry newsletters, following relevant companies and organizations, or regularly checking reputable industry news sources and publications.
Methodology
Step 1 - Identification of Relevant Samples Size from Population Database


Step 2 - Approaches for Defining Global Market Size (Value, Volume* & Price*)

Note*: In applicable scenarios
Step 3 - Data Sources
Primary Research
- Web Analytics
- Survey Reports
- Research Institute
- Latest Research Reports
- Opinion Leaders
Secondary Research
- Annual Reports
- White Paper
- Latest Press Release
- Industry Association
- Paid Database
- Investor Presentations

Step 4 - Data Triangulation
Involves using different sources of information in order to increase the validity of a study
These sources are likely to be stakeholders in a program - participants, other researchers, program staff, other community members, and so on.
Then we put all data in single framework & apply various statistical tools to find out the dynamic on the market.
During the analysis stage, feedback from the stakeholder groups would be compared to determine areas of agreement as well as areas of divergence


