
Key Insights
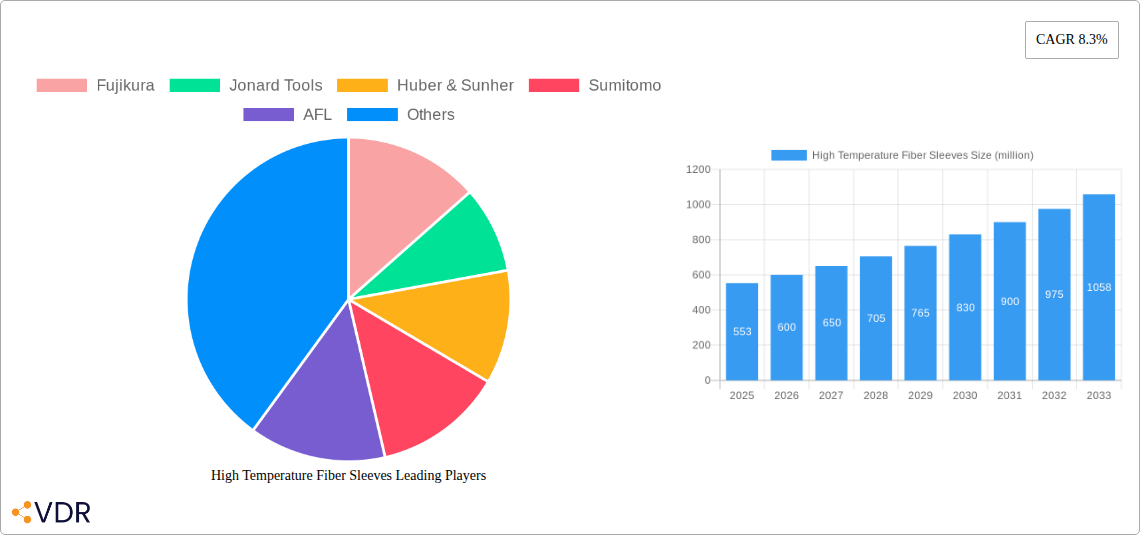
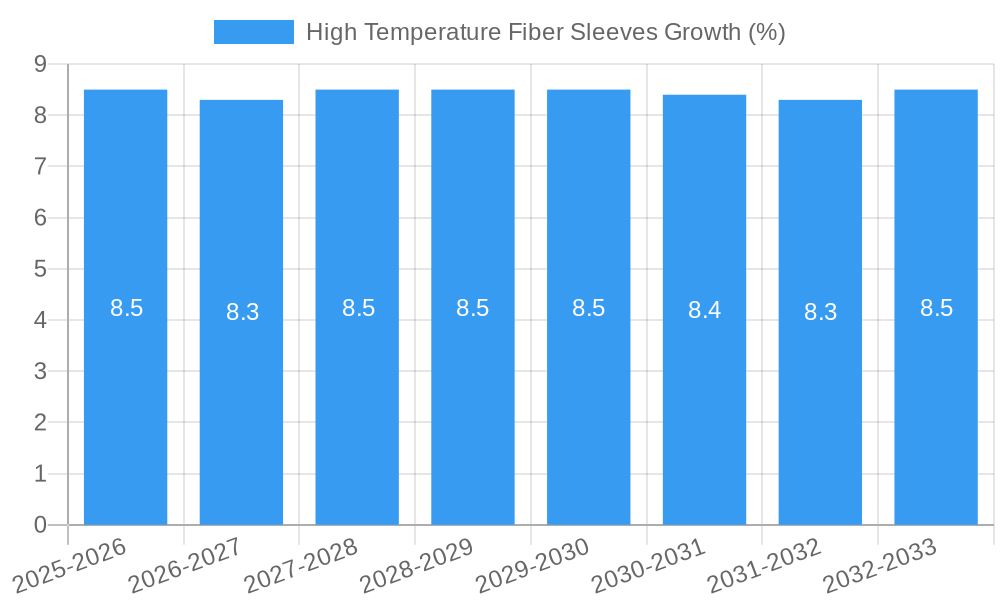
The global market for High Temperature Fiber Sleeves is poised for significant expansion, projected to reach a substantial valuation. Driven by the increasing demand for robust and reliable fiber optic solutions in harsh environments, the market is expected to grow at a Compound Annual Growth Rate (CAGR) of 8.3% over the forecast period of 2025-2033. This upward trajectory is fueled by the escalating adoption of high-speed communication networks, the expanding telecommunications infrastructure globally, and the critical need for protective solutions in industries like petroleum, chemical processing, and industrial automation where extreme temperatures and corrosive elements are prevalent. The Communications Equipment segment is anticipated to be a primary growth engine, underscoring the critical role of these sleeves in safeguarding sensitive fiber optic cabling essential for 5G deployment, data centers, and broader network resilience.
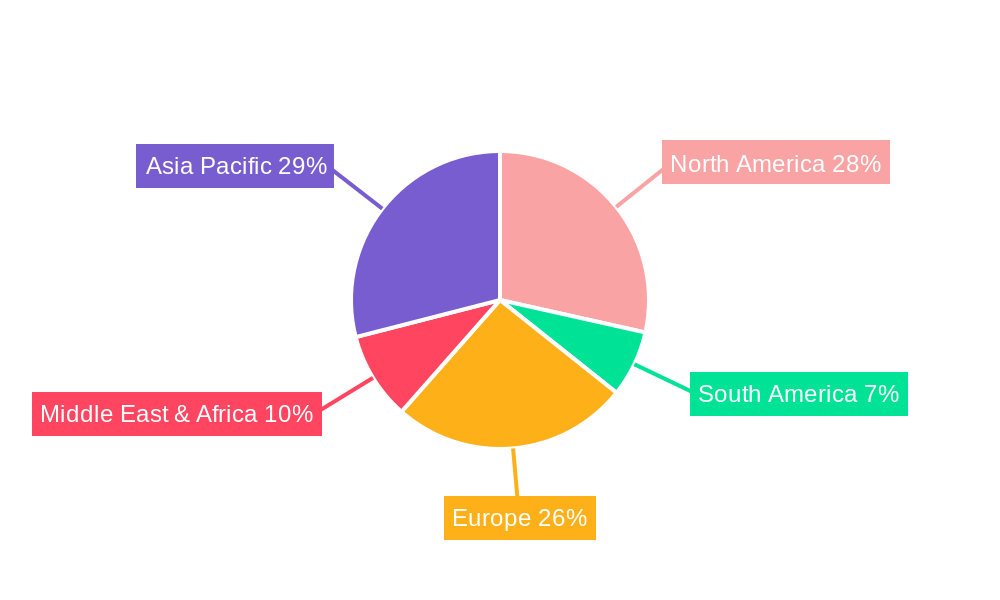
The market's growth is further supported by ongoing technological advancements in material science, leading to the development of more durable and high-performance fiber sleeves. Stainless steel and ceramic materials are expected to dominate the type segments due to their superior heat resistance and chemical inertness, making them ideal for demanding applications. While the market benefits from strong drivers, potential restraints such as the initial high cost of specialized materials and complex installation processes in certain niche applications may present challenges. Nevertheless, the overarching trend towards digitalization and the relentless pursuit of enhanced network reliability in diverse industrial settings are set to propel the High Temperature Fiber Sleeves market forward, with Asia Pacific and North America expected to be key regions for growth and innovation, supported by robust investments in infrastructure and advanced manufacturing capabilities.
High Temperature Fiber Sleeves Market Report: Forecast 2025-2033
This comprehensive market research report offers an in-depth analysis of the global High Temperature Fiber Sleeves market, forecasting its trajectory from 2019 to 2033. With a base year of 2025 and a detailed historical analysis from 2019-2024, the report provides critical insights into market dynamics, growth trends, regional dominance, product landscape, key drivers, challenges, opportunities, and a thorough overview of leading market players and their notable milestones. This report is an indispensable resource for industry professionals seeking to understand and capitalize on the burgeoning high-temperature fiber optic cable protection market, encompassing both parent and child market segments across critical industries.
High Temperature Fiber Sleeves Market Dynamics & Structure
The high temperature fiber sleeve market exhibits a moderate level of concentration, with key players like Fujikura, Corning, and Sumitomo holding significant market share. Technological innovation is a primary driver, fueled by the demand for advanced materials capable of withstanding extreme thermal environments in applications such as industrial automation fiber optic protection and oil and gas fiber optic solutions. Regulatory frameworks, particularly those related to safety and performance standards in critical infrastructure, also shape market entry and product development. Competitive product substitutes, while existing, often fall short in delivering the specialized high-temperature resistance and durability offered by dedicated fiber sleeves. End-user demographics are shifting towards industries with increasingly demanding operational conditions, including advanced manufacturing, aerospace, and specialized chemical processing. Mergers and acquisitions (M&A) are infrequent but strategic, aimed at consolidating market position and acquiring innovative technologies.
- Market Concentration: Moderate, with key players dominating specific application niches.
- Technological Innovation Drivers: Demand for enhanced thermal resistance, miniaturization, and improved mechanical properties.
- Regulatory Frameworks: Adherence to industry-specific safety and performance certifications.
- Competitive Product Substitutes: Limited by specialized high-temperature resilience requirements.
- End-User Demographics: Growing demand from harsh environment industries.
- M&A Trends: Strategic acquisitions focused on technology and market expansion.
High Temperature Fiber Sleeves Growth Trends & Insights
The global high temperature fiber sleeve market is poised for significant expansion, driven by escalating demand across diverse industrial sectors. The market size is projected to grow from an estimated $580 million in 2025 to an anticipated $950 million by 2033, exhibiting a Compound Annual Growth Rate (CAGR) of approximately 6.5% during the forecast period. This robust growth is underpinned by the increasing adoption of fiber optic technology in environments previously considered too challenging for reliable data transmission. Technological disruptions, such as the development of advanced composite materials and novel manufacturing techniques, are continuously enhancing the performance and cost-effectiveness of high-temperature fiber sleeves, further accelerating their market penetration. Consumer behavior shifts are also evident, with end-users increasingly prioritizing long-term reliability and reduced maintenance costs over initial investment, making durable high-temperature solutions a preferred choice. The adoption rate of these specialized sleeves is on an upward trajectory as industries recognize their critical role in ensuring operational continuity under extreme conditions.
- Market Size Evolution: Projected to grow from $580 million (2025) to $950 million (2033).
- CAGR: Approximately 6.5% during the forecast period.
- Adoption Rates: Steadily increasing across key industrial applications.
- Technological Disruptions: Innovations in materials science and manufacturing processes.
- Consumer Behavior Shifts: Emphasis on long-term reliability and cost of ownership.
- Market Penetration: Expanding into new and emerging high-temperature applications.
Dominant Regions, Countries, or Segments in High Temperature Fiber Sleeves
The high temperature fiber sleeve market is experiencing significant growth, with the Communications Equipment application segment emerging as the dominant driver. This dominance is propelled by the ubiquitous expansion of telecommunications infrastructure, including 5G deployments, data centers, and broadband expansion initiatives, all of which increasingly require robust fiber optic protection in diverse and often challenging environmental conditions. The Petroleum and Chemical Industry segments also represent substantial market contributors, driven by the critical need for reliable data transmission in harsh, high-temperature, and corrosive environments where standard cabling solutions would fail. Within the Type segment, Stainless Steel high temperature fiber sleeves hold a leading position due to their exceptional mechanical strength and corrosion resistance, making them ideal for demanding industrial applications.
Key Drivers for Communications Equipment Dominance:
- Global 5G Rollout: Extensive deployment requiring resilient fiber optic networks.
- Data Center Expansion: Increasing demand for high-speed, reliable connectivity in thermally controlled environments.
- Broadband Infrastructure Upgrades: Need for durable solutions in diverse geographical locations.
- Technological Advancements in Networking: Supporting higher data rates and bandwidth.
Market Share and Growth Potential in Communications Equipment: This segment is estimated to account for over 40% of the total market revenue in 2025, with a projected CAGR of 7.2% during the forecast period.
Dominance Factors in Stainless Steel Sleeves:
- Superior Mechanical Properties: High tensile strength and resistance to abrasion.
- Excellent Corrosion Resistance: Vital for aggressive industrial atmospheres.
- Wide Operating Temperature Range: Sustains performance in extreme heat.
- Proven Reliability: Long track record in critical applications.
Market Share and Growth Potential in Stainless Steel Type: Expected to capture approximately 35% of the market share in 2025, with a projected CAGR of 6.8%.
The Industrial Automation segment is also a significant growth area, fueled by the increasing implementation of smart manufacturing and Industry 4.0 initiatives that rely heavily on networked sensors and control systems operating under elevated temperatures.
High Temperature Fiber Sleeves Product Landscape
The high temperature fiber sleeve product landscape is characterized by continuous innovation focused on enhancing thermal resistance, durability, and ease of installation. Advanced materials, such as specialized ceramic composites and high-performance polymers, are being integrated to achieve superior protection in extreme operating conditions exceeding 150°C. Unique selling propositions often revolve around tailored solutions for specific applications, offering custom diameters, lengths, and environmental sealing capabilities. Technological advancements include the development of self-healing materials and improved thermal conductivity coatings, enabling more efficient heat dissipation and extended lifespan for fiber optic connections in critical infrastructure.
Key Drivers, Barriers & Challenges in High Temperature Fiber Sleeves
Key Drivers:
- Increasing Demand for High-Performance Fiber Optics: Driven by 5G, IoT, and industrial automation.
- Expansion into Harsh Environments: Growing need for reliable communication in extreme temperatures and corrosive atmospheres.
- Technological Advancements in Materials: Development of more resilient and cost-effective sleeve materials.
- Stringent Safety and Reliability Standards: Mandating robust protection for critical infrastructure.
Key Barriers & Challenges:
- High Manufacturing Costs: Specialized materials and processes can increase production expenses.
- Competition from Alternative Protection Methods: While less effective, some lower-cost alternatives exist.
- Supply Chain Volatility: Sourcing of specialized raw materials can be subject to disruptions.
- Installation Complexity in Certain Applications: Requiring specialized tools and expertise.
Emerging Opportunities in High Temperature Fiber Sleeves
Emerging opportunities in the high temperature fiber sleeve market lie in the untapped potential of niche applications within the renewable energy sector, particularly in geothermal power generation and concentrated solar power plants. The increasing sophistication of aerospace and defense systems, requiring lightweight yet extremely durable fiber optic protection, presents another significant growth avenue. Furthermore, the development of smart grid technologies in remote and extreme climatic regions offers substantial untapped markets. Innovative applications utilizing advanced sensing technologies in high-temperature industrial processes also present lucrative prospects for specialized sleeve solutions.
Growth Accelerators in the High Temperature Fiber Sleeves Industry
Catalysts driving long-term growth in the high temperature fiber sleeves industry include breakthroughs in nanotechnology for material enhancement, leading to sleeves with unprecedented thermal stability and mechanical resilience. Strategic partnerships between material manufacturers and fiber optic cable providers are crucial for co-developing integrated solutions tailored to specific industry needs. Market expansion strategies targeting emerging economies with rapidly industrializing sectors and increasing fiber optic infrastructure investments are also key accelerators. The continuous evolution of demanding industrial applications, such as advanced robotics and autonomous systems operating in extreme conditions, will further fuel demand for high-performance protection.
Key Players Shaping the High Temperature Fiber Sleeves Market
- Fujikura
- Jonard Tools
- Huber & Sunher
- Sumitomo
- AFL
- Corning
- Commscope
- Weinert
- Nexconec
- Stanlay
- FS.COM
- Hexatronic
- ACP International
- Anfkom Telcom
- Connectix
- Radiant Technologies
- SAMM Teknoloji
- KITCO Fiber Optics
- FOCC Fiber Optic
- Yuxuan New Material
- Yunlin Applied Materials
Notable Milestones in High Temperature Fiber Sleeves Sector
- 2019: Fujikura launches an advanced ceramic fiber sleeve for extreme temperature applications.
- 2020: Corning introduces a new composite material offering enhanced thermal conductivity for fiber optic protection.
- 2021: Sumitomo announces strategic partnerships to expand its high-temperature fiber sleeve product line for industrial automation.
- 2022: Jonard Tools enhances its range of installation tools specifically designed for high-temperature fiber sleeves.
- 2023: AFL introduces a lightweight, high-temperature fiber sleeve solution for aerospace applications.
- 2024: Several new market entrants focus on developing cost-effective ceramic fiber sleeve solutions.
In-Depth High Temperature Fiber Sleeves Market Outlook
The future outlook for the high temperature fiber sleeves market is exceptionally bright, fueled by a convergence of technological advancements and increasing industrial demands for reliable connectivity in challenging environments. Growth accelerators, including innovative material science, strategic collaborations, and expanding market reach into emerging economies, will continue to propel market expansion. The sustained global investment in telecommunications infrastructure, coupled with the rise of Industry 4.0 and advanced manufacturing, ensures a consistent and growing demand for high-performance fiber optic protection. Strategic opportunities lie in developing customizable solutions for niche applications and leveraging digital transformation trends to enhance product accessibility and customer support, solidifying the market's robust growth trajectory.
High Temperature Fiber Sleeves Segmentation
-
1. Application
- 1.1. Communications Equipment
- 1.2. Petroleum
- 1.3. Chemical Industry
- 1.4. Industrial Automation
- 1.5. Others
-
2. Type
- 2.1. Stainless Steel
- 2.2. Ceramic
- 2.3. Plastic
- 2.4. Others
High Temperature Fiber Sleeves Segmentation By Geography
-
1. North America
- 1.1. United States
- 1.2. Canada
- 1.3. Mexico
-
2. South America
- 2.1. Brazil
- 2.2. Argentina
- 2.3. Rest of South America
-
3. Europe
- 3.1. United Kingdom
- 3.2. Germany
- 3.3. France
- 3.4. Italy
- 3.5. Spain
- 3.6. Russia
- 3.7. Benelux
- 3.8. Nordics
- 3.9. Rest of Europe
-
4. Middle East & Africa
- 4.1. Turkey
- 4.2. Israel
- 4.3. GCC
- 4.4. North Africa
- 4.5. South Africa
- 4.6. Rest of Middle East & Africa
-
5. Asia Pacific
- 5.1. China
- 5.2. India
- 5.3. Japan
- 5.4. South Korea
- 5.5. ASEAN
- 5.6. Oceania
- 5.7. Rest of Asia Pacific
High Temperature Fiber Sleeves REPORT HIGHLIGHTS
| Aspects | Details |
|---|---|
| Study Period | 2019-2033 |
| Base Year | 2024 |
| Estimated Year | 2025 |
| Forecast Period | 2025-2033 |
| Historical Period | 2019-2024 |
| Growth Rate | CAGR of 8.3% from 2019-2033 |
| Segmentation |
|
Table of Contents
- 1. Introduction
- 1.1. Research Scope
- 1.2. Market Segmentation
- 1.3. Research Methodology
- 1.4. Definitions and Assumptions
- 2. Executive Summary
- 2.1. Introduction
- 3. Market Dynamics
- 3.1. Introduction
- 3.2. Market Drivers
- 3.3. Market Restrains
- 3.4. Market Trends
- 4. Market Factor Analysis
- 4.1. Porters Five Forces
- 4.2. Supply/Value Chain
- 4.3. PESTEL analysis
- 4.4. Market Entropy
- 4.5. Patent/Trademark Analysis
- 5. Global High Temperature Fiber Sleeves Analysis, Insights and Forecast, 2019-2031
- 5.1. Market Analysis, Insights and Forecast - by Application
- 5.1.1. Communications Equipment
- 5.1.2. Petroleum
- 5.1.3. Chemical Industry
- 5.1.4. Industrial Automation
- 5.1.5. Others
- 5.2. Market Analysis, Insights and Forecast - by Type
- 5.2.1. Stainless Steel
- 5.2.2. Ceramic
- 5.2.3. Plastic
- 5.2.4. Others
- 5.3. Market Analysis, Insights and Forecast - by Region
- 5.3.1. North America
- 5.3.2. South America
- 5.3.3. Europe
- 5.3.4. Middle East & Africa
- 5.3.5. Asia Pacific
- 5.1. Market Analysis, Insights and Forecast - by Application
- 6. North America High Temperature Fiber Sleeves Analysis, Insights and Forecast, 2019-2031
- 6.1. Market Analysis, Insights and Forecast - by Application
- 6.1.1. Communications Equipment
- 6.1.2. Petroleum
- 6.1.3. Chemical Industry
- 6.1.4. Industrial Automation
- 6.1.5. Others
- 6.2. Market Analysis, Insights and Forecast - by Type
- 6.2.1. Stainless Steel
- 6.2.2. Ceramic
- 6.2.3. Plastic
- 6.2.4. Others
- 6.1. Market Analysis, Insights and Forecast - by Application
- 7. South America High Temperature Fiber Sleeves Analysis, Insights and Forecast, 2019-2031
- 7.1. Market Analysis, Insights and Forecast - by Application
- 7.1.1. Communications Equipment
- 7.1.2. Petroleum
- 7.1.3. Chemical Industry
- 7.1.4. Industrial Automation
- 7.1.5. Others
- 7.2. Market Analysis, Insights and Forecast - by Type
- 7.2.1. Stainless Steel
- 7.2.2. Ceramic
- 7.2.3. Plastic
- 7.2.4. Others
- 7.1. Market Analysis, Insights and Forecast - by Application
- 8. Europe High Temperature Fiber Sleeves Analysis, Insights and Forecast, 2019-2031
- 8.1. Market Analysis, Insights and Forecast - by Application
- 8.1.1. Communications Equipment
- 8.1.2. Petroleum
- 8.1.3. Chemical Industry
- 8.1.4. Industrial Automation
- 8.1.5. Others
- 8.2. Market Analysis, Insights and Forecast - by Type
- 8.2.1. Stainless Steel
- 8.2.2. Ceramic
- 8.2.3. Plastic
- 8.2.4. Others
- 8.1. Market Analysis, Insights and Forecast - by Application
- 9. Middle East & Africa High Temperature Fiber Sleeves Analysis, Insights and Forecast, 2019-2031
- 9.1. Market Analysis, Insights and Forecast - by Application
- 9.1.1. Communications Equipment
- 9.1.2. Petroleum
- 9.1.3. Chemical Industry
- 9.1.4. Industrial Automation
- 9.1.5. Others
- 9.2. Market Analysis, Insights and Forecast - by Type
- 9.2.1. Stainless Steel
- 9.2.2. Ceramic
- 9.2.3. Plastic
- 9.2.4. Others
- 9.1. Market Analysis, Insights and Forecast - by Application
- 10. Asia Pacific High Temperature Fiber Sleeves Analysis, Insights and Forecast, 2019-2031
- 10.1. Market Analysis, Insights and Forecast - by Application
- 10.1.1. Communications Equipment
- 10.1.2. Petroleum
- 10.1.3. Chemical Industry
- 10.1.4. Industrial Automation
- 10.1.5. Others
- 10.2. Market Analysis, Insights and Forecast - by Type
- 10.2.1. Stainless Steel
- 10.2.2. Ceramic
- 10.2.3. Plastic
- 10.2.4. Others
- 10.1. Market Analysis, Insights and Forecast - by Application
- 11. Competitive Analysis
- 11.1. Global Market Share Analysis 2024
- 11.2. Company Profiles
- 11.2.1 Fujikura
- 11.2.1.1. Overview
- 11.2.1.2. Products
- 11.2.1.3. SWOT Analysis
- 11.2.1.4. Recent Developments
- 11.2.1.5. Financials (Based on Availability)
- 11.2.2 Jonard Tools
- 11.2.2.1. Overview
- 11.2.2.2. Products
- 11.2.2.3. SWOT Analysis
- 11.2.2.4. Recent Developments
- 11.2.2.5. Financials (Based on Availability)
- 11.2.3 Huber & Sunher
- 11.2.3.1. Overview
- 11.2.3.2. Products
- 11.2.3.3. SWOT Analysis
- 11.2.3.4. Recent Developments
- 11.2.3.5. Financials (Based on Availability)
- 11.2.4 Sumitomo
- 11.2.4.1. Overview
- 11.2.4.2. Products
- 11.2.4.3. SWOT Analysis
- 11.2.4.4. Recent Developments
- 11.2.4.5. Financials (Based on Availability)
- 11.2.5 AFL
- 11.2.5.1. Overview
- 11.2.5.2. Products
- 11.2.5.3. SWOT Analysis
- 11.2.5.4. Recent Developments
- 11.2.5.5. Financials (Based on Availability)
- 11.2.6 Corning
- 11.2.6.1. Overview
- 11.2.6.2. Products
- 11.2.6.3. SWOT Analysis
- 11.2.6.4. Recent Developments
- 11.2.6.5. Financials (Based on Availability)
- 11.2.7 Commscope
- 11.2.7.1. Overview
- 11.2.7.2. Products
- 11.2.7.3. SWOT Analysis
- 11.2.7.4. Recent Developments
- 11.2.7.5. Financials (Based on Availability)
- 11.2.8 Weinert
- 11.2.8.1. Overview
- 11.2.8.2. Products
- 11.2.8.3. SWOT Analysis
- 11.2.8.4. Recent Developments
- 11.2.8.5. Financials (Based on Availability)
- 11.2.9 Nexconec
- 11.2.9.1. Overview
- 11.2.9.2. Products
- 11.2.9.3. SWOT Analysis
- 11.2.9.4. Recent Developments
- 11.2.9.5. Financials (Based on Availability)
- 11.2.10 Stanlay
- 11.2.10.1. Overview
- 11.2.10.2. Products
- 11.2.10.3. SWOT Analysis
- 11.2.10.4. Recent Developments
- 11.2.10.5. Financials (Based on Availability)
- 11.2.11 FS.COM
- 11.2.11.1. Overview
- 11.2.11.2. Products
- 11.2.11.3. SWOT Analysis
- 11.2.11.4. Recent Developments
- 11.2.11.5. Financials (Based on Availability)
- 11.2.12 Hexatronic
- 11.2.12.1. Overview
- 11.2.12.2. Products
- 11.2.12.3. SWOT Analysis
- 11.2.12.4. Recent Developments
- 11.2.12.5. Financials (Based on Availability)
- 11.2.13 ACP International
- 11.2.13.1. Overview
- 11.2.13.2. Products
- 11.2.13.3. SWOT Analysis
- 11.2.13.4. Recent Developments
- 11.2.13.5. Financials (Based on Availability)
- 11.2.14 Anfkom Telcom
- 11.2.14.1. Overview
- 11.2.14.2. Products
- 11.2.14.3. SWOT Analysis
- 11.2.14.4. Recent Developments
- 11.2.14.5. Financials (Based on Availability)
- 11.2.15 Connectix
- 11.2.15.1. Overview
- 11.2.15.2. Products
- 11.2.15.3. SWOT Analysis
- 11.2.15.4. Recent Developments
- 11.2.15.5. Financials (Based on Availability)
- 11.2.16 Radiant Technologies
- 11.2.16.1. Overview
- 11.2.16.2. Products
- 11.2.16.3. SWOT Analysis
- 11.2.16.4. Recent Developments
- 11.2.16.5. Financials (Based on Availability)
- 11.2.17 SAMM Teknoloji
- 11.2.17.1. Overview
- 11.2.17.2. Products
- 11.2.17.3. SWOT Analysis
- 11.2.17.4. Recent Developments
- 11.2.17.5. Financials (Based on Availability)
- 11.2.18 KITCO Fiber Optics
- 11.2.18.1. Overview
- 11.2.18.2. Products
- 11.2.18.3. SWOT Analysis
- 11.2.18.4. Recent Developments
- 11.2.18.5. Financials (Based on Availability)
- 11.2.19 FOCC Fiber Optic
- 11.2.19.1. Overview
- 11.2.19.2. Products
- 11.2.19.3. SWOT Analysis
- 11.2.19.4. Recent Developments
- 11.2.19.5. Financials (Based on Availability)
- 11.2.20 Yuxuan New Material
- 11.2.20.1. Overview
- 11.2.20.2. Products
- 11.2.20.3. SWOT Analysis
- 11.2.20.4. Recent Developments
- 11.2.20.5. Financials (Based on Availability)
- 11.2.21 Yunlin Applied Materials
- 11.2.21.1. Overview
- 11.2.21.2. Products
- 11.2.21.3. SWOT Analysis
- 11.2.21.4. Recent Developments
- 11.2.21.5. Financials (Based on Availability)
- 11.2.1 Fujikura
List of Figures
- Figure 1: Global High Temperature Fiber Sleeves Revenue Breakdown (million, %) by Region 2024 & 2032
- Figure 2: Global High Temperature Fiber Sleeves Volume Breakdown (K, %) by Region 2024 & 2032
- Figure 3: North America High Temperature Fiber Sleeves Revenue (million), by Application 2024 & 2032
- Figure 4: North America High Temperature Fiber Sleeves Volume (K), by Application 2024 & 2032
- Figure 5: North America High Temperature Fiber Sleeves Revenue Share (%), by Application 2024 & 2032
- Figure 6: North America High Temperature Fiber Sleeves Volume Share (%), by Application 2024 & 2032
- Figure 7: North America High Temperature Fiber Sleeves Revenue (million), by Type 2024 & 2032
- Figure 8: North America High Temperature Fiber Sleeves Volume (K), by Type 2024 & 2032
- Figure 9: North America High Temperature Fiber Sleeves Revenue Share (%), by Type 2024 & 2032
- Figure 10: North America High Temperature Fiber Sleeves Volume Share (%), by Type 2024 & 2032
- Figure 11: North America High Temperature Fiber Sleeves Revenue (million), by Country 2024 & 2032
- Figure 12: North America High Temperature Fiber Sleeves Volume (K), by Country 2024 & 2032
- Figure 13: North America High Temperature Fiber Sleeves Revenue Share (%), by Country 2024 & 2032
- Figure 14: North America High Temperature Fiber Sleeves Volume Share (%), by Country 2024 & 2032
- Figure 15: South America High Temperature Fiber Sleeves Revenue (million), by Application 2024 & 2032
- Figure 16: South America High Temperature Fiber Sleeves Volume (K), by Application 2024 & 2032
- Figure 17: South America High Temperature Fiber Sleeves Revenue Share (%), by Application 2024 & 2032
- Figure 18: South America High Temperature Fiber Sleeves Volume Share (%), by Application 2024 & 2032
- Figure 19: South America High Temperature Fiber Sleeves Revenue (million), by Type 2024 & 2032
- Figure 20: South America High Temperature Fiber Sleeves Volume (K), by Type 2024 & 2032
- Figure 21: South America High Temperature Fiber Sleeves Revenue Share (%), by Type 2024 & 2032
- Figure 22: South America High Temperature Fiber Sleeves Volume Share (%), by Type 2024 & 2032
- Figure 23: South America High Temperature Fiber Sleeves Revenue (million), by Country 2024 & 2032
- Figure 24: South America High Temperature Fiber Sleeves Volume (K), by Country 2024 & 2032
- Figure 25: South America High Temperature Fiber Sleeves Revenue Share (%), by Country 2024 & 2032
- Figure 26: South America High Temperature Fiber Sleeves Volume Share (%), by Country 2024 & 2032
- Figure 27: Europe High Temperature Fiber Sleeves Revenue (million), by Application 2024 & 2032
- Figure 28: Europe High Temperature Fiber Sleeves Volume (K), by Application 2024 & 2032
- Figure 29: Europe High Temperature Fiber Sleeves Revenue Share (%), by Application 2024 & 2032
- Figure 30: Europe High Temperature Fiber Sleeves Volume Share (%), by Application 2024 & 2032
- Figure 31: Europe High Temperature Fiber Sleeves Revenue (million), by Type 2024 & 2032
- Figure 32: Europe High Temperature Fiber Sleeves Volume (K), by Type 2024 & 2032
- Figure 33: Europe High Temperature Fiber Sleeves Revenue Share (%), by Type 2024 & 2032
- Figure 34: Europe High Temperature Fiber Sleeves Volume Share (%), by Type 2024 & 2032
- Figure 35: Europe High Temperature Fiber Sleeves Revenue (million), by Country 2024 & 2032
- Figure 36: Europe High Temperature Fiber Sleeves Volume (K), by Country 2024 & 2032
- Figure 37: Europe High Temperature Fiber Sleeves Revenue Share (%), by Country 2024 & 2032
- Figure 38: Europe High Temperature Fiber Sleeves Volume Share (%), by Country 2024 & 2032
- Figure 39: Middle East & Africa High Temperature Fiber Sleeves Revenue (million), by Application 2024 & 2032
- Figure 40: Middle East & Africa High Temperature Fiber Sleeves Volume (K), by Application 2024 & 2032
- Figure 41: Middle East & Africa High Temperature Fiber Sleeves Revenue Share (%), by Application 2024 & 2032
- Figure 42: Middle East & Africa High Temperature Fiber Sleeves Volume Share (%), by Application 2024 & 2032
- Figure 43: Middle East & Africa High Temperature Fiber Sleeves Revenue (million), by Type 2024 & 2032
- Figure 44: Middle East & Africa High Temperature Fiber Sleeves Volume (K), by Type 2024 & 2032
- Figure 45: Middle East & Africa High Temperature Fiber Sleeves Revenue Share (%), by Type 2024 & 2032
- Figure 46: Middle East & Africa High Temperature Fiber Sleeves Volume Share (%), by Type 2024 & 2032
- Figure 47: Middle East & Africa High Temperature Fiber Sleeves Revenue (million), by Country 2024 & 2032
- Figure 48: Middle East & Africa High Temperature Fiber Sleeves Volume (K), by Country 2024 & 2032
- Figure 49: Middle East & Africa High Temperature Fiber Sleeves Revenue Share (%), by Country 2024 & 2032
- Figure 50: Middle East & Africa High Temperature Fiber Sleeves Volume Share (%), by Country 2024 & 2032
- Figure 51: Asia Pacific High Temperature Fiber Sleeves Revenue (million), by Application 2024 & 2032
- Figure 52: Asia Pacific High Temperature Fiber Sleeves Volume (K), by Application 2024 & 2032
- Figure 53: Asia Pacific High Temperature Fiber Sleeves Revenue Share (%), by Application 2024 & 2032
- Figure 54: Asia Pacific High Temperature Fiber Sleeves Volume Share (%), by Application 2024 & 2032
- Figure 55: Asia Pacific High Temperature Fiber Sleeves Revenue (million), by Type 2024 & 2032
- Figure 56: Asia Pacific High Temperature Fiber Sleeves Volume (K), by Type 2024 & 2032
- Figure 57: Asia Pacific High Temperature Fiber Sleeves Revenue Share (%), by Type 2024 & 2032
- Figure 58: Asia Pacific High Temperature Fiber Sleeves Volume Share (%), by Type 2024 & 2032
- Figure 59: Asia Pacific High Temperature Fiber Sleeves Revenue (million), by Country 2024 & 2032
- Figure 60: Asia Pacific High Temperature Fiber Sleeves Volume (K), by Country 2024 & 2032
- Figure 61: Asia Pacific High Temperature Fiber Sleeves Revenue Share (%), by Country 2024 & 2032
- Figure 62: Asia Pacific High Temperature Fiber Sleeves Volume Share (%), by Country 2024 & 2032
List of Tables
- Table 1: Global High Temperature Fiber Sleeves Revenue million Forecast, by Region 2019 & 2032
- Table 2: Global High Temperature Fiber Sleeves Volume K Forecast, by Region 2019 & 2032
- Table 3: Global High Temperature Fiber Sleeves Revenue million Forecast, by Application 2019 & 2032
- Table 4: Global High Temperature Fiber Sleeves Volume K Forecast, by Application 2019 & 2032
- Table 5: Global High Temperature Fiber Sleeves Revenue million Forecast, by Type 2019 & 2032
- Table 6: Global High Temperature Fiber Sleeves Volume K Forecast, by Type 2019 & 2032
- Table 7: Global High Temperature Fiber Sleeves Revenue million Forecast, by Region 2019 & 2032
- Table 8: Global High Temperature Fiber Sleeves Volume K Forecast, by Region 2019 & 2032
- Table 9: Global High Temperature Fiber Sleeves Revenue million Forecast, by Application 2019 & 2032
- Table 10: Global High Temperature Fiber Sleeves Volume K Forecast, by Application 2019 & 2032
- Table 11: Global High Temperature Fiber Sleeves Revenue million Forecast, by Type 2019 & 2032
- Table 12: Global High Temperature Fiber Sleeves Volume K Forecast, by Type 2019 & 2032
- Table 13: Global High Temperature Fiber Sleeves Revenue million Forecast, by Country 2019 & 2032
- Table 14: Global High Temperature Fiber Sleeves Volume K Forecast, by Country 2019 & 2032
- Table 15: United States High Temperature Fiber Sleeves Revenue (million) Forecast, by Application 2019 & 2032
- Table 16: United States High Temperature Fiber Sleeves Volume (K) Forecast, by Application 2019 & 2032
- Table 17: Canada High Temperature Fiber Sleeves Revenue (million) Forecast, by Application 2019 & 2032
- Table 18: Canada High Temperature Fiber Sleeves Volume (K) Forecast, by Application 2019 & 2032
- Table 19: Mexico High Temperature Fiber Sleeves Revenue (million) Forecast, by Application 2019 & 2032
- Table 20: Mexico High Temperature Fiber Sleeves Volume (K) Forecast, by Application 2019 & 2032
- Table 21: Global High Temperature Fiber Sleeves Revenue million Forecast, by Application 2019 & 2032
- Table 22: Global High Temperature Fiber Sleeves Volume K Forecast, by Application 2019 & 2032
- Table 23: Global High Temperature Fiber Sleeves Revenue million Forecast, by Type 2019 & 2032
- Table 24: Global High Temperature Fiber Sleeves Volume K Forecast, by Type 2019 & 2032
- Table 25: Global High Temperature Fiber Sleeves Revenue million Forecast, by Country 2019 & 2032
- Table 26: Global High Temperature Fiber Sleeves Volume K Forecast, by Country 2019 & 2032
- Table 27: Brazil High Temperature Fiber Sleeves Revenue (million) Forecast, by Application 2019 & 2032
- Table 28: Brazil High Temperature Fiber Sleeves Volume (K) Forecast, by Application 2019 & 2032
- Table 29: Argentina High Temperature Fiber Sleeves Revenue (million) Forecast, by Application 2019 & 2032
- Table 30: Argentina High Temperature Fiber Sleeves Volume (K) Forecast, by Application 2019 & 2032
- Table 31: Rest of South America High Temperature Fiber Sleeves Revenue (million) Forecast, by Application 2019 & 2032
- Table 32: Rest of South America High Temperature Fiber Sleeves Volume (K) Forecast, by Application 2019 & 2032
- Table 33: Global High Temperature Fiber Sleeves Revenue million Forecast, by Application 2019 & 2032
- Table 34: Global High Temperature Fiber Sleeves Volume K Forecast, by Application 2019 & 2032
- Table 35: Global High Temperature Fiber Sleeves Revenue million Forecast, by Type 2019 & 2032
- Table 36: Global High Temperature Fiber Sleeves Volume K Forecast, by Type 2019 & 2032
- Table 37: Global High Temperature Fiber Sleeves Revenue million Forecast, by Country 2019 & 2032
- Table 38: Global High Temperature Fiber Sleeves Volume K Forecast, by Country 2019 & 2032
- Table 39: United Kingdom High Temperature Fiber Sleeves Revenue (million) Forecast, by Application 2019 & 2032
- Table 40: United Kingdom High Temperature Fiber Sleeves Volume (K) Forecast, by Application 2019 & 2032
- Table 41: Germany High Temperature Fiber Sleeves Revenue (million) Forecast, by Application 2019 & 2032
- Table 42: Germany High Temperature Fiber Sleeves Volume (K) Forecast, by Application 2019 & 2032
- Table 43: France High Temperature Fiber Sleeves Revenue (million) Forecast, by Application 2019 & 2032
- Table 44: France High Temperature Fiber Sleeves Volume (K) Forecast, by Application 2019 & 2032
- Table 45: Italy High Temperature Fiber Sleeves Revenue (million) Forecast, by Application 2019 & 2032
- Table 46: Italy High Temperature Fiber Sleeves Volume (K) Forecast, by Application 2019 & 2032
- Table 47: Spain High Temperature Fiber Sleeves Revenue (million) Forecast, by Application 2019 & 2032
- Table 48: Spain High Temperature Fiber Sleeves Volume (K) Forecast, by Application 2019 & 2032
- Table 49: Russia High Temperature Fiber Sleeves Revenue (million) Forecast, by Application 2019 & 2032
- Table 50: Russia High Temperature Fiber Sleeves Volume (K) Forecast, by Application 2019 & 2032
- Table 51: Benelux High Temperature Fiber Sleeves Revenue (million) Forecast, by Application 2019 & 2032
- Table 52: Benelux High Temperature Fiber Sleeves Volume (K) Forecast, by Application 2019 & 2032
- Table 53: Nordics High Temperature Fiber Sleeves Revenue (million) Forecast, by Application 2019 & 2032
- Table 54: Nordics High Temperature Fiber Sleeves Volume (K) Forecast, by Application 2019 & 2032
- Table 55: Rest of Europe High Temperature Fiber Sleeves Revenue (million) Forecast, by Application 2019 & 2032
- Table 56: Rest of Europe High Temperature Fiber Sleeves Volume (K) Forecast, by Application 2019 & 2032
- Table 57: Global High Temperature Fiber Sleeves Revenue million Forecast, by Application 2019 & 2032
- Table 58: Global High Temperature Fiber Sleeves Volume K Forecast, by Application 2019 & 2032
- Table 59: Global High Temperature Fiber Sleeves Revenue million Forecast, by Type 2019 & 2032
- Table 60: Global High Temperature Fiber Sleeves Volume K Forecast, by Type 2019 & 2032
- Table 61: Global High Temperature Fiber Sleeves Revenue million Forecast, by Country 2019 & 2032
- Table 62: Global High Temperature Fiber Sleeves Volume K Forecast, by Country 2019 & 2032
- Table 63: Turkey High Temperature Fiber Sleeves Revenue (million) Forecast, by Application 2019 & 2032
- Table 64: Turkey High Temperature Fiber Sleeves Volume (K) Forecast, by Application 2019 & 2032
- Table 65: Israel High Temperature Fiber Sleeves Revenue (million) Forecast, by Application 2019 & 2032
- Table 66: Israel High Temperature Fiber Sleeves Volume (K) Forecast, by Application 2019 & 2032
- Table 67: GCC High Temperature Fiber Sleeves Revenue (million) Forecast, by Application 2019 & 2032
- Table 68: GCC High Temperature Fiber Sleeves Volume (K) Forecast, by Application 2019 & 2032
- Table 69: North Africa High Temperature Fiber Sleeves Revenue (million) Forecast, by Application 2019 & 2032
- Table 70: North Africa High Temperature Fiber Sleeves Volume (K) Forecast, by Application 2019 & 2032
- Table 71: South Africa High Temperature Fiber Sleeves Revenue (million) Forecast, by Application 2019 & 2032
- Table 72: South Africa High Temperature Fiber Sleeves Volume (K) Forecast, by Application 2019 & 2032
- Table 73: Rest of Middle East & Africa High Temperature Fiber Sleeves Revenue (million) Forecast, by Application 2019 & 2032
- Table 74: Rest of Middle East & Africa High Temperature Fiber Sleeves Volume (K) Forecast, by Application 2019 & 2032
- Table 75: Global High Temperature Fiber Sleeves Revenue million Forecast, by Application 2019 & 2032
- Table 76: Global High Temperature Fiber Sleeves Volume K Forecast, by Application 2019 & 2032
- Table 77: Global High Temperature Fiber Sleeves Revenue million Forecast, by Type 2019 & 2032
- Table 78: Global High Temperature Fiber Sleeves Volume K Forecast, by Type 2019 & 2032
- Table 79: Global High Temperature Fiber Sleeves Revenue million Forecast, by Country 2019 & 2032
- Table 80: Global High Temperature Fiber Sleeves Volume K Forecast, by Country 2019 & 2032
- Table 81: China High Temperature Fiber Sleeves Revenue (million) Forecast, by Application 2019 & 2032
- Table 82: China High Temperature Fiber Sleeves Volume (K) Forecast, by Application 2019 & 2032
- Table 83: India High Temperature Fiber Sleeves Revenue (million) Forecast, by Application 2019 & 2032
- Table 84: India High Temperature Fiber Sleeves Volume (K) Forecast, by Application 2019 & 2032
- Table 85: Japan High Temperature Fiber Sleeves Revenue (million) Forecast, by Application 2019 & 2032
- Table 86: Japan High Temperature Fiber Sleeves Volume (K) Forecast, by Application 2019 & 2032
- Table 87: South Korea High Temperature Fiber Sleeves Revenue (million) Forecast, by Application 2019 & 2032
- Table 88: South Korea High Temperature Fiber Sleeves Volume (K) Forecast, by Application 2019 & 2032
- Table 89: ASEAN High Temperature Fiber Sleeves Revenue (million) Forecast, by Application 2019 & 2032
- Table 90: ASEAN High Temperature Fiber Sleeves Volume (K) Forecast, by Application 2019 & 2032
- Table 91: Oceania High Temperature Fiber Sleeves Revenue (million) Forecast, by Application 2019 & 2032
- Table 92: Oceania High Temperature Fiber Sleeves Volume (K) Forecast, by Application 2019 & 2032
- Table 93: Rest of Asia Pacific High Temperature Fiber Sleeves Revenue (million) Forecast, by Application 2019 & 2032
- Table 94: Rest of Asia Pacific High Temperature Fiber Sleeves Volume (K) Forecast, by Application 2019 & 2032
Frequently Asked Questions
1. What is the projected Compound Annual Growth Rate (CAGR) of the High Temperature Fiber Sleeves?
The projected CAGR is approximately 8.3%.
2. Which companies are prominent players in the High Temperature Fiber Sleeves?
Key companies in the market include Fujikura, Jonard Tools, Huber & Sunher, Sumitomo, AFL, Corning, Commscope, Weinert, Nexconec, Stanlay, FS.COM, Hexatronic, ACP International, Anfkom Telcom, Connectix, Radiant Technologies, SAMM Teknoloji, KITCO Fiber Optics, FOCC Fiber Optic, Yuxuan New Material, Yunlin Applied Materials.
3. What are the main segments of the High Temperature Fiber Sleeves?
The market segments include Application, Type.
4. Can you provide details about the market size?
The market size is estimated to be USD 553 million as of 2022.
5. What are some drivers contributing to market growth?
N/A
6. What are the notable trends driving market growth?
N/A
7. Are there any restraints impacting market growth?
N/A
8. Can you provide examples of recent developments in the market?
N/A
9. What pricing options are available for accessing the report?
Pricing options include single-user, multi-user, and enterprise licenses priced at USD 3950.00, USD 5925.00, and USD 7900.00 respectively.
10. Is the market size provided in terms of value or volume?
The market size is provided in terms of value, measured in million and volume, measured in K.
11. Are there any specific market keywords associated with the report?
Yes, the market keyword associated with the report is "High Temperature Fiber Sleeves," which aids in identifying and referencing the specific market segment covered.
12. How do I determine which pricing option suits my needs best?
The pricing options vary based on user requirements and access needs. Individual users may opt for single-user licenses, while businesses requiring broader access may choose multi-user or enterprise licenses for cost-effective access to the report.
13. Are there any additional resources or data provided in the High Temperature Fiber Sleeves report?
While the report offers comprehensive insights, it's advisable to review the specific contents or supplementary materials provided to ascertain if additional resources or data are available.
14. How can I stay updated on further developments or reports in the High Temperature Fiber Sleeves?
To stay informed about further developments, trends, and reports in the High Temperature Fiber Sleeves, consider subscribing to industry newsletters, following relevant companies and organizations, or regularly checking reputable industry news sources and publications.
Methodology
Step 1 - Identification of Relevant Samples Size from Population Database


Step 2 - Approaches for Defining Global Market Size (Value, Volume* & Price*)

Note*: In applicable scenarios
Step 3 - Data Sources
Primary Research
- Web Analytics
- Survey Reports
- Research Institute
- Latest Research Reports
- Opinion Leaders
Secondary Research
- Annual Reports
- White Paper
- Latest Press Release
- Industry Association
- Paid Database
- Investor Presentations

Step 4 - Data Triangulation
Involves using different sources of information in order to increase the validity of a study
These sources are likely to be stakeholders in a program - participants, other researchers, program staff, other community members, and so on.
Then we put all data in single framework & apply various statistical tools to find out the dynamic on the market.
During the analysis stage, feedback from the stakeholder groups would be compared to determine areas of agreement as well as areas of divergence


