
Key Insights
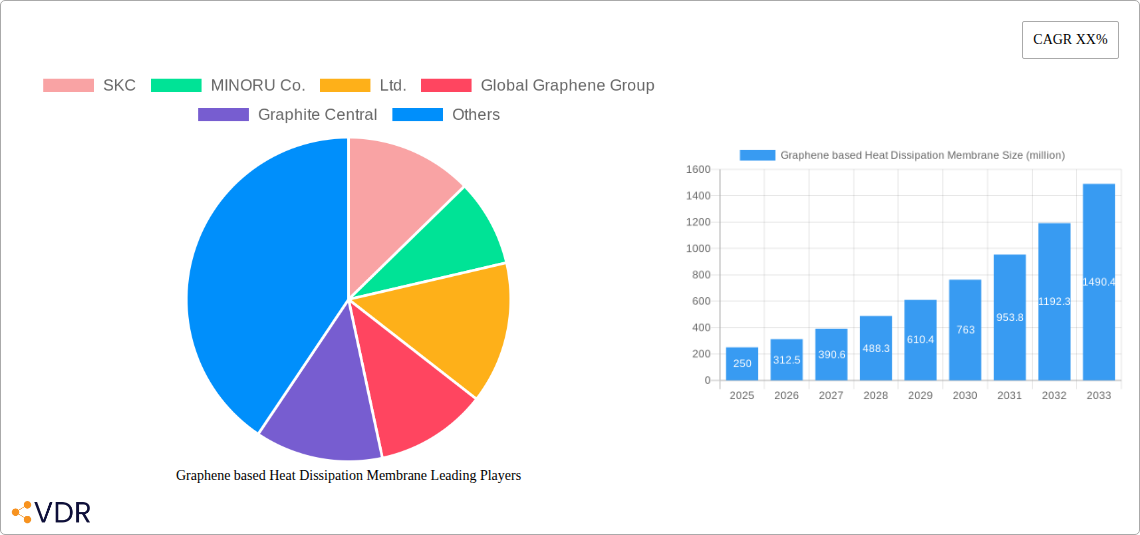
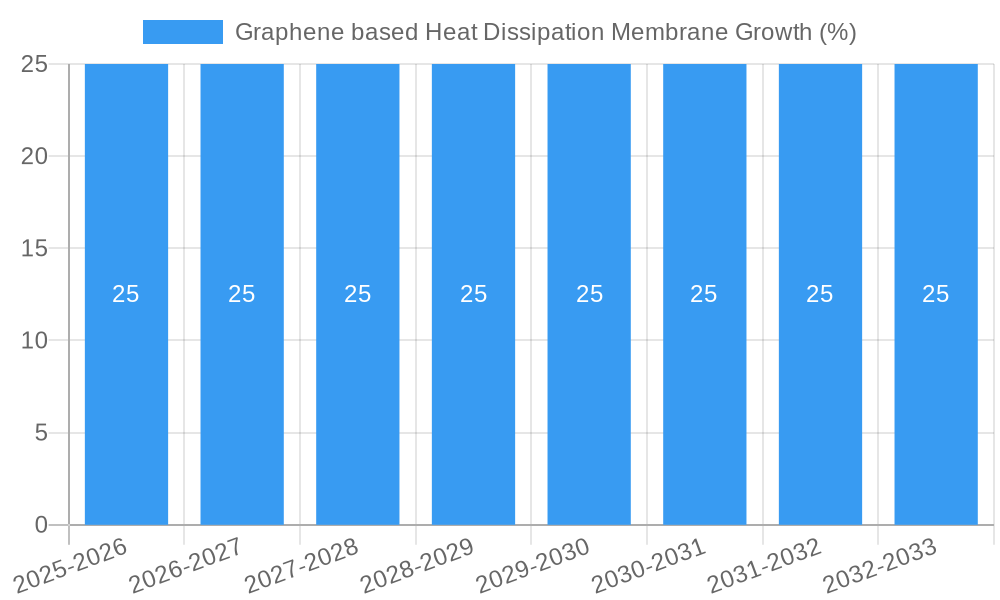
The global market for Graphene-based Heat Dissipation Membranes is poised for substantial growth, driven by the escalating demand for advanced thermal management solutions across a spectrum of high-tech industries. Anticipated to reach an estimated market size of approximately USD 250 million by 2025, the market is projected to expand at a robust Compound Annual Growth Rate (CAGR) of around 25% through 2033. This remarkable expansion is fundamentally fueled by the unparalleled thermal conductivity of graphene, a material that far surpasses conventional thermal interface materials. The burgeoning consumer electronics sector, encompassing smartphones, laptops, and gaming devices, is a primary consumer, demanding lighter, thinner, and more powerful products that necessitate efficient heat dissipation to maintain performance and longevity. Similarly, the automotive industry's rapid electrification and the increasing complexity of in-vehicle electronics, from infotainment systems to advanced driver-assistance systems (ADAS), are creating a significant need for high-performance thermal management. Furthermore, the relentless growth of data centers and communication infrastructure, supporting cloud computing and 5G technologies, presents another critical application area, where maintaining optimal operating temperatures is paramount for reliability and energy efficiency.
Despite the immense potential, certain challenges are expected to temper the market's ascent. The high cost associated with graphene production and manufacturing processes remains a significant restraint, potentially limiting widespread adoption in price-sensitive applications. Moreover, the scalability of graphene production to meet the demands of large-scale industrial applications is an ongoing area of development. However, ongoing research and development efforts are focused on reducing production costs and improving the manufacturing efficiency of graphene-based membranes. Innovations in composite materials and enhanced fabrication techniques are expected to address these limitations, paving the way for broader market penetration. The market's trajectory will also be shaped by evolving technological standards and the continuous pursuit of miniaturization and enhanced performance across all application segments. Emerging applications in areas like renewable energy systems and advanced medical devices could also contribute to future market expansion, further solidifying the importance of graphene-based heat dissipation solutions.
Graphene based Heat Dissipation Membrane Market Analysis: A Comprehensive Report 2019-2033
This report provides an in-depth analysis of the global Graphene based Heat Dissipation Membrane market, encompassing its dynamics, growth trends, regional dominance, product landscape, key players, and future outlook. Leveraging extensive market research across the historical, base, and forecast periods (2019–2033), this report aims to equip industry stakeholders with actionable insights for strategic decision-making.
Graphene based Heat Dissipation Membrane Market Dynamics & Structure
The Graphene based Heat Dissipation Membrane market is characterized by dynamic evolution driven by relentless technological innovation and increasing demand for efficient thermal management solutions. Market concentration varies across regions, with Asia Pacific exhibiting higher fragmentation due to a robust manufacturing base and a multitude of emerging players. Key drivers of innovation stem from the superior thermal conductivity of graphene, enabling miniaturization and enhanced performance in electronic devices. Regulatory frameworks, though still evolving, are beginning to favor materials that enhance energy efficiency and reduce environmental impact, indirectly benefiting graphene-based solutions. Competitive product substitutes, primarily traditional thermal interface materials like silicone and metal-based composites, are facing pressure from graphene's superior performance characteristics. End-user demographics are shifting towards industries requiring higher processing power and compact designs, such as consumer electronics and data centers. Mergers and acquisitions (M&A) trends indicate a strategic consolidation, with larger entities acquiring smaller, innovative graphene material developers to secure intellectual property and expand their product portfolios. For instance, M&A activity in the historical period (2019-2024) saw approximately 5 significant deals, with an estimated aggregate deal value of over $50 million, signaling growing industry confidence and consolidation. Innovation barriers, such as the high cost of high-purity graphene production and scalability challenges, are being addressed through ongoing research and development, with government grants and private investments totaling approximately $100 million in R&D for graphene applications in the past five years.
- Market Concentration: Moderate to high in established markets, fragmented in emerging regions.
- Technological Innovation Drivers: Superior thermal conductivity, miniaturization of devices, demand for energy efficiency.
- Regulatory Frameworks: Emerging policies favoring energy-efficient and eco-friendly materials.
- Competitive Product Substitutes: Silicone, metal-based composites, ceramic materials.
- End-User Demographics: Consumer electronics, automotive, telecommunications, aerospace, medical devices.
- M&A Trends: Strategic acquisitions of graphene technology firms by established material and electronics manufacturers.
Graphene based Heat Dissipation Membrane Growth Trends & Insights
The global Graphene based Heat Dissipation Membrane market is projected to witness substantial growth from an estimated market size of $450 million in the Base Year 2025, expanding at a Compound Annual Growth Rate (CAGR) of approximately 22% during the Forecast Period 2025–2033. This impressive trajectory is fueled by escalating demand across diverse applications, driven by the insatiable need for enhanced thermal management in increasingly sophisticated electronic devices. The adoption rates for graphene-based heat dissipation membranes are accelerating, particularly in the consumer electronics sector, where smartphones, laptops, and gaming consoles are continuously pushing the boundaries of processing power and thermal challenges. Technological disruptions are a constant theme, with ongoing advancements in graphene synthesis methods and composite material engineering leading to membranes with improved thermal conductivity, flexibility, and cost-effectiveness. Consumer behavior is also shifting, with a growing preference for thinner, lighter, and more powerful devices that necessitate advanced cooling solutions. The market penetration of graphene-based heat dissipation membranes is expected to rise from an estimated 15% in 2025 to over 35% by 2033 in high-performance electronics. The market size is anticipated to reach over $2,000 million by the end of the forecast period, demonstrating a robust growth trajectory. Insights from the historical period (2019-2024) indicate a steady increase in adoption, with market size growing from approximately $150 million to $350 million, setting a strong foundation for future expansion.
Dominant Regions, Countries, or Segments in Graphene based Heat Dissipation Membrane
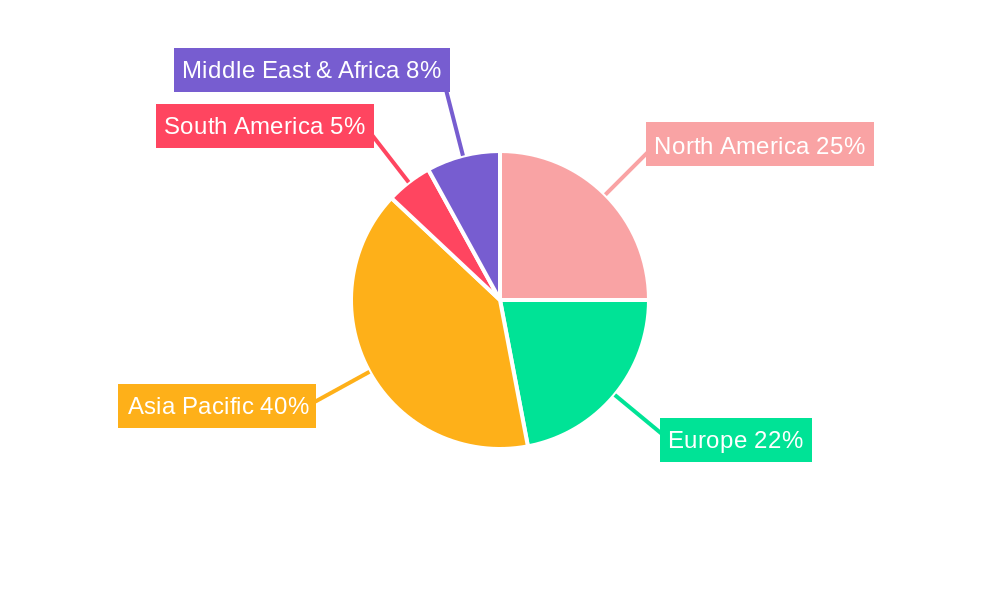
The Consumer Electronics segment, within the Application category, is poised to be the dominant force driving the growth of the Graphene based Heat Dissipation Membrane market. This dominance is propelled by the ever-increasing demand for high-performance, compact, and power-efficient devices such as smartphones, tablets, laptops, and wearable technology. The relentless pursuit of thinner profiles and more powerful processors in these devices creates an urgent need for advanced thermal management solutions, a niche where graphene-based membranes excel due to their exceptional thermal conductivity and flexibility. Asia Pacific, particularly countries like China, South Korea, and Taiwan, emerges as the leading region due to its established dominance in global consumer electronics manufacturing. This region benefits from robust R&D capabilities, a well-developed supply chain for advanced materials, and significant government support for technological innovation. In 2025, the Consumer Electronics segment is estimated to command a market share of approximately 45% of the total Graphene based Heat Dissipation Membrane market.
Dominant Segment: Consumer Electronics
- Key Drivers: Miniaturization of devices, increasing processing power, demand for energy efficiency, growing adoption of 5G technology requiring enhanced thermal management.
- Market Share (2025): ~45% of total market.
- Growth Potential: High, driven by continuous innovation in device design and functionality.
Dominant Region: Asia Pacific
- Key Drivers: Global hub for consumer electronics manufacturing, strong R&D infrastructure, supportive government policies, presence of key component suppliers.
- Economic Policies: Incentives for high-tech manufacturing and material science research.
- Infrastructure: Advanced manufacturing facilities and logistics networks.
Dominant Type: Composite Type
- Key Drivers: Versatility in customization, tailored thermal performance for specific applications, integration with other materials for enhanced functionality.
- Market Share (2025): ~60% of total market within the graphene membrane type.
- Growth Potential: Strong, as manufacturers seek optimized solutions for diverse device requirements.
Graphene based Heat Dissipation Membrane Product Landscape
The product landscape of Graphene based Heat Dissipation Membranes is characterized by ongoing innovation aimed at optimizing thermal conductivity, mechanical properties, and ease of integration. Manufacturers are developing membranes with thermal conductivity exceeding 500 W/mK, significantly outperforming conventional materials. Key product innovations include ultra-thin membranes for tight space constraints, flexible variants for curved surfaces, and composites integrating graphene with polymers or ceramics for enhanced durability and electrical insulation. Unique selling propositions often revolve around achieving superior heat dissipation with minimal weight and thickness, crucial for portable electronics. Technological advancements are focused on improving the uniformity of graphene dispersion and controlling the interfacial thermal resistance for maximum heat transfer efficiency.
Key Drivers, Barriers & Challenges in Graphene based Heat Dissipation Membrane
Key Drivers: The market for Graphene based Heat Dissipation Membranes is primarily propelled by the increasing demand for efficient thermal management in high-performance electronic devices. This includes the miniaturization trend in consumer electronics, the growing complexity of automotive electronics, and the expanding capacity of data centers, all of which generate significant heat. The superior thermal conductivity of graphene, offering significantly better heat dissipation compared to traditional materials, is a fundamental driver. Government initiatives promoting energy efficiency and advanced material development also play a crucial role. Furthermore, the development of advanced manufacturing techniques is making graphene production more scalable and cost-effective.
Barriers & Challenges: Despite its promising attributes, the Graphene based Heat Dissipation Membrane market faces several challenges. The high cost of producing high-quality, defect-free graphene remains a significant barrier to widespread adoption, especially for cost-sensitive applications. Scalability issues in large-scale manufacturing can also impact supply chain reliability. Regulatory hurdles and the lack of standardized testing and certification for graphene-based materials can hinder market entry. Furthermore, intense competition from established thermal management solutions, while being outperformed, still holds a significant market share due to their lower cost and proven track record. Supply chain disruptions and the need for specialized handling and processing equipment also present challenges. The estimated cost of high-quality graphene production can be between $100-$500 per kilogram, significantly higher than conventional materials.
Emerging Opportunities in Graphene based Heat Dissipation Membrane
Emerging opportunities in the Graphene based Heat Dissipation Membrane market lie in the expansion into new application sectors and the development of novel functionalities. The automotive industry, with the rapid electrification and integration of advanced driver-assistance systems (ADAS), presents a significant untapped market. Similarly, the burgeoning medical device industry, requiring compact and reliable thermal solutions, offers substantial growth potential. The development of smart textiles incorporating graphene for temperature regulation and the use of these membranes in renewable energy systems, such as solar panels and battery storage, represent innovative applications. Furthermore, the increasing focus on sustainable and eco-friendly materials opens avenues for graphene-based solutions that offer superior performance with a potentially reduced environmental footprint.
Growth Accelerators in the Graphene based Heat Dissipation Membrane Industry
Several catalysts are accelerating the long-term growth of the Graphene based Heat Dissipation Membrane industry. Breakthroughs in large-scale, cost-effective graphene synthesis, such as improved chemical vapor deposition (CVD) techniques and liquid-phase exfoliation, are crucial. Strategic partnerships between graphene manufacturers and leading electronics and automotive companies are vital for co-development and market validation of tailored solutions. Market expansion strategies targeting nascent but high-growth sectors like advanced aerospace components and specialized industrial equipment will further fuel demand. The continuous innovation in material science, leading to the development of hybrid membranes with enhanced properties, also acts as a significant growth accelerator, expanding the applicability and performance envelope of these materials.
Key Players Shaping the Graphene based Heat Dissipation Membrane Market
- SKC
- MINORU Co.,Ltd.
- Global Graphene Group
- Graphite Central
- 6Carbon Technology
- Asink Green Technology
- StonePlus Thermal
- Morion Nanotechnology
- The Sixth Element (Changzhou) Materials
- Xin Derui Technology
- Henan Keliwei Nano Carbon Material
- Shenzhen Alkene Technology
- T-Global
- RYAN TECHNOLOGY
- Shenzhen Shidao Technology
- Dongguan Zesion Electronic Technology
- Baknor
Notable Milestones in Graphene based Heat Dissipation Membrane Sector
- 2020: Launch of ultra-thin graphene heat dissipation films by major consumer electronics component suppliers, enabling sleeker device designs.
- 2021: Significant advancements in scalable graphene production technologies, leading to a projected cost reduction of 15-20% for high-quality graphene.
- 2022: Strategic collaborations formed between graphene material innovators and leading automotive manufacturers for the integration of graphene-based thermal management in electric vehicles (EVs).
- 2023: Introduction of composite graphene heat dissipation membranes with enhanced dielectric properties, expanding applications in high-frequency communication equipment.
- Early 2024: Increased venture capital funding rounds for graphene technology startups, signaling investor confidence in the future growth of the market.
In-Depth Graphene based Heat Dissipation Membrane Market Outlook
The future market potential for Graphene based Heat Dissipation Membranes is exceptionally bright, underpinned by a convergence of technological advancements and evolving industry demands. Growth accelerators such as continuous improvements in manufacturing efficiency and cost reduction will make these advanced materials more accessible across a wider range of applications. Strategic partnerships and collaborations will be instrumental in driving market penetration, particularly in the automotive and data center segments, which are projected to experience significant growth. The increasing sophistication of electronic devices, coupled with a global push towards energy efficiency and sustainable technologies, positions graphene-based heat dissipation membranes as a critical component for future innovation. The market is expected to witness substantial growth, driven by the unique ability of graphene to address critical thermal management challenges in the ever-evolving technological landscape.
Graphene based Heat Dissipation Membrane Segmentation
-
1. Application
- 1.1. Consumer Electronics
- 1.2. Automotive Electronics
- 1.3. Data Center and Communication Equipment
- 1.4. Others
-
2. Types
- 2.1. Regular Type
- 2.2. Composite Type
Graphene based Heat Dissipation Membrane Segmentation By Geography
-
1. North America
- 1.1. United States
- 1.2. Canada
- 1.3. Mexico
-
2. South America
- 2.1. Brazil
- 2.2. Argentina
- 2.3. Rest of South America
-
3. Europe
- 3.1. United Kingdom
- 3.2. Germany
- 3.3. France
- 3.4. Italy
- 3.5. Spain
- 3.6. Russia
- 3.7. Benelux
- 3.8. Nordics
- 3.9. Rest of Europe
-
4. Middle East & Africa
- 4.1. Turkey
- 4.2. Israel
- 4.3. GCC
- 4.4. North Africa
- 4.5. South Africa
- 4.6. Rest of Middle East & Africa
-
5. Asia Pacific
- 5.1. China
- 5.2. India
- 5.3. Japan
- 5.4. South Korea
- 5.5. ASEAN
- 5.6. Oceania
- 5.7. Rest of Asia Pacific
Graphene based Heat Dissipation Membrane REPORT HIGHLIGHTS
| Aspects | Details |
|---|---|
| Study Period | 2019-2033 |
| Base Year | 2024 |
| Estimated Year | 2025 |
| Forecast Period | 2025-2033 |
| Historical Period | 2019-2024 |
| Growth Rate | CAGR of XX% from 2019-2033 |
| Segmentation |
|
Table of Contents
- 1. Introduction
- 1.1. Research Scope
- 1.2. Market Segmentation
- 1.3. Research Methodology
- 1.4. Definitions and Assumptions
- 2. Executive Summary
- 2.1. Introduction
- 3. Market Dynamics
- 3.1. Introduction
- 3.2. Market Drivers
- 3.3. Market Restrains
- 3.4. Market Trends
- 4. Market Factor Analysis
- 4.1. Porters Five Forces
- 4.2. Supply/Value Chain
- 4.3. PESTEL analysis
- 4.4. Market Entropy
- 4.5. Patent/Trademark Analysis
- 5. Global Graphene based Heat Dissipation Membrane Analysis, Insights and Forecast, 2019-2031
- 5.1. Market Analysis, Insights and Forecast - by Application
- 5.1.1. Consumer Electronics
- 5.1.2. Automotive Electronics
- 5.1.3. Data Center and Communication Equipment
- 5.1.4. Others
- 5.2. Market Analysis, Insights and Forecast - by Types
- 5.2.1. Regular Type
- 5.2.2. Composite Type
- 5.3. Market Analysis, Insights and Forecast - by Region
- 5.3.1. North America
- 5.3.2. South America
- 5.3.3. Europe
- 5.3.4. Middle East & Africa
- 5.3.5. Asia Pacific
- 5.1. Market Analysis, Insights and Forecast - by Application
- 6. North America Graphene based Heat Dissipation Membrane Analysis, Insights and Forecast, 2019-2031
- 6.1. Market Analysis, Insights and Forecast - by Application
- 6.1.1. Consumer Electronics
- 6.1.2. Automotive Electronics
- 6.1.3. Data Center and Communication Equipment
- 6.1.4. Others
- 6.2. Market Analysis, Insights and Forecast - by Types
- 6.2.1. Regular Type
- 6.2.2. Composite Type
- 6.1. Market Analysis, Insights and Forecast - by Application
- 7. South America Graphene based Heat Dissipation Membrane Analysis, Insights and Forecast, 2019-2031
- 7.1. Market Analysis, Insights and Forecast - by Application
- 7.1.1. Consumer Electronics
- 7.1.2. Automotive Electronics
- 7.1.3. Data Center and Communication Equipment
- 7.1.4. Others
- 7.2. Market Analysis, Insights and Forecast - by Types
- 7.2.1. Regular Type
- 7.2.2. Composite Type
- 7.1. Market Analysis, Insights and Forecast - by Application
- 8. Europe Graphene based Heat Dissipation Membrane Analysis, Insights and Forecast, 2019-2031
- 8.1. Market Analysis, Insights and Forecast - by Application
- 8.1.1. Consumer Electronics
- 8.1.2. Automotive Electronics
- 8.1.3. Data Center and Communication Equipment
- 8.1.4. Others
- 8.2. Market Analysis, Insights and Forecast - by Types
- 8.2.1. Regular Type
- 8.2.2. Composite Type
- 8.1. Market Analysis, Insights and Forecast - by Application
- 9. Middle East & Africa Graphene based Heat Dissipation Membrane Analysis, Insights and Forecast, 2019-2031
- 9.1. Market Analysis, Insights and Forecast - by Application
- 9.1.1. Consumer Electronics
- 9.1.2. Automotive Electronics
- 9.1.3. Data Center and Communication Equipment
- 9.1.4. Others
- 9.2. Market Analysis, Insights and Forecast - by Types
- 9.2.1. Regular Type
- 9.2.2. Composite Type
- 9.1. Market Analysis, Insights and Forecast - by Application
- 10. Asia Pacific Graphene based Heat Dissipation Membrane Analysis, Insights and Forecast, 2019-2031
- 10.1. Market Analysis, Insights and Forecast - by Application
- 10.1.1. Consumer Electronics
- 10.1.2. Automotive Electronics
- 10.1.3. Data Center and Communication Equipment
- 10.1.4. Others
- 10.2. Market Analysis, Insights and Forecast - by Types
- 10.2.1. Regular Type
- 10.2.2. Composite Type
- 10.1. Market Analysis, Insights and Forecast - by Application
- 11. Competitive Analysis
- 11.1. Global Market Share Analysis 2024
- 11.2. Company Profiles
- 11.2.1 SKC
- 11.2.1.1. Overview
- 11.2.1.2. Products
- 11.2.1.3. SWOT Analysis
- 11.2.1.4. Recent Developments
- 11.2.1.5. Financials (Based on Availability)
- 11.2.2 MINORU Co.
- 11.2.2.1. Overview
- 11.2.2.2. Products
- 11.2.2.3. SWOT Analysis
- 11.2.2.4. Recent Developments
- 11.2.2.5. Financials (Based on Availability)
- 11.2.3 Ltd.
- 11.2.3.1. Overview
- 11.2.3.2. Products
- 11.2.3.3. SWOT Analysis
- 11.2.3.4. Recent Developments
- 11.2.3.5. Financials (Based on Availability)
- 11.2.4 Global Graphene Group
- 11.2.4.1. Overview
- 11.2.4.2. Products
- 11.2.4.3. SWOT Analysis
- 11.2.4.4. Recent Developments
- 11.2.4.5. Financials (Based on Availability)
- 11.2.5 Graphite Central
- 11.2.5.1. Overview
- 11.2.5.2. Products
- 11.2.5.3. SWOT Analysis
- 11.2.5.4. Recent Developments
- 11.2.5.5. Financials (Based on Availability)
- 11.2.6 6Carbon Technology
- 11.2.6.1. Overview
- 11.2.6.2. Products
- 11.2.6.3. SWOT Analysis
- 11.2.6.4. Recent Developments
- 11.2.6.5. Financials (Based on Availability)
- 11.2.7 Asink Green Technology
- 11.2.7.1. Overview
- 11.2.7.2. Products
- 11.2.7.3. SWOT Analysis
- 11.2.7.4. Recent Developments
- 11.2.7.5. Financials (Based on Availability)
- 11.2.8 StonePlus Thermal
- 11.2.8.1. Overview
- 11.2.8.2. Products
- 11.2.8.3. SWOT Analysis
- 11.2.8.4. Recent Developments
- 11.2.8.5. Financials (Based on Availability)
- 11.2.9 Morion Nanotechnology
- 11.2.9.1. Overview
- 11.2.9.2. Products
- 11.2.9.3. SWOT Analysis
- 11.2.9.4. Recent Developments
- 11.2.9.5. Financials (Based on Availability)
- 11.2.10 The Sixth Element (Changzhou) Materials
- 11.2.10.1. Overview
- 11.2.10.2. Products
- 11.2.10.3. SWOT Analysis
- 11.2.10.4. Recent Developments
- 11.2.10.5. Financials (Based on Availability)
- 11.2.11 Xin Derui Technology
- 11.2.11.1. Overview
- 11.2.11.2. Products
- 11.2.11.3. SWOT Analysis
- 11.2.11.4. Recent Developments
- 11.2.11.5. Financials (Based on Availability)
- 11.2.12 Henan Keliwei Nano Carbon Material
- 11.2.12.1. Overview
- 11.2.12.2. Products
- 11.2.12.3. SWOT Analysis
- 11.2.12.4. Recent Developments
- 11.2.12.5. Financials (Based on Availability)
- 11.2.13 Shenzhen Alkene Technology
- 11.2.13.1. Overview
- 11.2.13.2. Products
- 11.2.13.3. SWOT Analysis
- 11.2.13.4. Recent Developments
- 11.2.13.5. Financials (Based on Availability)
- 11.2.14 T-Global
- 11.2.14.1. Overview
- 11.2.14.2. Products
- 11.2.14.3. SWOT Analysis
- 11.2.14.4. Recent Developments
- 11.2.14.5. Financials (Based on Availability)
- 11.2.15 RYAN TECHNOLOGY
- 11.2.15.1. Overview
- 11.2.15.2. Products
- 11.2.15.3. SWOT Analysis
- 11.2.15.4. Recent Developments
- 11.2.15.5. Financials (Based on Availability)
- 11.2.16 Shenzhen Shidao Technology
- 11.2.16.1. Overview
- 11.2.16.2. Products
- 11.2.16.3. SWOT Analysis
- 11.2.16.4. Recent Developments
- 11.2.16.5. Financials (Based on Availability)
- 11.2.17 Dongguan Zesion Electronic Technology
- 11.2.17.1. Overview
- 11.2.17.2. Products
- 11.2.17.3. SWOT Analysis
- 11.2.17.4. Recent Developments
- 11.2.17.5. Financials (Based on Availability)
- 11.2.18 Baknor
- 11.2.18.1. Overview
- 11.2.18.2. Products
- 11.2.18.3. SWOT Analysis
- 11.2.18.4. Recent Developments
- 11.2.18.5. Financials (Based on Availability)
- 11.2.1 SKC
List of Figures
- Figure 1: Global Graphene based Heat Dissipation Membrane Revenue Breakdown (million, %) by Region 2024 & 2032
- Figure 2: Global Graphene based Heat Dissipation Membrane Volume Breakdown (K, %) by Region 2024 & 2032
- Figure 3: North America Graphene based Heat Dissipation Membrane Revenue (million), by Application 2024 & 2032
- Figure 4: North America Graphene based Heat Dissipation Membrane Volume (K), by Application 2024 & 2032
- Figure 5: North America Graphene based Heat Dissipation Membrane Revenue Share (%), by Application 2024 & 2032
- Figure 6: North America Graphene based Heat Dissipation Membrane Volume Share (%), by Application 2024 & 2032
- Figure 7: North America Graphene based Heat Dissipation Membrane Revenue (million), by Types 2024 & 2032
- Figure 8: North America Graphene based Heat Dissipation Membrane Volume (K), by Types 2024 & 2032
- Figure 9: North America Graphene based Heat Dissipation Membrane Revenue Share (%), by Types 2024 & 2032
- Figure 10: North America Graphene based Heat Dissipation Membrane Volume Share (%), by Types 2024 & 2032
- Figure 11: North America Graphene based Heat Dissipation Membrane Revenue (million), by Country 2024 & 2032
- Figure 12: North America Graphene based Heat Dissipation Membrane Volume (K), by Country 2024 & 2032
- Figure 13: North America Graphene based Heat Dissipation Membrane Revenue Share (%), by Country 2024 & 2032
- Figure 14: North America Graphene based Heat Dissipation Membrane Volume Share (%), by Country 2024 & 2032
- Figure 15: South America Graphene based Heat Dissipation Membrane Revenue (million), by Application 2024 & 2032
- Figure 16: South America Graphene based Heat Dissipation Membrane Volume (K), by Application 2024 & 2032
- Figure 17: South America Graphene based Heat Dissipation Membrane Revenue Share (%), by Application 2024 & 2032
- Figure 18: South America Graphene based Heat Dissipation Membrane Volume Share (%), by Application 2024 & 2032
- Figure 19: South America Graphene based Heat Dissipation Membrane Revenue (million), by Types 2024 & 2032
- Figure 20: South America Graphene based Heat Dissipation Membrane Volume (K), by Types 2024 & 2032
- Figure 21: South America Graphene based Heat Dissipation Membrane Revenue Share (%), by Types 2024 & 2032
- Figure 22: South America Graphene based Heat Dissipation Membrane Volume Share (%), by Types 2024 & 2032
- Figure 23: South America Graphene based Heat Dissipation Membrane Revenue (million), by Country 2024 & 2032
- Figure 24: South America Graphene based Heat Dissipation Membrane Volume (K), by Country 2024 & 2032
- Figure 25: South America Graphene based Heat Dissipation Membrane Revenue Share (%), by Country 2024 & 2032
- Figure 26: South America Graphene based Heat Dissipation Membrane Volume Share (%), by Country 2024 & 2032
- Figure 27: Europe Graphene based Heat Dissipation Membrane Revenue (million), by Application 2024 & 2032
- Figure 28: Europe Graphene based Heat Dissipation Membrane Volume (K), by Application 2024 & 2032
- Figure 29: Europe Graphene based Heat Dissipation Membrane Revenue Share (%), by Application 2024 & 2032
- Figure 30: Europe Graphene based Heat Dissipation Membrane Volume Share (%), by Application 2024 & 2032
- Figure 31: Europe Graphene based Heat Dissipation Membrane Revenue (million), by Types 2024 & 2032
- Figure 32: Europe Graphene based Heat Dissipation Membrane Volume (K), by Types 2024 & 2032
- Figure 33: Europe Graphene based Heat Dissipation Membrane Revenue Share (%), by Types 2024 & 2032
- Figure 34: Europe Graphene based Heat Dissipation Membrane Volume Share (%), by Types 2024 & 2032
- Figure 35: Europe Graphene based Heat Dissipation Membrane Revenue (million), by Country 2024 & 2032
- Figure 36: Europe Graphene based Heat Dissipation Membrane Volume (K), by Country 2024 & 2032
- Figure 37: Europe Graphene based Heat Dissipation Membrane Revenue Share (%), by Country 2024 & 2032
- Figure 38: Europe Graphene based Heat Dissipation Membrane Volume Share (%), by Country 2024 & 2032
- Figure 39: Middle East & Africa Graphene based Heat Dissipation Membrane Revenue (million), by Application 2024 & 2032
- Figure 40: Middle East & Africa Graphene based Heat Dissipation Membrane Volume (K), by Application 2024 & 2032
- Figure 41: Middle East & Africa Graphene based Heat Dissipation Membrane Revenue Share (%), by Application 2024 & 2032
- Figure 42: Middle East & Africa Graphene based Heat Dissipation Membrane Volume Share (%), by Application 2024 & 2032
- Figure 43: Middle East & Africa Graphene based Heat Dissipation Membrane Revenue (million), by Types 2024 & 2032
- Figure 44: Middle East & Africa Graphene based Heat Dissipation Membrane Volume (K), by Types 2024 & 2032
- Figure 45: Middle East & Africa Graphene based Heat Dissipation Membrane Revenue Share (%), by Types 2024 & 2032
- Figure 46: Middle East & Africa Graphene based Heat Dissipation Membrane Volume Share (%), by Types 2024 & 2032
- Figure 47: Middle East & Africa Graphene based Heat Dissipation Membrane Revenue (million), by Country 2024 & 2032
- Figure 48: Middle East & Africa Graphene based Heat Dissipation Membrane Volume (K), by Country 2024 & 2032
- Figure 49: Middle East & Africa Graphene based Heat Dissipation Membrane Revenue Share (%), by Country 2024 & 2032
- Figure 50: Middle East & Africa Graphene based Heat Dissipation Membrane Volume Share (%), by Country 2024 & 2032
- Figure 51: Asia Pacific Graphene based Heat Dissipation Membrane Revenue (million), by Application 2024 & 2032
- Figure 52: Asia Pacific Graphene based Heat Dissipation Membrane Volume (K), by Application 2024 & 2032
- Figure 53: Asia Pacific Graphene based Heat Dissipation Membrane Revenue Share (%), by Application 2024 & 2032
- Figure 54: Asia Pacific Graphene based Heat Dissipation Membrane Volume Share (%), by Application 2024 & 2032
- Figure 55: Asia Pacific Graphene based Heat Dissipation Membrane Revenue (million), by Types 2024 & 2032
- Figure 56: Asia Pacific Graphene based Heat Dissipation Membrane Volume (K), by Types 2024 & 2032
- Figure 57: Asia Pacific Graphene based Heat Dissipation Membrane Revenue Share (%), by Types 2024 & 2032
- Figure 58: Asia Pacific Graphene based Heat Dissipation Membrane Volume Share (%), by Types 2024 & 2032
- Figure 59: Asia Pacific Graphene based Heat Dissipation Membrane Revenue (million), by Country 2024 & 2032
- Figure 60: Asia Pacific Graphene based Heat Dissipation Membrane Volume (K), by Country 2024 & 2032
- Figure 61: Asia Pacific Graphene based Heat Dissipation Membrane Revenue Share (%), by Country 2024 & 2032
- Figure 62: Asia Pacific Graphene based Heat Dissipation Membrane Volume Share (%), by Country 2024 & 2032
List of Tables
- Table 1: Global Graphene based Heat Dissipation Membrane Revenue million Forecast, by Region 2019 & 2032
- Table 2: Global Graphene based Heat Dissipation Membrane Volume K Forecast, by Region 2019 & 2032
- Table 3: Global Graphene based Heat Dissipation Membrane Revenue million Forecast, by Application 2019 & 2032
- Table 4: Global Graphene based Heat Dissipation Membrane Volume K Forecast, by Application 2019 & 2032
- Table 5: Global Graphene based Heat Dissipation Membrane Revenue million Forecast, by Types 2019 & 2032
- Table 6: Global Graphene based Heat Dissipation Membrane Volume K Forecast, by Types 2019 & 2032
- Table 7: Global Graphene based Heat Dissipation Membrane Revenue million Forecast, by Region 2019 & 2032
- Table 8: Global Graphene based Heat Dissipation Membrane Volume K Forecast, by Region 2019 & 2032
- Table 9: Global Graphene based Heat Dissipation Membrane Revenue million Forecast, by Application 2019 & 2032
- Table 10: Global Graphene based Heat Dissipation Membrane Volume K Forecast, by Application 2019 & 2032
- Table 11: Global Graphene based Heat Dissipation Membrane Revenue million Forecast, by Types 2019 & 2032
- Table 12: Global Graphene based Heat Dissipation Membrane Volume K Forecast, by Types 2019 & 2032
- Table 13: Global Graphene based Heat Dissipation Membrane Revenue million Forecast, by Country 2019 & 2032
- Table 14: Global Graphene based Heat Dissipation Membrane Volume K Forecast, by Country 2019 & 2032
- Table 15: United States Graphene based Heat Dissipation Membrane Revenue (million) Forecast, by Application 2019 & 2032
- Table 16: United States Graphene based Heat Dissipation Membrane Volume (K) Forecast, by Application 2019 & 2032
- Table 17: Canada Graphene based Heat Dissipation Membrane Revenue (million) Forecast, by Application 2019 & 2032
- Table 18: Canada Graphene based Heat Dissipation Membrane Volume (K) Forecast, by Application 2019 & 2032
- Table 19: Mexico Graphene based Heat Dissipation Membrane Revenue (million) Forecast, by Application 2019 & 2032
- Table 20: Mexico Graphene based Heat Dissipation Membrane Volume (K) Forecast, by Application 2019 & 2032
- Table 21: Global Graphene based Heat Dissipation Membrane Revenue million Forecast, by Application 2019 & 2032
- Table 22: Global Graphene based Heat Dissipation Membrane Volume K Forecast, by Application 2019 & 2032
- Table 23: Global Graphene based Heat Dissipation Membrane Revenue million Forecast, by Types 2019 & 2032
- Table 24: Global Graphene based Heat Dissipation Membrane Volume K Forecast, by Types 2019 & 2032
- Table 25: Global Graphene based Heat Dissipation Membrane Revenue million Forecast, by Country 2019 & 2032
- Table 26: Global Graphene based Heat Dissipation Membrane Volume K Forecast, by Country 2019 & 2032
- Table 27: Brazil Graphene based Heat Dissipation Membrane Revenue (million) Forecast, by Application 2019 & 2032
- Table 28: Brazil Graphene based Heat Dissipation Membrane Volume (K) Forecast, by Application 2019 & 2032
- Table 29: Argentina Graphene based Heat Dissipation Membrane Revenue (million) Forecast, by Application 2019 & 2032
- Table 30: Argentina Graphene based Heat Dissipation Membrane Volume (K) Forecast, by Application 2019 & 2032
- Table 31: Rest of South America Graphene based Heat Dissipation Membrane Revenue (million) Forecast, by Application 2019 & 2032
- Table 32: Rest of South America Graphene based Heat Dissipation Membrane Volume (K) Forecast, by Application 2019 & 2032
- Table 33: Global Graphene based Heat Dissipation Membrane Revenue million Forecast, by Application 2019 & 2032
- Table 34: Global Graphene based Heat Dissipation Membrane Volume K Forecast, by Application 2019 & 2032
- Table 35: Global Graphene based Heat Dissipation Membrane Revenue million Forecast, by Types 2019 & 2032
- Table 36: Global Graphene based Heat Dissipation Membrane Volume K Forecast, by Types 2019 & 2032
- Table 37: Global Graphene based Heat Dissipation Membrane Revenue million Forecast, by Country 2019 & 2032
- Table 38: Global Graphene based Heat Dissipation Membrane Volume K Forecast, by Country 2019 & 2032
- Table 39: United Kingdom Graphene based Heat Dissipation Membrane Revenue (million) Forecast, by Application 2019 & 2032
- Table 40: United Kingdom Graphene based Heat Dissipation Membrane Volume (K) Forecast, by Application 2019 & 2032
- Table 41: Germany Graphene based Heat Dissipation Membrane Revenue (million) Forecast, by Application 2019 & 2032
- Table 42: Germany Graphene based Heat Dissipation Membrane Volume (K) Forecast, by Application 2019 & 2032
- Table 43: France Graphene based Heat Dissipation Membrane Revenue (million) Forecast, by Application 2019 & 2032
- Table 44: France Graphene based Heat Dissipation Membrane Volume (K) Forecast, by Application 2019 & 2032
- Table 45: Italy Graphene based Heat Dissipation Membrane Revenue (million) Forecast, by Application 2019 & 2032
- Table 46: Italy Graphene based Heat Dissipation Membrane Volume (K) Forecast, by Application 2019 & 2032
- Table 47: Spain Graphene based Heat Dissipation Membrane Revenue (million) Forecast, by Application 2019 & 2032
- Table 48: Spain Graphene based Heat Dissipation Membrane Volume (K) Forecast, by Application 2019 & 2032
- Table 49: Russia Graphene based Heat Dissipation Membrane Revenue (million) Forecast, by Application 2019 & 2032
- Table 50: Russia Graphene based Heat Dissipation Membrane Volume (K) Forecast, by Application 2019 & 2032
- Table 51: Benelux Graphene based Heat Dissipation Membrane Revenue (million) Forecast, by Application 2019 & 2032
- Table 52: Benelux Graphene based Heat Dissipation Membrane Volume (K) Forecast, by Application 2019 & 2032
- Table 53: Nordics Graphene based Heat Dissipation Membrane Revenue (million) Forecast, by Application 2019 & 2032
- Table 54: Nordics Graphene based Heat Dissipation Membrane Volume (K) Forecast, by Application 2019 & 2032
- Table 55: Rest of Europe Graphene based Heat Dissipation Membrane Revenue (million) Forecast, by Application 2019 & 2032
- Table 56: Rest of Europe Graphene based Heat Dissipation Membrane Volume (K) Forecast, by Application 2019 & 2032
- Table 57: Global Graphene based Heat Dissipation Membrane Revenue million Forecast, by Application 2019 & 2032
- Table 58: Global Graphene based Heat Dissipation Membrane Volume K Forecast, by Application 2019 & 2032
- Table 59: Global Graphene based Heat Dissipation Membrane Revenue million Forecast, by Types 2019 & 2032
- Table 60: Global Graphene based Heat Dissipation Membrane Volume K Forecast, by Types 2019 & 2032
- Table 61: Global Graphene based Heat Dissipation Membrane Revenue million Forecast, by Country 2019 & 2032
- Table 62: Global Graphene based Heat Dissipation Membrane Volume K Forecast, by Country 2019 & 2032
- Table 63: Turkey Graphene based Heat Dissipation Membrane Revenue (million) Forecast, by Application 2019 & 2032
- Table 64: Turkey Graphene based Heat Dissipation Membrane Volume (K) Forecast, by Application 2019 & 2032
- Table 65: Israel Graphene based Heat Dissipation Membrane Revenue (million) Forecast, by Application 2019 & 2032
- Table 66: Israel Graphene based Heat Dissipation Membrane Volume (K) Forecast, by Application 2019 & 2032
- Table 67: GCC Graphene based Heat Dissipation Membrane Revenue (million) Forecast, by Application 2019 & 2032
- Table 68: GCC Graphene based Heat Dissipation Membrane Volume (K) Forecast, by Application 2019 & 2032
- Table 69: North Africa Graphene based Heat Dissipation Membrane Revenue (million) Forecast, by Application 2019 & 2032
- Table 70: North Africa Graphene based Heat Dissipation Membrane Volume (K) Forecast, by Application 2019 & 2032
- Table 71: South Africa Graphene based Heat Dissipation Membrane Revenue (million) Forecast, by Application 2019 & 2032
- Table 72: South Africa Graphene based Heat Dissipation Membrane Volume (K) Forecast, by Application 2019 & 2032
- Table 73: Rest of Middle East & Africa Graphene based Heat Dissipation Membrane Revenue (million) Forecast, by Application 2019 & 2032
- Table 74: Rest of Middle East & Africa Graphene based Heat Dissipation Membrane Volume (K) Forecast, by Application 2019 & 2032
- Table 75: Global Graphene based Heat Dissipation Membrane Revenue million Forecast, by Application 2019 & 2032
- Table 76: Global Graphene based Heat Dissipation Membrane Volume K Forecast, by Application 2019 & 2032
- Table 77: Global Graphene based Heat Dissipation Membrane Revenue million Forecast, by Types 2019 & 2032
- Table 78: Global Graphene based Heat Dissipation Membrane Volume K Forecast, by Types 2019 & 2032
- Table 79: Global Graphene based Heat Dissipation Membrane Revenue million Forecast, by Country 2019 & 2032
- Table 80: Global Graphene based Heat Dissipation Membrane Volume K Forecast, by Country 2019 & 2032
- Table 81: China Graphene based Heat Dissipation Membrane Revenue (million) Forecast, by Application 2019 & 2032
- Table 82: China Graphene based Heat Dissipation Membrane Volume (K) Forecast, by Application 2019 & 2032
- Table 83: India Graphene based Heat Dissipation Membrane Revenue (million) Forecast, by Application 2019 & 2032
- Table 84: India Graphene based Heat Dissipation Membrane Volume (K) Forecast, by Application 2019 & 2032
- Table 85: Japan Graphene based Heat Dissipation Membrane Revenue (million) Forecast, by Application 2019 & 2032
- Table 86: Japan Graphene based Heat Dissipation Membrane Volume (K) Forecast, by Application 2019 & 2032
- Table 87: South Korea Graphene based Heat Dissipation Membrane Revenue (million) Forecast, by Application 2019 & 2032
- Table 88: South Korea Graphene based Heat Dissipation Membrane Volume (K) Forecast, by Application 2019 & 2032
- Table 89: ASEAN Graphene based Heat Dissipation Membrane Revenue (million) Forecast, by Application 2019 & 2032
- Table 90: ASEAN Graphene based Heat Dissipation Membrane Volume (K) Forecast, by Application 2019 & 2032
- Table 91: Oceania Graphene based Heat Dissipation Membrane Revenue (million) Forecast, by Application 2019 & 2032
- Table 92: Oceania Graphene based Heat Dissipation Membrane Volume (K) Forecast, by Application 2019 & 2032
- Table 93: Rest of Asia Pacific Graphene based Heat Dissipation Membrane Revenue (million) Forecast, by Application 2019 & 2032
- Table 94: Rest of Asia Pacific Graphene based Heat Dissipation Membrane Volume (K) Forecast, by Application 2019 & 2032
Frequently Asked Questions
1. What is the projected Compound Annual Growth Rate (CAGR) of the Graphene based Heat Dissipation Membrane?
The projected CAGR is approximately XX%.
2. Which companies are prominent players in the Graphene based Heat Dissipation Membrane?
Key companies in the market include SKC, MINORU Co., Ltd., Global Graphene Group, Graphite Central, 6Carbon Technology, Asink Green Technology, StonePlus Thermal, Morion Nanotechnology, The Sixth Element (Changzhou) Materials, Xin Derui Technology, Henan Keliwei Nano Carbon Material, Shenzhen Alkene Technology, T-Global, RYAN TECHNOLOGY, Shenzhen Shidao Technology, Dongguan Zesion Electronic Technology, Baknor.
3. What are the main segments of the Graphene based Heat Dissipation Membrane?
The market segments include Application, Types.
4. Can you provide details about the market size?
The market size is estimated to be USD XXX million as of 2022.
5. What are some drivers contributing to market growth?
N/A
6. What are the notable trends driving market growth?
N/A
7. Are there any restraints impacting market growth?
N/A
8. Can you provide examples of recent developments in the market?
N/A
9. What pricing options are available for accessing the report?
Pricing options include single-user, multi-user, and enterprise licenses priced at USD 4350.00, USD 6525.00, and USD 8700.00 respectively.
10. Is the market size provided in terms of value or volume?
The market size is provided in terms of value, measured in million and volume, measured in K.
11. Are there any specific market keywords associated with the report?
Yes, the market keyword associated with the report is "Graphene based Heat Dissipation Membrane," which aids in identifying and referencing the specific market segment covered.
12. How do I determine which pricing option suits my needs best?
The pricing options vary based on user requirements and access needs. Individual users may opt for single-user licenses, while businesses requiring broader access may choose multi-user or enterprise licenses for cost-effective access to the report.
13. Are there any additional resources or data provided in the Graphene based Heat Dissipation Membrane report?
While the report offers comprehensive insights, it's advisable to review the specific contents or supplementary materials provided to ascertain if additional resources or data are available.
14. How can I stay updated on further developments or reports in the Graphene based Heat Dissipation Membrane?
To stay informed about further developments, trends, and reports in the Graphene based Heat Dissipation Membrane, consider subscribing to industry newsletters, following relevant companies and organizations, or regularly checking reputable industry news sources and publications.
Methodology
Step 1 - Identification of Relevant Samples Size from Population Database


Step 2 - Approaches for Defining Global Market Size (Value, Volume* & Price*)

Note*: In applicable scenarios
Step 3 - Data Sources
Primary Research
- Web Analytics
- Survey Reports
- Research Institute
- Latest Research Reports
- Opinion Leaders
Secondary Research
- Annual Reports
- White Paper
- Latest Press Release
- Industry Association
- Paid Database
- Investor Presentations

Step 4 - Data Triangulation
Involves using different sources of information in order to increase the validity of a study
These sources are likely to be stakeholders in a program - participants, other researchers, program staff, other community members, and so on.
Then we put all data in single framework & apply various statistical tools to find out the dynamic on the market.
During the analysis stage, feedback from the stakeholder groups would be compared to determine areas of agreement as well as areas of divergence


