
Key Insights
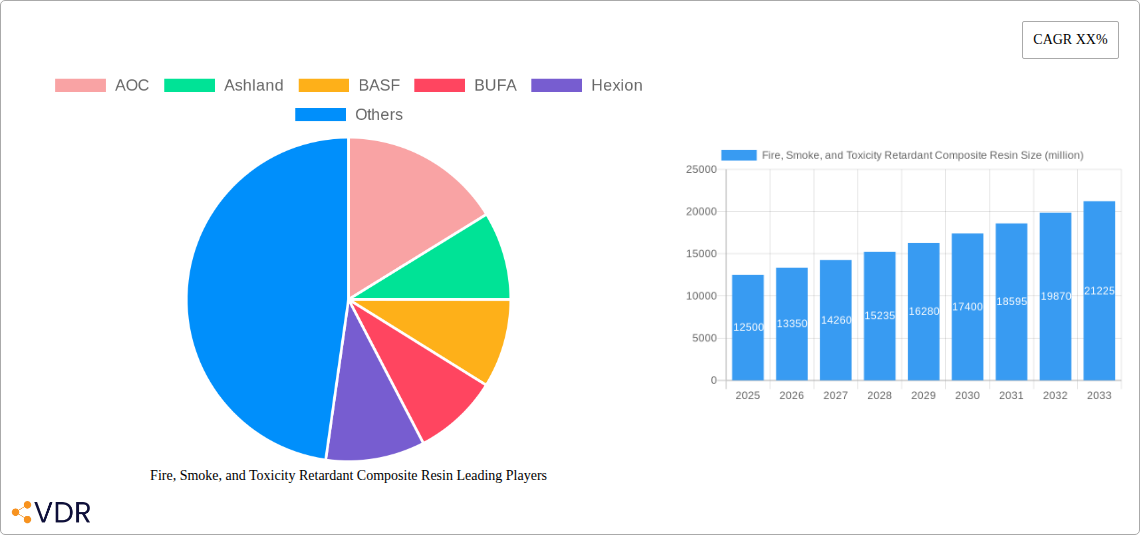
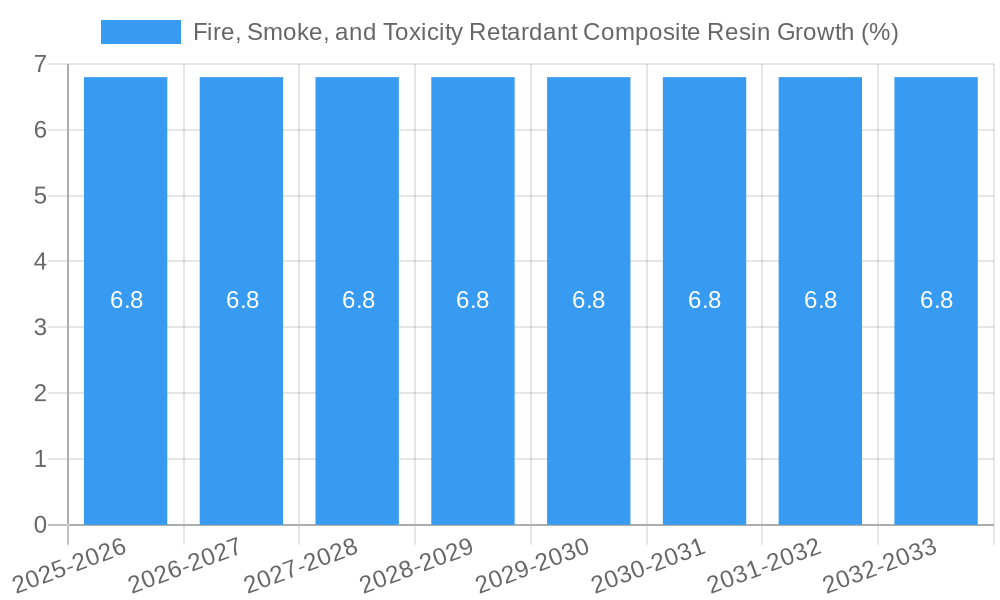
The global Fire, Smoke, and Toxicity (FST) Retardant Composite Resin market is poised for significant expansion, estimated at a market size of approximately USD 12,500 million in 2025, with a projected Compound Annual Growth Rate (CAGR) of around 6.8% through 2033. This robust growth is primarily fueled by increasingly stringent fire safety regulations across various industries, including aerospace, automotive, construction, and electrical & electronics. The escalating demand for lightweight yet highly fire-resistant materials is a major driver, as FST retardant resins offer a compelling solution to enhance passenger safety and minimize property damage in the event of a fire. Furthermore, advancements in resin technology, leading to improved performance characteristics and reduced environmental impact, are contributing to market penetration. The increasing adoption of composites in sectors where fire safety is paramount, such as high-speed rail and marine applications, also plays a crucial role in shaping market dynamics.
The market is characterized by a diverse range of applications, with Lay-Up and Filament Winding segments holding substantial shares due to their widespread use in creating durable and fire-resistant composite structures. Epoxy and Phenolic resins are anticipated to dominate the resin types segment, owing to their inherent flame-retardant properties and versatility. While the market exhibits strong growth potential, certain restraints exist, including the higher cost of FST retardant resins compared to conventional alternatives, which can impact adoption in price-sensitive applications. Additionally, complex processing requirements and the need for specialized manufacturing equipment can pose challenges. Despite these hurdles, the growing awareness of fire safety, coupled with continuous innovation in resin formulations and processing techniques, is expected to drive sustained market expansion and solidify the importance of FST retardant composite resins in critical applications worldwide.
This in-depth market report provides a detailed analysis of the Fire, Smoke, and Toxicity Retardant Composite Resin market, encompassing historical trends, current dynamics, and future projections. With a focus on key applications, resin types, and dominant players, this report offers actionable insights for stakeholders seeking to navigate this rapidly evolving sector. The study period spans from 2019 to 2033, with a base year of 2025 and a forecast period from 2025 to 2033.
Fire, Smoke, and Toxicity Retardant Composite Resin Market Dynamics & Structure
The Fire, Smoke, and Toxicity (FST) Retardant Composite Resin market is characterized by a moderate concentration, with key players like BASF, Hexion, and Huntsman holding significant shares. Technological innovation is a primary driver, fueled by continuous research and development in advanced flame-retardant additives and novel resin formulations that enhance performance while meeting stringent safety regulations. Regulatory frameworks, particularly those concerning fire safety in construction, transportation, and electronics, are crucial in shaping market demand. For instance, evolving building codes and international standards for fire performance are compelling manufacturers to adopt FST-retardant materials. Competitive product substitutes, such as traditional thermoset resins without specialized retardant properties or non-composite materials, are present but are increasingly disadvantaged by performance and regulatory demands. End-user demographics are shifting towards industries with higher safety consciousness, including aerospace, automotive, and renewable energy. Mergers and acquisitions (M&A) activity remains a strategic tool for market consolidation and expansion, with an estimated volume of 5-8 M&A deals annually over the historical period, contributing to market reshaping. Innovation barriers include the high cost of R&D for advanced FST additives, the complex process of material certification, and the need for specialized manufacturing infrastructure.
Fire, Smoke, and Toxicity Retardant Composite Resin Growth Trends & Insights
The global Fire, Smoke, and Toxicity Retardant Composite Resin market is poised for robust growth, driven by an escalating demand for enhanced safety solutions across numerous industries. Over the study period (2019–2033), the market has witnessed a steady upward trajectory, with an anticipated Compound Annual Growth Rate (CAGR) of approximately 6.5% during the forecast period (2025–2033). This growth is underpinned by increasing adoption rates of composite materials in applications where fire safety is paramount. Technological disruptions, such as the development of halogen-free flame retardants and advanced nanotechnology-based additives, are revolutionizing resin formulations, offering superior FST properties without compromising mechanical performance or environmental impact. Consumer behavior shifts are also playing a significant role, with a growing preference for lightweight, durable, and inherently safe materials in sectors like automotive, aerospace, and construction. The market penetration of FST retardant composite resins is expected to expand significantly as regulatory mandates become more stringent and awareness of the benefits of these advanced materials increases. For example, in the automotive sector, the drive towards electric vehicles necessitates materials with enhanced fire resistance to manage battery thermal runaway risks. Similarly, in the aerospace industry, adherence to strict FST regulations is non-negotiable. The market size, estimated at USD 10.5 billion in the base year 2025, is projected to reach USD 17.5 billion by 2033, reflecting sustained demand and technological advancements.
Dominant Regions, Countries, or Segments in Fire, Smoke, and Toxicity Retardant Composite Resin
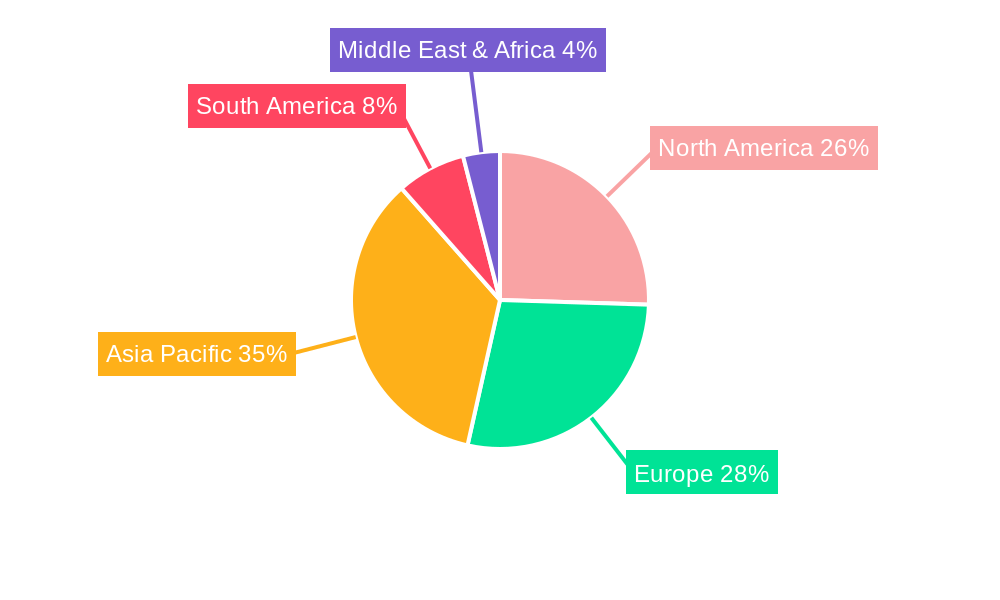
The Epoxy type segment, within the Fire, Smoke, and Toxicity Retardant Composite Resin market, is emerging as a dominant force driving market growth. This dominance is fueled by its exceptional performance characteristics, including high strength-to-weight ratio, excellent chemical resistance, and superior adhesion properties, making it an ideal choice for demanding applications. The Epoxy segment is projected to hold a market share of approximately 35% by 2025. Geographically, North America is leading the charge, driven by stringent safety regulations in the aerospace and automotive sectors, coupled with significant investments in infrastructure development and renewable energy projects. The region’s market share is estimated at 30% in 2025.
Key Drivers in North America:
- Strict regulatory frameworks for fire safety in building codes and transportation.
- High demand from the aerospace industry for lightweight and fire-resistant components.
- Growth in the automotive sector, particularly with the rise of electric vehicles and their specific FST requirements.
- Increased adoption of wind energy, requiring robust and fire-safe composite blades.
- Government incentives for adopting advanced manufacturing technologies.
Dominance Factors for Epoxy Resins:
- Superior Mechanical Properties: Epoxy resins offer excellent tensile strength, flexural strength, and impact resistance, crucial for structural applications.
- Adhesion and Durability: Their inherent adhesive qualities and resistance to chemicals and environmental degradation ensure longevity in harsh conditions.
- Versatility in FST Applications: When formulated with FST additives, epoxy resins can achieve exceptionally high levels of fire resistance, smoke suppression, and toxicity reduction.
- Growing Applications: Epoxy-based composites are increasingly used in wind turbine blades, marine vessels, high-performance sporting goods, and infrastructure repair.
In terms of applications, Lay-Up and Filament Winding techniques are significant contributors, particularly within the Epoxy segment. Lay-up processes are prevalent in manufacturing large structures like wind turbine blades and boat hulls, while filament winding is crucial for producing pipes, pressure vessels, and drive shafts requiring high strength and precise control. The integration of FST retardant properties into these resin systems is non-negotiable for these end-uses, further solidifying the dominance of Epoxy within these application areas. The market share for the Epoxy type is projected to grow at a CAGR of 7.2% from 2025 to 2033, outpacing other resin types.
Fire, Smoke, and Toxicity Retardant Composite Resin Product Landscape
The Fire, Smoke, and Toxicity Retardant Composite Resin product landscape is marked by continuous innovation in formulating resins with enhanced safety profiles. Leading companies are introducing next-generation epoxy, phenolic, and vinylester resins fortified with advanced halogen-free flame retardants and intumescent systems. These products offer superior fire resistance (e.g., reduced flame spread and heat release), smoke suppression, and lower toxicity emissions during combustion, crucial for meeting stringent industry standards like UL 94 and NFPA 275. Unique selling propositions include materials that maintain excellent mechanical properties while achieving higher FST ratings, enabling their use in critical applications like aircraft interiors, railway components, and energy infrastructure. Technological advancements are focused on developing bio-based FST retardant resins and improving processing characteristics for large-scale manufacturing.
Key Drivers, Barriers & Challenges in Fire, Smoke, and Toxicity Retardant Composite Resin
Key Drivers:
- Stringent Safety Regulations: Ever-increasing fire safety standards across industries like aerospace, automotive, construction, and electronics are the primary market propellant.
- Demand for Lightweight and High-Performance Materials: Composites offer a superior strength-to-weight ratio, and incorporating FST properties enhances their appeal in weight-sensitive applications.
- Growth in End-Use Industries: Expansion in sectors like renewable energy (wind turbines), electric vehicles, and advanced infrastructure projects fuels demand for specialized composite resins.
- Technological Advancements: Development of novel flame retardant additives and improved resin formulations continually expands application possibilities.
Barriers & Challenges:
- High Cost of FST Additives: Specialized retardant additives can significantly increase the overall cost of composite resins.
- Processing Complexity: Achieving uniform dispersion of FST additives and maintaining material integrity during composite manufacturing can be challenging.
- Regulatory Hurdles and Certification: Obtaining certifications for FST compliance can be a lengthy and costly process, especially for new formulations.
- Competition from Conventional Materials: In some less regulated applications, traditional materials may still offer a cost advantage.
- Supply Chain Volatility: Disruptions in the supply of key raw materials for FST additives can impact production and pricing. The global supply chain for specialized chemicals faces disruptions, potentially increasing raw material costs by 5-10%.
Emerging Opportunities in Fire, Smoke, and Toxicity Retardant Composite Resin
Emerging opportunities in the Fire, Smoke, and Toxicity Retardant Composite Resin market lie in the development of sustainable and bio-based FST retardant materials, catering to the growing demand for eco-friendly solutions. The increasing focus on circular economy principles will drive innovation in recyclable or biodegradable FST composite resins. Untapped markets include high-speed rail infrastructure, advanced medical devices requiring stringent fire safety, and specialized industrial equipment. Evolving consumer preferences for safer living and working environments will also spur demand for FST-compliant building materials and interior components.
Growth Accelerators in the Fire, Smoke, and Toxicity Retardant Composite Resin Industry
The long-term growth of the Fire, Smoke, and Toxicity Retardant Composite Resin industry is being accelerated by significant technological breakthroughs in flame retardant chemistry, leading to more efficient and less toxic solutions. Strategic partnerships between resin manufacturers and additive suppliers are fostering co-development of innovative products tailored to specific industry needs. Furthermore, market expansion strategies, including penetration into emerging economies with developing safety regulations and increasing industrialization, are crucial growth catalysts. The continuous development of advanced manufacturing techniques like additive manufacturing (3D printing) for FST composite materials presents a substantial growth avenue.
Key Players Shaping the Fire, Smoke, and Toxicity Retardant Composite Resin Market
- AOC
- Ashland
- BASF
- BUFA
- Hexion
- Huntsman
- Mader
- Polynt
- Reichhold
- SABIC
- Scott Bader
Notable Milestones in Fire, Smoke, and Toxicity Retardant Composite Resin Sector
- 2019: Introduction of novel halogen-free flame retardant systems for epoxy resins, significantly improving FST performance.
- 2020: Increased regulatory scrutiny on smoke toxicity in the automotive industry, driving demand for low-smoke resins.
- 2021: Launch of bio-based FST retardant composite resins targeting sustainable construction applications.
- 2022: Significant R&D investment by major players in nanotechnology-enhanced FST additives for superior performance at lower loadings.
- 2023: Merger of two key players in the composite resin market, consolidating market share and R&D capabilities.
- 2024 (Q1): Development of advanced intumescent systems offering enhanced char formation and insulation properties.
In-Depth Fire, Smoke, and Toxicity Retardant Composite Resin Market Outlook
The outlook for the Fire, Smoke, and Toxicity Retardant Composite Resin market is exceptionally strong, driven by a confluence of accelerating factors. Continued technological advancements in flame retardant chemistry and novel resin formulations will unlock new performance benchmarks and application possibilities. Strategic collaborations and partnerships are expected to foster innovation and market penetration. The expansion into emerging markets, coupled with the increasing adoption of FST-compliant materials in traditionally less regulated sectors, presents significant growth potential. Furthermore, the drive towards sustainability and the development of eco-friendly FST composite solutions will be a key differentiator and growth accelerator in the coming years. The market is projected to witness sustained expansion, offering lucrative opportunities for stakeholders adept at navigating regulatory landscapes and embracing innovation.
Fire, Smoke, and Toxicity Retardant Composite Resin Segmentation
-
1. Application
- 1.1. Lay-Up
- 1.2. Filament Winding
- 1.3. Injection Molding
- 1.4. Pultrusion
- 1.5. Compression Molding
-
2. Types
- 2.1. Phenolic
- 2.2. Polyester
- 2.3. Epoxy
- 2.4. Thermoplastic
- 2.5. Vinylester
Fire, Smoke, and Toxicity Retardant Composite Resin Segmentation By Geography
-
1. North America
- 1.1. United States
- 1.2. Canada
- 1.3. Mexico
-
2. South America
- 2.1. Brazil
- 2.2. Argentina
- 2.3. Rest of South America
-
3. Europe
- 3.1. United Kingdom
- 3.2. Germany
- 3.3. France
- 3.4. Italy
- 3.5. Spain
- 3.6. Russia
- 3.7. Benelux
- 3.8. Nordics
- 3.9. Rest of Europe
-
4. Middle East & Africa
- 4.1. Turkey
- 4.2. Israel
- 4.3. GCC
- 4.4. North Africa
- 4.5. South Africa
- 4.6. Rest of Middle East & Africa
-
5. Asia Pacific
- 5.1. China
- 5.2. India
- 5.3. Japan
- 5.4. South Korea
- 5.5. ASEAN
- 5.6. Oceania
- 5.7. Rest of Asia Pacific
Fire, Smoke, and Toxicity Retardant Composite Resin REPORT HIGHLIGHTS
| Aspects | Details |
|---|---|
| Study Period | 2019-2033 |
| Base Year | 2024 |
| Estimated Year | 2025 |
| Forecast Period | 2025-2033 |
| Historical Period | 2019-2024 |
| Growth Rate | CAGR of XX% from 2019-2033 |
| Segmentation |
|
Table of Contents
- 1. Introduction
- 1.1. Research Scope
- 1.2. Market Segmentation
- 1.3. Research Methodology
- 1.4. Definitions and Assumptions
- 2. Executive Summary
- 2.1. Introduction
- 3. Market Dynamics
- 3.1. Introduction
- 3.2. Market Drivers
- 3.3. Market Restrains
- 3.4. Market Trends
- 4. Market Factor Analysis
- 4.1. Porters Five Forces
- 4.2. Supply/Value Chain
- 4.3. PESTEL analysis
- 4.4. Market Entropy
- 4.5. Patent/Trademark Analysis
- 5. Global Fire, Smoke, and Toxicity Retardant Composite Resin Analysis, Insights and Forecast, 2019-2031
- 5.1. Market Analysis, Insights and Forecast - by Application
- 5.1.1. Lay-Up
- 5.1.2. Filament Winding
- 5.1.3. Injection Molding
- 5.1.4. Pultrusion
- 5.1.5. Compression Molding
- 5.2. Market Analysis, Insights and Forecast - by Types
- 5.2.1. Phenolic
- 5.2.2. Polyester
- 5.2.3. Epoxy
- 5.2.4. Thermoplastic
- 5.2.5. Vinylester
- 5.3. Market Analysis, Insights and Forecast - by Region
- 5.3.1. North America
- 5.3.2. South America
- 5.3.3. Europe
- 5.3.4. Middle East & Africa
- 5.3.5. Asia Pacific
- 5.1. Market Analysis, Insights and Forecast - by Application
- 6. North America Fire, Smoke, and Toxicity Retardant Composite Resin Analysis, Insights and Forecast, 2019-2031
- 6.1. Market Analysis, Insights and Forecast - by Application
- 6.1.1. Lay-Up
- 6.1.2. Filament Winding
- 6.1.3. Injection Molding
- 6.1.4. Pultrusion
- 6.1.5. Compression Molding
- 6.2. Market Analysis, Insights and Forecast - by Types
- 6.2.1. Phenolic
- 6.2.2. Polyester
- 6.2.3. Epoxy
- 6.2.4. Thermoplastic
- 6.2.5. Vinylester
- 6.1. Market Analysis, Insights and Forecast - by Application
- 7. South America Fire, Smoke, and Toxicity Retardant Composite Resin Analysis, Insights and Forecast, 2019-2031
- 7.1. Market Analysis, Insights and Forecast - by Application
- 7.1.1. Lay-Up
- 7.1.2. Filament Winding
- 7.1.3. Injection Molding
- 7.1.4. Pultrusion
- 7.1.5. Compression Molding
- 7.2. Market Analysis, Insights and Forecast - by Types
- 7.2.1. Phenolic
- 7.2.2. Polyester
- 7.2.3. Epoxy
- 7.2.4. Thermoplastic
- 7.2.5. Vinylester
- 7.1. Market Analysis, Insights and Forecast - by Application
- 8. Europe Fire, Smoke, and Toxicity Retardant Composite Resin Analysis, Insights and Forecast, 2019-2031
- 8.1. Market Analysis, Insights and Forecast - by Application
- 8.1.1. Lay-Up
- 8.1.2. Filament Winding
- 8.1.3. Injection Molding
- 8.1.4. Pultrusion
- 8.1.5. Compression Molding
- 8.2. Market Analysis, Insights and Forecast - by Types
- 8.2.1. Phenolic
- 8.2.2. Polyester
- 8.2.3. Epoxy
- 8.2.4. Thermoplastic
- 8.2.5. Vinylester
- 8.1. Market Analysis, Insights and Forecast - by Application
- 9. Middle East & Africa Fire, Smoke, and Toxicity Retardant Composite Resin Analysis, Insights and Forecast, 2019-2031
- 9.1. Market Analysis, Insights and Forecast - by Application
- 9.1.1. Lay-Up
- 9.1.2. Filament Winding
- 9.1.3. Injection Molding
- 9.1.4. Pultrusion
- 9.1.5. Compression Molding
- 9.2. Market Analysis, Insights and Forecast - by Types
- 9.2.1. Phenolic
- 9.2.2. Polyester
- 9.2.3. Epoxy
- 9.2.4. Thermoplastic
- 9.2.5. Vinylester
- 9.1. Market Analysis, Insights and Forecast - by Application
- 10. Asia Pacific Fire, Smoke, and Toxicity Retardant Composite Resin Analysis, Insights and Forecast, 2019-2031
- 10.1. Market Analysis, Insights and Forecast - by Application
- 10.1.1. Lay-Up
- 10.1.2. Filament Winding
- 10.1.3. Injection Molding
- 10.1.4. Pultrusion
- 10.1.5. Compression Molding
- 10.2. Market Analysis, Insights and Forecast - by Types
- 10.2.1. Phenolic
- 10.2.2. Polyester
- 10.2.3. Epoxy
- 10.2.4. Thermoplastic
- 10.2.5. Vinylester
- 10.1. Market Analysis, Insights and Forecast - by Application
- 11. Competitive Analysis
- 11.1. Global Market Share Analysis 2024
- 11.2. Company Profiles
- 11.2.1 AOC
- 11.2.1.1. Overview
- 11.2.1.2. Products
- 11.2.1.3. SWOT Analysis
- 11.2.1.4. Recent Developments
- 11.2.1.5. Financials (Based on Availability)
- 11.2.2 Ashland
- 11.2.2.1. Overview
- 11.2.2.2. Products
- 11.2.2.3. SWOT Analysis
- 11.2.2.4. Recent Developments
- 11.2.2.5. Financials (Based on Availability)
- 11.2.3 BASF
- 11.2.3.1. Overview
- 11.2.3.2. Products
- 11.2.3.3. SWOT Analysis
- 11.2.3.4. Recent Developments
- 11.2.3.5. Financials (Based on Availability)
- 11.2.4 BUFA
- 11.2.4.1. Overview
- 11.2.4.2. Products
- 11.2.4.3. SWOT Analysis
- 11.2.4.4. Recent Developments
- 11.2.4.5. Financials (Based on Availability)
- 11.2.5 Hexion
- 11.2.5.1. Overview
- 11.2.5.2. Products
- 11.2.5.3. SWOT Analysis
- 11.2.5.4. Recent Developments
- 11.2.5.5. Financials (Based on Availability)
- 11.2.6 Huntsman
- 11.2.6.1. Overview
- 11.2.6.2. Products
- 11.2.6.3. SWOT Analysis
- 11.2.6.4. Recent Developments
- 11.2.6.5. Financials (Based on Availability)
- 11.2.7 Mader
- 11.2.7.1. Overview
- 11.2.7.2. Products
- 11.2.7.3. SWOT Analysis
- 11.2.7.4. Recent Developments
- 11.2.7.5. Financials (Based on Availability)
- 11.2.8 Polynt
- 11.2.8.1. Overview
- 11.2.8.2. Products
- 11.2.8.3. SWOT Analysis
- 11.2.8.4. Recent Developments
- 11.2.8.5. Financials (Based on Availability)
- 11.2.9 Reichhold
- 11.2.9.1. Overview
- 11.2.9.2. Products
- 11.2.9.3. SWOT Analysis
- 11.2.9.4. Recent Developments
- 11.2.9.5. Financials (Based on Availability)
- 11.2.10 SABIC
- 11.2.10.1. Overview
- 11.2.10.2. Products
- 11.2.10.3. SWOT Analysis
- 11.2.10.4. Recent Developments
- 11.2.10.5. Financials (Based on Availability)
- 11.2.11 Scott Bader
- 11.2.11.1. Overview
- 11.2.11.2. Products
- 11.2.11.3. SWOT Analysis
- 11.2.11.4. Recent Developments
- 11.2.11.5. Financials (Based on Availability)
- 11.2.1 AOC
List of Figures
- Figure 1: Global Fire, Smoke, and Toxicity Retardant Composite Resin Revenue Breakdown (million, %) by Region 2024 & 2032
- Figure 2: North America Fire, Smoke, and Toxicity Retardant Composite Resin Revenue (million), by Application 2024 & 2032
- Figure 3: North America Fire, Smoke, and Toxicity Retardant Composite Resin Revenue Share (%), by Application 2024 & 2032
- Figure 4: North America Fire, Smoke, and Toxicity Retardant Composite Resin Revenue (million), by Types 2024 & 2032
- Figure 5: North America Fire, Smoke, and Toxicity Retardant Composite Resin Revenue Share (%), by Types 2024 & 2032
- Figure 6: North America Fire, Smoke, and Toxicity Retardant Composite Resin Revenue (million), by Country 2024 & 2032
- Figure 7: North America Fire, Smoke, and Toxicity Retardant Composite Resin Revenue Share (%), by Country 2024 & 2032
- Figure 8: South America Fire, Smoke, and Toxicity Retardant Composite Resin Revenue (million), by Application 2024 & 2032
- Figure 9: South America Fire, Smoke, and Toxicity Retardant Composite Resin Revenue Share (%), by Application 2024 & 2032
- Figure 10: South America Fire, Smoke, and Toxicity Retardant Composite Resin Revenue (million), by Types 2024 & 2032
- Figure 11: South America Fire, Smoke, and Toxicity Retardant Composite Resin Revenue Share (%), by Types 2024 & 2032
- Figure 12: South America Fire, Smoke, and Toxicity Retardant Composite Resin Revenue (million), by Country 2024 & 2032
- Figure 13: South America Fire, Smoke, and Toxicity Retardant Composite Resin Revenue Share (%), by Country 2024 & 2032
- Figure 14: Europe Fire, Smoke, and Toxicity Retardant Composite Resin Revenue (million), by Application 2024 & 2032
- Figure 15: Europe Fire, Smoke, and Toxicity Retardant Composite Resin Revenue Share (%), by Application 2024 & 2032
- Figure 16: Europe Fire, Smoke, and Toxicity Retardant Composite Resin Revenue (million), by Types 2024 & 2032
- Figure 17: Europe Fire, Smoke, and Toxicity Retardant Composite Resin Revenue Share (%), by Types 2024 & 2032
- Figure 18: Europe Fire, Smoke, and Toxicity Retardant Composite Resin Revenue (million), by Country 2024 & 2032
- Figure 19: Europe Fire, Smoke, and Toxicity Retardant Composite Resin Revenue Share (%), by Country 2024 & 2032
- Figure 20: Middle East & Africa Fire, Smoke, and Toxicity Retardant Composite Resin Revenue (million), by Application 2024 & 2032
- Figure 21: Middle East & Africa Fire, Smoke, and Toxicity Retardant Composite Resin Revenue Share (%), by Application 2024 & 2032
- Figure 22: Middle East & Africa Fire, Smoke, and Toxicity Retardant Composite Resin Revenue (million), by Types 2024 & 2032
- Figure 23: Middle East & Africa Fire, Smoke, and Toxicity Retardant Composite Resin Revenue Share (%), by Types 2024 & 2032
- Figure 24: Middle East & Africa Fire, Smoke, and Toxicity Retardant Composite Resin Revenue (million), by Country 2024 & 2032
- Figure 25: Middle East & Africa Fire, Smoke, and Toxicity Retardant Composite Resin Revenue Share (%), by Country 2024 & 2032
- Figure 26: Asia Pacific Fire, Smoke, and Toxicity Retardant Composite Resin Revenue (million), by Application 2024 & 2032
- Figure 27: Asia Pacific Fire, Smoke, and Toxicity Retardant Composite Resin Revenue Share (%), by Application 2024 & 2032
- Figure 28: Asia Pacific Fire, Smoke, and Toxicity Retardant Composite Resin Revenue (million), by Types 2024 & 2032
- Figure 29: Asia Pacific Fire, Smoke, and Toxicity Retardant Composite Resin Revenue Share (%), by Types 2024 & 2032
- Figure 30: Asia Pacific Fire, Smoke, and Toxicity Retardant Composite Resin Revenue (million), by Country 2024 & 2032
- Figure 31: Asia Pacific Fire, Smoke, and Toxicity Retardant Composite Resin Revenue Share (%), by Country 2024 & 2032
List of Tables
- Table 1: Global Fire, Smoke, and Toxicity Retardant Composite Resin Revenue million Forecast, by Region 2019 & 2032
- Table 2: Global Fire, Smoke, and Toxicity Retardant Composite Resin Revenue million Forecast, by Application 2019 & 2032
- Table 3: Global Fire, Smoke, and Toxicity Retardant Composite Resin Revenue million Forecast, by Types 2019 & 2032
- Table 4: Global Fire, Smoke, and Toxicity Retardant Composite Resin Revenue million Forecast, by Region 2019 & 2032
- Table 5: Global Fire, Smoke, and Toxicity Retardant Composite Resin Revenue million Forecast, by Application 2019 & 2032
- Table 6: Global Fire, Smoke, and Toxicity Retardant Composite Resin Revenue million Forecast, by Types 2019 & 2032
- Table 7: Global Fire, Smoke, and Toxicity Retardant Composite Resin Revenue million Forecast, by Country 2019 & 2032
- Table 8: United States Fire, Smoke, and Toxicity Retardant Composite Resin Revenue (million) Forecast, by Application 2019 & 2032
- Table 9: Canada Fire, Smoke, and Toxicity Retardant Composite Resin Revenue (million) Forecast, by Application 2019 & 2032
- Table 10: Mexico Fire, Smoke, and Toxicity Retardant Composite Resin Revenue (million) Forecast, by Application 2019 & 2032
- Table 11: Global Fire, Smoke, and Toxicity Retardant Composite Resin Revenue million Forecast, by Application 2019 & 2032
- Table 12: Global Fire, Smoke, and Toxicity Retardant Composite Resin Revenue million Forecast, by Types 2019 & 2032
- Table 13: Global Fire, Smoke, and Toxicity Retardant Composite Resin Revenue million Forecast, by Country 2019 & 2032
- Table 14: Brazil Fire, Smoke, and Toxicity Retardant Composite Resin Revenue (million) Forecast, by Application 2019 & 2032
- Table 15: Argentina Fire, Smoke, and Toxicity Retardant Composite Resin Revenue (million) Forecast, by Application 2019 & 2032
- Table 16: Rest of South America Fire, Smoke, and Toxicity Retardant Composite Resin Revenue (million) Forecast, by Application 2019 & 2032
- Table 17: Global Fire, Smoke, and Toxicity Retardant Composite Resin Revenue million Forecast, by Application 2019 & 2032
- Table 18: Global Fire, Smoke, and Toxicity Retardant Composite Resin Revenue million Forecast, by Types 2019 & 2032
- Table 19: Global Fire, Smoke, and Toxicity Retardant Composite Resin Revenue million Forecast, by Country 2019 & 2032
- Table 20: United Kingdom Fire, Smoke, and Toxicity Retardant Composite Resin Revenue (million) Forecast, by Application 2019 & 2032
- Table 21: Germany Fire, Smoke, and Toxicity Retardant Composite Resin Revenue (million) Forecast, by Application 2019 & 2032
- Table 22: France Fire, Smoke, and Toxicity Retardant Composite Resin Revenue (million) Forecast, by Application 2019 & 2032
- Table 23: Italy Fire, Smoke, and Toxicity Retardant Composite Resin Revenue (million) Forecast, by Application 2019 & 2032
- Table 24: Spain Fire, Smoke, and Toxicity Retardant Composite Resin Revenue (million) Forecast, by Application 2019 & 2032
- Table 25: Russia Fire, Smoke, and Toxicity Retardant Composite Resin Revenue (million) Forecast, by Application 2019 & 2032
- Table 26: Benelux Fire, Smoke, and Toxicity Retardant Composite Resin Revenue (million) Forecast, by Application 2019 & 2032
- Table 27: Nordics Fire, Smoke, and Toxicity Retardant Composite Resin Revenue (million) Forecast, by Application 2019 & 2032
- Table 28: Rest of Europe Fire, Smoke, and Toxicity Retardant Composite Resin Revenue (million) Forecast, by Application 2019 & 2032
- Table 29: Global Fire, Smoke, and Toxicity Retardant Composite Resin Revenue million Forecast, by Application 2019 & 2032
- Table 30: Global Fire, Smoke, and Toxicity Retardant Composite Resin Revenue million Forecast, by Types 2019 & 2032
- Table 31: Global Fire, Smoke, and Toxicity Retardant Composite Resin Revenue million Forecast, by Country 2019 & 2032
- Table 32: Turkey Fire, Smoke, and Toxicity Retardant Composite Resin Revenue (million) Forecast, by Application 2019 & 2032
- Table 33: Israel Fire, Smoke, and Toxicity Retardant Composite Resin Revenue (million) Forecast, by Application 2019 & 2032
- Table 34: GCC Fire, Smoke, and Toxicity Retardant Composite Resin Revenue (million) Forecast, by Application 2019 & 2032
- Table 35: North Africa Fire, Smoke, and Toxicity Retardant Composite Resin Revenue (million) Forecast, by Application 2019 & 2032
- Table 36: South Africa Fire, Smoke, and Toxicity Retardant Composite Resin Revenue (million) Forecast, by Application 2019 & 2032
- Table 37: Rest of Middle East & Africa Fire, Smoke, and Toxicity Retardant Composite Resin Revenue (million) Forecast, by Application 2019 & 2032
- Table 38: Global Fire, Smoke, and Toxicity Retardant Composite Resin Revenue million Forecast, by Application 2019 & 2032
- Table 39: Global Fire, Smoke, and Toxicity Retardant Composite Resin Revenue million Forecast, by Types 2019 & 2032
- Table 40: Global Fire, Smoke, and Toxicity Retardant Composite Resin Revenue million Forecast, by Country 2019 & 2032
- Table 41: China Fire, Smoke, and Toxicity Retardant Composite Resin Revenue (million) Forecast, by Application 2019 & 2032
- Table 42: India Fire, Smoke, and Toxicity Retardant Composite Resin Revenue (million) Forecast, by Application 2019 & 2032
- Table 43: Japan Fire, Smoke, and Toxicity Retardant Composite Resin Revenue (million) Forecast, by Application 2019 & 2032
- Table 44: South Korea Fire, Smoke, and Toxicity Retardant Composite Resin Revenue (million) Forecast, by Application 2019 & 2032
- Table 45: ASEAN Fire, Smoke, and Toxicity Retardant Composite Resin Revenue (million) Forecast, by Application 2019 & 2032
- Table 46: Oceania Fire, Smoke, and Toxicity Retardant Composite Resin Revenue (million) Forecast, by Application 2019 & 2032
- Table 47: Rest of Asia Pacific Fire, Smoke, and Toxicity Retardant Composite Resin Revenue (million) Forecast, by Application 2019 & 2032
Frequently Asked Questions
1. What is the projected Compound Annual Growth Rate (CAGR) of the Fire, Smoke, and Toxicity Retardant Composite Resin?
The projected CAGR is approximately XX%.
2. Which companies are prominent players in the Fire, Smoke, and Toxicity Retardant Composite Resin?
Key companies in the market include AOC, Ashland, BASF, BUFA, Hexion, Huntsman, Mader, Polynt, Reichhold, SABIC, Scott Bader.
3. What are the main segments of the Fire, Smoke, and Toxicity Retardant Composite Resin?
The market segments include Application, Types.
4. Can you provide details about the market size?
The market size is estimated to be USD XXX million as of 2022.
5. What are some drivers contributing to market growth?
N/A
6. What are the notable trends driving market growth?
N/A
7. Are there any restraints impacting market growth?
N/A
8. Can you provide examples of recent developments in the market?
N/A
9. What pricing options are available for accessing the report?
Pricing options include single-user, multi-user, and enterprise licenses priced at USD 4900.00, USD 7350.00, and USD 9800.00 respectively.
10. Is the market size provided in terms of value or volume?
The market size is provided in terms of value, measured in million.
11. Are there any specific market keywords associated with the report?
Yes, the market keyword associated with the report is "Fire, Smoke, and Toxicity Retardant Composite Resin," which aids in identifying and referencing the specific market segment covered.
12. How do I determine which pricing option suits my needs best?
The pricing options vary based on user requirements and access needs. Individual users may opt for single-user licenses, while businesses requiring broader access may choose multi-user or enterprise licenses for cost-effective access to the report.
13. Are there any additional resources or data provided in the Fire, Smoke, and Toxicity Retardant Composite Resin report?
While the report offers comprehensive insights, it's advisable to review the specific contents or supplementary materials provided to ascertain if additional resources or data are available.
14. How can I stay updated on further developments or reports in the Fire, Smoke, and Toxicity Retardant Composite Resin?
To stay informed about further developments, trends, and reports in the Fire, Smoke, and Toxicity Retardant Composite Resin, consider subscribing to industry newsletters, following relevant companies and organizations, or regularly checking reputable industry news sources and publications.
Methodology
Step 1 - Identification of Relevant Samples Size from Population Database


Step 2 - Approaches for Defining Global Market Size (Value, Volume* & Price*)

Note*: In applicable scenarios
Step 3 - Data Sources
Primary Research
- Web Analytics
- Survey Reports
- Research Institute
- Latest Research Reports
- Opinion Leaders
Secondary Research
- Annual Reports
- White Paper
- Latest Press Release
- Industry Association
- Paid Database
- Investor Presentations

Step 4 - Data Triangulation
Involves using different sources of information in order to increase the validity of a study
These sources are likely to be stakeholders in a program - participants, other researchers, program staff, other community members, and so on.
Then we put all data in single framework & apply various statistical tools to find out the dynamic on the market.
During the analysis stage, feedback from the stakeholder groups would be compared to determine areas of agreement as well as areas of divergence


