
Key Insights
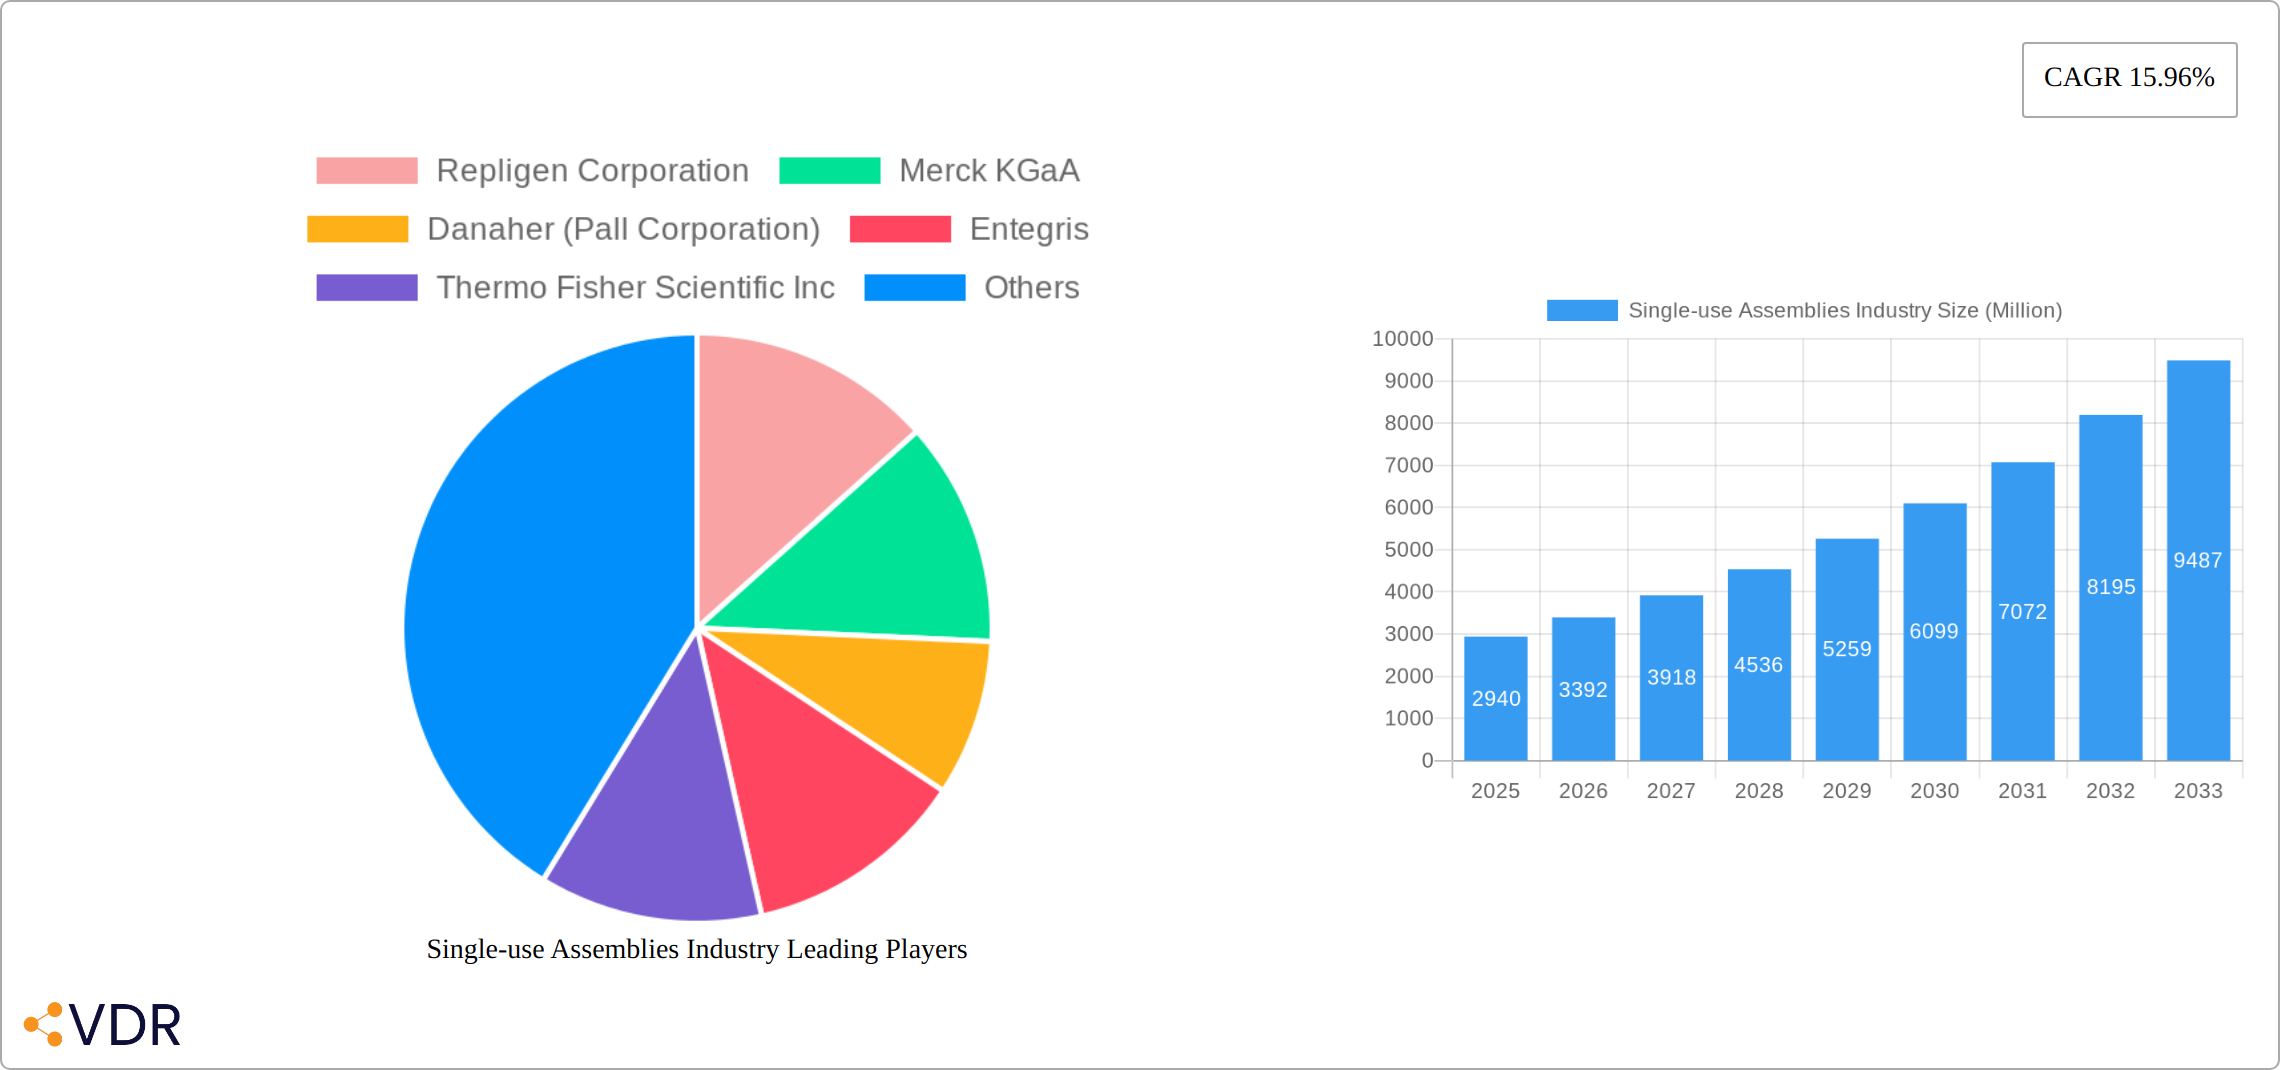
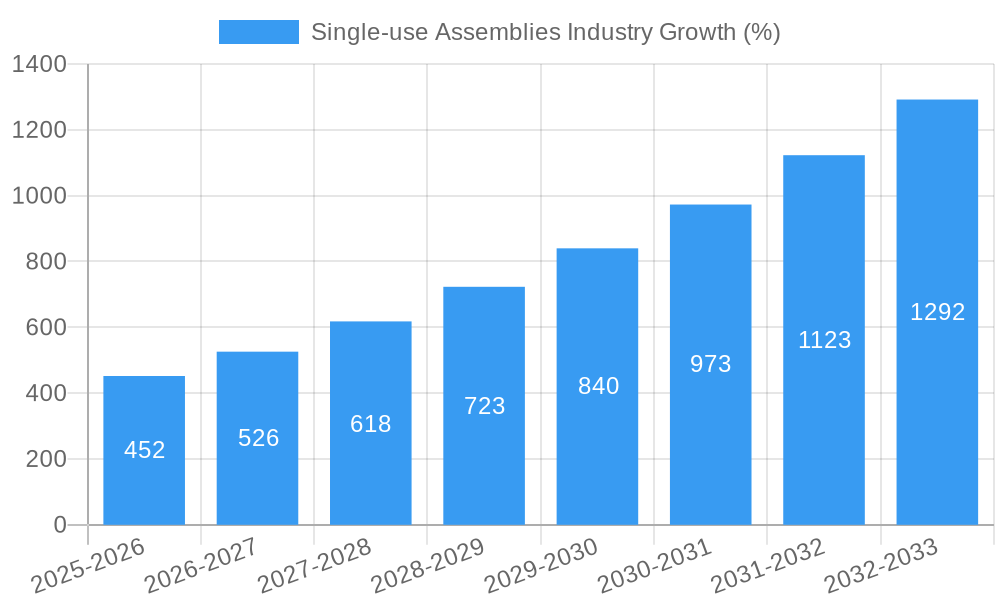
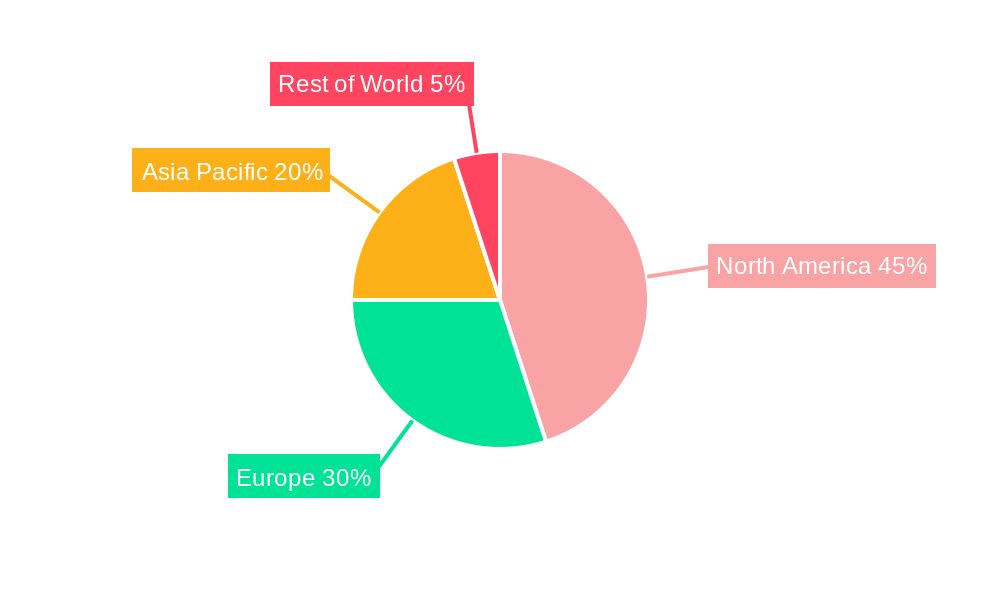
The single-use assemblies market is experiencing robust growth, projected to reach a value of $2.94 billion in 2025 and exhibiting a Compound Annual Growth Rate (CAGR) of 15.96% from 2025 to 2033. This expansion is fueled by several key drivers. The increasing adoption of single-use technologies in biopharmaceutical and pharmaceutical manufacturing is paramount, driven by the need for enhanced sterility, reduced cleaning validation costs, and faster production times. The rise of biologics and cell-based therapies further fuels demand, as these applications inherently benefit from the reduced risk of cross-contamination offered by single-use systems. Furthermore, advancements in material science are leading to the development of more durable and efficient single-use assemblies, catering to the growing complexity of modern drug production processes. The market is segmented by product type (filtration, bag, bottle, mixing system assemblies), application (cell culture, filtration, storage, sampling, fill-finish), and end-user (biopharmaceutical companies, contract manufacturers, research institutions). North America currently holds a significant market share due to the high concentration of biopharmaceutical companies and advanced research facilities, but the Asia-Pacific region is poised for significant growth driven by increasing investment in manufacturing infrastructure and a growing demand for biopharmaceuticals.
The competitive landscape is characterized by a mix of established industry giants and specialized players. Companies like Repligen, Merck KGaA, Danaher (Pall Corporation), and Sartorius AG are major players, offering comprehensive portfolios of single-use assemblies. However, smaller, specialized companies are also emerging, focusing on niche applications and innovative technologies. The future of the market hinges on continued innovation in materials, design, and automation. The integration of advanced technologies like automation and process analytics will further streamline manufacturing processes, leading to increased efficiency and productivity. Regulatory changes and industry standards also play a significant role, influencing the adoption of new technologies and materials. The continued focus on reducing manufacturing costs and improving the scalability of single-use systems will further contribute to the growth trajectory of this dynamic market segment.
Single-Use Assemblies Industry Market Report: 2019-2033
This comprehensive report provides an in-depth analysis of the Single-Use Assemblies market, encompassing market dynamics, growth trends, regional dominance, product landscape, key challenges, emerging opportunities, and key players. The study period covers 2019-2033, with 2025 as the base year and a forecast period of 2025-2033. The report utilizes extensive data analysis to provide actionable insights for industry professionals, investors, and stakeholders. The market is segmented by product type (Filtration Assemblies, Bag Assemblies, Bottle Assemblies, Mixing System Assemblies), application (Cell Culture and Mixing, Filtration, Storage, Sampling, Fill-finish Application, Other Applications), and end-user (Biopharmaceutical and Pharmaceutical Companies, Contract Research and Contract Manufacturing Organizations, Academic and Research Institutes). The report projects a market size of xx Million units by 2033.
Single-use Assemblies Industry Market Dynamics & Structure
The single-use assemblies market exhibits a moderately concentrated structure, with leading players commanding a significant market share. This dynamic landscape is propelled by continuous technological innovation, fueled by the biopharmaceutical industry's relentless pursuit of enhanced efficiency, reduced contamination risks, and improved process yields in biomanufacturing. Stringent regulatory oversight, particularly within the pharmaceutical and biopharmaceutical sectors, significantly influences product development, manufacturing processes, and market access. While competition from reusable systems exists, the inherent advantages of single-use systems—including superior sterility, flexibility, and reduced cross-contamination—continue to drive robust market expansion. The primary end-users are large biopharmaceutical and pharmaceutical companies, complemented by a growing segment of contract research and manufacturing organizations (CROs/CDMOs) and academic research institutes. The market also witnesses significant mergers and acquisitions (M&A) activity, reflecting ongoing consolidation and strategic expansion efforts among key players.
- Market Concentration: Moderately concentrated, with top 5 players holding approximately [Insert Percentage]% market share in 2024.
- Technological Innovation: Focus areas include automation, advanced material science for improved biocompatibility and durability, and enhanced sterility assurance technologies such as gamma irradiation and e-beam sterilization.
- Regulatory Landscape: Stringent regulatory compliance (e.g., FDA, EMA) drives demand for high-quality, meticulously documented, and validated products. This necessitates robust quality control and assurance systems throughout the manufacturing process.
- Competitive Substitutes: Reusable systems present competition, however, the advantages of single-use systems in terms of reduced contamination risk, enhanced flexibility for varied production runs, and minimized cleaning validation efforts often outweigh the initial cost differences.
- M&A Activity: [Insert Number] major mergers and acquisitions were recorded between 2019 and 2024, indicative of industry consolidation and a race for technological leadership and market share.
Single-use Assemblies Industry Growth Trends & Insights
The single-use assemblies market experienced significant growth during the historical period (2019-2024), driven by factors such as increasing biopharmaceutical production, adoption of advanced manufacturing technologies, and a rising preference for single-use systems to minimize contamination risks. The market is projected to maintain a robust Compound Annual Growth Rate (CAGR) of xx% during the forecast period (2025-2033), reaching an estimated xx Million units by 2033. This growth is propelled by technological advancements in single-use technologies, such as the development of novel materials and improved designs, leading to increased efficiency, cost savings, and enhanced process flexibility. The increasing demand for personalized medicine and cell therapy is also contributing to market expansion. Consumer behavior is shifting towards single-use solutions due to their ease of use, reduced cleaning validation needs, and lower risk of cross-contamination. Market penetration of single-use assemblies is expected to reach approximately xx% by 2033.
Dominant Regions, Countries, or Segments in Single-use Assemblies Industry
North America and Europe currently hold the dominant positions in the single-use assemblies market, driven by a high concentration of biopharmaceutical companies, extensive research infrastructure, and supportive regulatory environments. However, the Asia-Pacific region is experiencing the most rapid growth, fueled by substantial investments in biopharmaceutical manufacturing capacity, the burgeoning adoption of advanced therapies (e.g., cell and gene therapies), and government initiatives promoting domestic biomanufacturing capabilities.
By Product Type: Filtration assemblies maintain the largest market share due to their critical role in various bioprocessing steps, including clarification, purification, and sterilization.
By Application: Cell culture and mixing applications remain dominant, reflecting the central importance of these processes in biopharmaceutical manufacturing, followed by filtration and fill-finish applications.
By End-User: Biopharmaceutical and pharmaceutical companies constitute the largest end-user segment, followed by CROs/CDMOs, which are experiencing significant growth due to increased outsourcing of biomanufacturing activities.
- Key Drivers:
- Strong biopharmaceutical industry presence and established supply chains in North America and Europe.
- Rapidly growing investment in state-of-the-art biomanufacturing facilities in Asia-Pacific, particularly in China and India.
- Government initiatives and incentives (tax breaks, grants) promoting domestic biopharmaceutical development and advanced therapy manufacturing.
- The exponential rise in the adoption of advanced therapies, such as cell and gene therapies, which are highly reliant on single-use assemblies.
- Dominance Factors:
- High concentration of biopharmaceutical companies and CROs/CDMOs, creating substantial demand.
- Advanced research infrastructure, skilled workforce, and supportive regulatory frameworks that facilitate innovation and expedite product development.
- Strong government support for biopharmaceutical research and development, including funding for infrastructure development and regulatory streamlining.
Single-use Assemblies Industry Product Landscape
The single-use assemblies market showcases continuous innovation, focusing on improved material compatibility, enhanced sterility assurance, and increased process efficiency. Recent advancements include the introduction of advanced polymers with enhanced durability and biocompatibility, along with integrated sensor technologies for real-time process monitoring. The development of customized assemblies tailored to specific applications, such as Fill4Sure, launched by SaniSure, demonstrates the ongoing trend towards flexible and adaptable solutions for drug manufacturing. These innovations are driven by the industry's relentless pursuit of high yields, reduced process variability, and enhanced product quality.
Key Drivers, Barriers & Challenges in Single-use Assemblies Industry
Key Drivers:
- The continuous and significant increase in global demand for biopharmaceuticals and biologics to address unmet medical needs.
- The accelerating adoption of continuous manufacturing processes, which are highly compatible with single-use systems and offer significant efficiency advantages.
- Stringent regulatory requirements, promoting a shift towards single-use systems to mitigate contamination risks and improve process consistency.
- The growing demand for personalized medicine and cell therapies, which require highly specialized and adaptable single-use assemblies.
Key Challenges:
- Addressing cost-effectiveness concerns compared to reusable systems through innovations in material science and manufacturing processes.
- Ensuring consistent quality and performance of single-use components through rigorous quality control measures and robust supply chain management.
- Developing sustainable waste management strategies and eco-friendly materials to mitigate environmental impacts associated with single-use disposables.
- Managing supply chain complexities and ensuring timely availability of raw materials and components.
Emerging Opportunities in Single-use Assemblies Industry
The single-use assemblies market presents considerable growth potential. The increasing prevalence of personalized medicine and advanced cell therapies creates significant opportunities for specialized assemblies tailored to specific patient needs and treatment protocols. Furthermore, expansion into emerging markets with growing healthcare infrastructure and the development of innovative applications in other industries, such as food processing and point-of-care diagnostics, offer avenues for market diversification and expansion.
Growth Accelerators in the Single-use Assemblies Industry Industry
Technological breakthroughs, such as the development of novel materials and advanced designs, are accelerating market growth. Strategic partnerships and collaborations between single-use assembly manufacturers and biopharmaceutical companies are fostering innovation and expanding market reach. The increasing adoption of automation and digitalization in biomanufacturing further enhances efficiency and facilitates market expansion.
Key Players Shaping the Single-use Assemblies Industry Market
- Repligen Corporation
- Merck KGaA
- Danaher (Pall Corporation)
- Entegris
- Thermo Fisher Scientific Inc
- Sartorius AG
- Parker Hannifin Corp
- Antylia Scientific (Cole-Parmer)
- Avantor Inc
- Saint-Gobain Life Sciences
- Lonza
- Corning Incorporated
Notable Milestones in Single-use Assemblies Industry Sector
- September 2023: Repligen Corporation acquired Metenova AB, strengthening its fluid management portfolio.
- April 2024: SaniSure launched Fill4Sure, a custom single-use filling assembly designed to expedite drug delivery.
In-Depth Single-use Assemblies Industry Market Outlook
The single-use assemblies market is poised for continued strong growth, driven by ongoing technological advancements, increasing demand for biopharmaceuticals, and the adoption of advanced manufacturing techniques. Strategic partnerships, market expansion into emerging economies, and the development of innovative applications will further fuel this growth, creating lucrative opportunities for industry players. The focus on sustainability and reduced environmental impact will also shape future market trends.
Single-use Assemblies Industry Segmentation
-
1. Product Type
- 1.1. Filtration Assemblies
- 1.2. Bag Assemblies
- 1.3. Bottle Assemblies
- 1.4. Mixing System Assemblies
-
2. Application
- 2.1. Cell Culture and Mixing
- 2.2. Filtration
- 2.3. Storage
- 2.4. Sampling
- 2.5. Fill-finish Application
- 2.6. Other
-
3. End User
- 3.1. Biopharmaceutical and Pharmaceutical Companies
- 3.2. Contract
- 3.3. Academic and Research Institutes
Single-use Assemblies Industry Segmentation By Geography
-
1. North America
- 1.1. United States
- 1.2. Canada
- 1.3. Mexico
-
2. Europe
- 2.1. Germany
- 2.2. United Kingdom
- 2.3. France
- 2.4. Italy
- 2.5. Spain
- 2.6. Rest of Europe
-
3. Asia Pacific
- 3.1. China
- 3.2. Japan
- 3.3. India
- 3.4. Australia
- 3.5. South Korea
- 3.6. Rest of Asia Pacific
-
4. Middle East and Africa
- 4.1. GCC
- 4.2. South Africa
- 4.3. Rest of Middle East and Africa
-
5. South America
- 5.1. Brazil
- 5.2. Argentina
- 5.3. Rest of South America
Single-use Assemblies Industry REPORT HIGHLIGHTS
| Aspects | Details |
|---|---|
| Study Period | 2019-2033 |
| Base Year | 2024 |
| Estimated Year | 2025 |
| Forecast Period | 2025-2033 |
| Historical Period | 2019-2024 |
| Growth Rate | CAGR of 15.96% from 2019-2033 |
| Segmentation |
|
Table of Contents
- 1. Introduction
- 1.1. Research Scope
- 1.2. Market Segmentation
- 1.3. Research Methodology
- 1.4. Definitions and Assumptions
- 2. Executive Summary
- 2.1. Introduction
- 3. Market Dynamics
- 3.1. Introduction
- 3.2. Market Drivers
- 3.2.1. Rapid Implementation and Low Risk of Cross-contamination; Increasing R&D Investment by Biopharmaceutical Companies; Growing Biologics Market
- 3.3. Market Restrains
- 3.3.1. Issues Related to Extractables and Leachables
- 3.4. Market Trends
- 3.4.1. Biopharmaceutical and Pharmaceutical Companies Segment Accounted For Significant Market Share
- 4. Market Factor Analysis
- 4.1. Porters Five Forces
- 4.2. Supply/Value Chain
- 4.3. PESTEL analysis
- 4.4. Market Entropy
- 4.5. Patent/Trademark Analysis
- 5. Global Single-use Assemblies Industry Analysis, Insights and Forecast, 2019-2031
- 5.1. Market Analysis, Insights and Forecast - by Product Type
- 5.1.1. Filtration Assemblies
- 5.1.2. Bag Assemblies
- 5.1.3. Bottle Assemblies
- 5.1.4. Mixing System Assemblies
- 5.2. Market Analysis, Insights and Forecast - by Application
- 5.2.1. Cell Culture and Mixing
- 5.2.2. Filtration
- 5.2.3. Storage
- 5.2.4. Sampling
- 5.2.5. Fill-finish Application
- 5.2.6. Other
- 5.3. Market Analysis, Insights and Forecast - by End User
- 5.3.1. Biopharmaceutical and Pharmaceutical Companies
- 5.3.2. Contract
- 5.3.3. Academic and Research Institutes
- 5.4. Market Analysis, Insights and Forecast - by Region
- 5.4.1. North America
- 5.4.2. Europe
- 5.4.3. Asia Pacific
- 5.4.4. Middle East and Africa
- 5.4.5. South America
- 5.1. Market Analysis, Insights and Forecast - by Product Type
- 6. North America Single-use Assemblies Industry Analysis, Insights and Forecast, 2019-2031
- 6.1. Market Analysis, Insights and Forecast - by Product Type
- 6.1.1. Filtration Assemblies
- 6.1.2. Bag Assemblies
- 6.1.3. Bottle Assemblies
- 6.1.4. Mixing System Assemblies
- 6.2. Market Analysis, Insights and Forecast - by Application
- 6.2.1. Cell Culture and Mixing
- 6.2.2. Filtration
- 6.2.3. Storage
- 6.2.4. Sampling
- 6.2.5. Fill-finish Application
- 6.2.6. Other
- 6.3. Market Analysis, Insights and Forecast - by End User
- 6.3.1. Biopharmaceutical and Pharmaceutical Companies
- 6.3.2. Contract
- 6.3.3. Academic and Research Institutes
- 6.1. Market Analysis, Insights and Forecast - by Product Type
- 7. Europe Single-use Assemblies Industry Analysis, Insights and Forecast, 2019-2031
- 7.1. Market Analysis, Insights and Forecast - by Product Type
- 7.1.1. Filtration Assemblies
- 7.1.2. Bag Assemblies
- 7.1.3. Bottle Assemblies
- 7.1.4. Mixing System Assemblies
- 7.2. Market Analysis, Insights and Forecast - by Application
- 7.2.1. Cell Culture and Mixing
- 7.2.2. Filtration
- 7.2.3. Storage
- 7.2.4. Sampling
- 7.2.5. Fill-finish Application
- 7.2.6. Other
- 7.3. Market Analysis, Insights and Forecast - by End User
- 7.3.1. Biopharmaceutical and Pharmaceutical Companies
- 7.3.2. Contract
- 7.3.3. Academic and Research Institutes
- 7.1. Market Analysis, Insights and Forecast - by Product Type
- 8. Asia Pacific Single-use Assemblies Industry Analysis, Insights and Forecast, 2019-2031
- 8.1. Market Analysis, Insights and Forecast - by Product Type
- 8.1.1. Filtration Assemblies
- 8.1.2. Bag Assemblies
- 8.1.3. Bottle Assemblies
- 8.1.4. Mixing System Assemblies
- 8.2. Market Analysis, Insights and Forecast - by Application
- 8.2.1. Cell Culture and Mixing
- 8.2.2. Filtration
- 8.2.3. Storage
- 8.2.4. Sampling
- 8.2.5. Fill-finish Application
- 8.2.6. Other
- 8.3. Market Analysis, Insights and Forecast - by End User
- 8.3.1. Biopharmaceutical and Pharmaceutical Companies
- 8.3.2. Contract
- 8.3.3. Academic and Research Institutes
- 8.1. Market Analysis, Insights and Forecast - by Product Type
- 9. Middle East and Africa Single-use Assemblies Industry Analysis, Insights and Forecast, 2019-2031
- 9.1. Market Analysis, Insights and Forecast - by Product Type
- 9.1.1. Filtration Assemblies
- 9.1.2. Bag Assemblies
- 9.1.3. Bottle Assemblies
- 9.1.4. Mixing System Assemblies
- 9.2. Market Analysis, Insights and Forecast - by Application
- 9.2.1. Cell Culture and Mixing
- 9.2.2. Filtration
- 9.2.3. Storage
- 9.2.4. Sampling
- 9.2.5. Fill-finish Application
- 9.2.6. Other
- 9.3. Market Analysis, Insights and Forecast - by End User
- 9.3.1. Biopharmaceutical and Pharmaceutical Companies
- 9.3.2. Contract
- 9.3.3. Academic and Research Institutes
- 9.1. Market Analysis, Insights and Forecast - by Product Type
- 10. South America Single-use Assemblies Industry Analysis, Insights and Forecast, 2019-2031
- 10.1. Market Analysis, Insights and Forecast - by Product Type
- 10.1.1. Filtration Assemblies
- 10.1.2. Bag Assemblies
- 10.1.3. Bottle Assemblies
- 10.1.4. Mixing System Assemblies
- 10.2. Market Analysis, Insights and Forecast - by Application
- 10.2.1. Cell Culture and Mixing
- 10.2.2. Filtration
- 10.2.3. Storage
- 10.2.4. Sampling
- 10.2.5. Fill-finish Application
- 10.2.6. Other
- 10.3. Market Analysis, Insights and Forecast - by End User
- 10.3.1. Biopharmaceutical and Pharmaceutical Companies
- 10.3.2. Contract
- 10.3.3. Academic and Research Institutes
- 10.1. Market Analysis, Insights and Forecast - by Product Type
- 11. North America Single-use Assemblies Industry Analysis, Insights and Forecast, 2019-2031
- 11.1. Market Analysis, Insights and Forecast - By Country/Sub-region
- 11.1.1 United States
- 11.1.2 Canada
- 11.1.3 Mexico
- 12. Europe Single-use Assemblies Industry Analysis, Insights and Forecast, 2019-2031
- 12.1. Market Analysis, Insights and Forecast - By Country/Sub-region
- 12.1.1 Germany
- 12.1.2 United Kingdom
- 12.1.3 France
- 12.1.4 Italy
- 12.1.5 Spain
- 12.1.6 Rest of Europe
- 13. Asia Pacific Single-use Assemblies Industry Analysis, Insights and Forecast, 2019-2031
- 13.1. Market Analysis, Insights and Forecast - By Country/Sub-region
- 13.1.1 China
- 13.1.2 Japan
- 13.1.3 India
- 13.1.4 Australia
- 13.1.5 South Korea
- 13.1.6 Rest of Asia Pacific
- 14. Middle East and Africa Single-use Assemblies Industry Analysis, Insights and Forecast, 2019-2031
- 14.1. Market Analysis, Insights and Forecast - By Country/Sub-region
- 14.1.1 GCC
- 14.1.2 South Africa
- 14.1.3 Rest of Middle East and Africa
- 15. South America Single-use Assemblies Industry Analysis, Insights and Forecast, 2019-2031
- 15.1. Market Analysis, Insights and Forecast - By Country/Sub-region
- 15.1.1 Brazil
- 15.1.2 Argentina
- 15.1.3 Rest of South America
- 16. Competitive Analysis
- 16.1. Global Market Share Analysis 2024
- 16.2. Company Profiles
- 16.2.1 Repligen Corporation
- 16.2.1.1. Overview
- 16.2.1.2. Products
- 16.2.1.3. SWOT Analysis
- 16.2.1.4. Recent Developments
- 16.2.1.5. Financials (Based on Availability)
- 16.2.2 Merck KGaA
- 16.2.2.1. Overview
- 16.2.2.2. Products
- 16.2.2.3. SWOT Analysis
- 16.2.2.4. Recent Developments
- 16.2.2.5. Financials (Based on Availability)
- 16.2.3 Danaher (Pall Corporation)
- 16.2.3.1. Overview
- 16.2.3.2. Products
- 16.2.3.3. SWOT Analysis
- 16.2.3.4. Recent Developments
- 16.2.3.5. Financials (Based on Availability)
- 16.2.4 Entegris
- 16.2.4.1. Overview
- 16.2.4.2. Products
- 16.2.4.3. SWOT Analysis
- 16.2.4.4. Recent Developments
- 16.2.4.5. Financials (Based on Availability)
- 16.2.5 Thermo Fisher Scientific Inc
- 16.2.5.1. Overview
- 16.2.5.2. Products
- 16.2.5.3. SWOT Analysis
- 16.2.5.4. Recent Developments
- 16.2.5.5. Financials (Based on Availability)
- 16.2.6 Sartorius AG
- 16.2.6.1. Overview
- 16.2.6.2. Products
- 16.2.6.3. SWOT Analysis
- 16.2.6.4. Recent Developments
- 16.2.6.5. Financials (Based on Availability)
- 16.2.7 PARKER HANNIFIN CORP
- 16.2.7.1. Overview
- 16.2.7.2. Products
- 16.2.7.3. SWOT Analysis
- 16.2.7.4. Recent Developments
- 16.2.7.5. Financials (Based on Availability)
- 16.2.8 Antylia Scientific (Cole-Parmer)
- 16.2.8.1. Overview
- 16.2.8.2. Products
- 16.2.8.3. SWOT Analysis
- 16.2.8.4. Recent Developments
- 16.2.8.5. Financials (Based on Availability)
- 16.2.9 Avantor Inc
- 16.2.9.1. Overview
- 16.2.9.2. Products
- 16.2.9.3. SWOT Analysis
- 16.2.9.4. Recent Developments
- 16.2.9.5. Financials (Based on Availability)
- 16.2.10 Saint-Gobain Life Sciences
- 16.2.10.1. Overview
- 16.2.10.2. Products
- 16.2.10.3. SWOT Analysis
- 16.2.10.4. Recent Developments
- 16.2.10.5. Financials (Based on Availability)
- 16.2.11 Lonza
- 16.2.11.1. Overview
- 16.2.11.2. Products
- 16.2.11.3. SWOT Analysis
- 16.2.11.4. Recent Developments
- 16.2.11.5. Financials (Based on Availability)
- 16.2.12 Corning Incorporated
- 16.2.12.1. Overview
- 16.2.12.2. Products
- 16.2.12.3. SWOT Analysis
- 16.2.12.4. Recent Developments
- 16.2.12.5. Financials (Based on Availability)
- 16.2.1 Repligen Corporation
List of Figures
- Figure 1: Global Single-use Assemblies Industry Revenue Breakdown (Million, %) by Region 2024 & 2032
- Figure 2: Global Single-use Assemblies Industry Volume Breakdown (K Unit, %) by Region 2024 & 2032
- Figure 3: North America Single-use Assemblies Industry Revenue (Million), by Country 2024 & 2032
- Figure 4: North America Single-use Assemblies Industry Volume (K Unit), by Country 2024 & 2032
- Figure 5: North America Single-use Assemblies Industry Revenue Share (%), by Country 2024 & 2032
- Figure 6: North America Single-use Assemblies Industry Volume Share (%), by Country 2024 & 2032
- Figure 7: Europe Single-use Assemblies Industry Revenue (Million), by Country 2024 & 2032
- Figure 8: Europe Single-use Assemblies Industry Volume (K Unit), by Country 2024 & 2032
- Figure 9: Europe Single-use Assemblies Industry Revenue Share (%), by Country 2024 & 2032
- Figure 10: Europe Single-use Assemblies Industry Volume Share (%), by Country 2024 & 2032
- Figure 11: Asia Pacific Single-use Assemblies Industry Revenue (Million), by Country 2024 & 2032
- Figure 12: Asia Pacific Single-use Assemblies Industry Volume (K Unit), by Country 2024 & 2032
- Figure 13: Asia Pacific Single-use Assemblies Industry Revenue Share (%), by Country 2024 & 2032
- Figure 14: Asia Pacific Single-use Assemblies Industry Volume Share (%), by Country 2024 & 2032
- Figure 15: Middle East and Africa Single-use Assemblies Industry Revenue (Million), by Country 2024 & 2032
- Figure 16: Middle East and Africa Single-use Assemblies Industry Volume (K Unit), by Country 2024 & 2032
- Figure 17: Middle East and Africa Single-use Assemblies Industry Revenue Share (%), by Country 2024 & 2032
- Figure 18: Middle East and Africa Single-use Assemblies Industry Volume Share (%), by Country 2024 & 2032
- Figure 19: South America Single-use Assemblies Industry Revenue (Million), by Country 2024 & 2032
- Figure 20: South America Single-use Assemblies Industry Volume (K Unit), by Country 2024 & 2032
- Figure 21: South America Single-use Assemblies Industry Revenue Share (%), by Country 2024 & 2032
- Figure 22: South America Single-use Assemblies Industry Volume Share (%), by Country 2024 & 2032
- Figure 23: North America Single-use Assemblies Industry Revenue (Million), by Product Type 2024 & 2032
- Figure 24: North America Single-use Assemblies Industry Volume (K Unit), by Product Type 2024 & 2032
- Figure 25: North America Single-use Assemblies Industry Revenue Share (%), by Product Type 2024 & 2032
- Figure 26: North America Single-use Assemblies Industry Volume Share (%), by Product Type 2024 & 2032
- Figure 27: North America Single-use Assemblies Industry Revenue (Million), by Application 2024 & 2032
- Figure 28: North America Single-use Assemblies Industry Volume (K Unit), by Application 2024 & 2032
- Figure 29: North America Single-use Assemblies Industry Revenue Share (%), by Application 2024 & 2032
- Figure 30: North America Single-use Assemblies Industry Volume Share (%), by Application 2024 & 2032
- Figure 31: North America Single-use Assemblies Industry Revenue (Million), by End User 2024 & 2032
- Figure 32: North America Single-use Assemblies Industry Volume (K Unit), by End User 2024 & 2032
- Figure 33: North America Single-use Assemblies Industry Revenue Share (%), by End User 2024 & 2032
- Figure 34: North America Single-use Assemblies Industry Volume Share (%), by End User 2024 & 2032
- Figure 35: North America Single-use Assemblies Industry Revenue (Million), by Country 2024 & 2032
- Figure 36: North America Single-use Assemblies Industry Volume (K Unit), by Country 2024 & 2032
- Figure 37: North America Single-use Assemblies Industry Revenue Share (%), by Country 2024 & 2032
- Figure 38: North America Single-use Assemblies Industry Volume Share (%), by Country 2024 & 2032
- Figure 39: Europe Single-use Assemblies Industry Revenue (Million), by Product Type 2024 & 2032
- Figure 40: Europe Single-use Assemblies Industry Volume (K Unit), by Product Type 2024 & 2032
- Figure 41: Europe Single-use Assemblies Industry Revenue Share (%), by Product Type 2024 & 2032
- Figure 42: Europe Single-use Assemblies Industry Volume Share (%), by Product Type 2024 & 2032
- Figure 43: Europe Single-use Assemblies Industry Revenue (Million), by Application 2024 & 2032
- Figure 44: Europe Single-use Assemblies Industry Volume (K Unit), by Application 2024 & 2032
- Figure 45: Europe Single-use Assemblies Industry Revenue Share (%), by Application 2024 & 2032
- Figure 46: Europe Single-use Assemblies Industry Volume Share (%), by Application 2024 & 2032
- Figure 47: Europe Single-use Assemblies Industry Revenue (Million), by End User 2024 & 2032
- Figure 48: Europe Single-use Assemblies Industry Volume (K Unit), by End User 2024 & 2032
- Figure 49: Europe Single-use Assemblies Industry Revenue Share (%), by End User 2024 & 2032
- Figure 50: Europe Single-use Assemblies Industry Volume Share (%), by End User 2024 & 2032
- Figure 51: Europe Single-use Assemblies Industry Revenue (Million), by Country 2024 & 2032
- Figure 52: Europe Single-use Assemblies Industry Volume (K Unit), by Country 2024 & 2032
- Figure 53: Europe Single-use Assemblies Industry Revenue Share (%), by Country 2024 & 2032
- Figure 54: Europe Single-use Assemblies Industry Volume Share (%), by Country 2024 & 2032
- Figure 55: Asia Pacific Single-use Assemblies Industry Revenue (Million), by Product Type 2024 & 2032
- Figure 56: Asia Pacific Single-use Assemblies Industry Volume (K Unit), by Product Type 2024 & 2032
- Figure 57: Asia Pacific Single-use Assemblies Industry Revenue Share (%), by Product Type 2024 & 2032
- Figure 58: Asia Pacific Single-use Assemblies Industry Volume Share (%), by Product Type 2024 & 2032
- Figure 59: Asia Pacific Single-use Assemblies Industry Revenue (Million), by Application 2024 & 2032
- Figure 60: Asia Pacific Single-use Assemblies Industry Volume (K Unit), by Application 2024 & 2032
- Figure 61: Asia Pacific Single-use Assemblies Industry Revenue Share (%), by Application 2024 & 2032
- Figure 62: Asia Pacific Single-use Assemblies Industry Volume Share (%), by Application 2024 & 2032
- Figure 63: Asia Pacific Single-use Assemblies Industry Revenue (Million), by End User 2024 & 2032
- Figure 64: Asia Pacific Single-use Assemblies Industry Volume (K Unit), by End User 2024 & 2032
- Figure 65: Asia Pacific Single-use Assemblies Industry Revenue Share (%), by End User 2024 & 2032
- Figure 66: Asia Pacific Single-use Assemblies Industry Volume Share (%), by End User 2024 & 2032
- Figure 67: Asia Pacific Single-use Assemblies Industry Revenue (Million), by Country 2024 & 2032
- Figure 68: Asia Pacific Single-use Assemblies Industry Volume (K Unit), by Country 2024 & 2032
- Figure 69: Asia Pacific Single-use Assemblies Industry Revenue Share (%), by Country 2024 & 2032
- Figure 70: Asia Pacific Single-use Assemblies Industry Volume Share (%), by Country 2024 & 2032
- Figure 71: Middle East and Africa Single-use Assemblies Industry Revenue (Million), by Product Type 2024 & 2032
- Figure 72: Middle East and Africa Single-use Assemblies Industry Volume (K Unit), by Product Type 2024 & 2032
- Figure 73: Middle East and Africa Single-use Assemblies Industry Revenue Share (%), by Product Type 2024 & 2032
- Figure 74: Middle East and Africa Single-use Assemblies Industry Volume Share (%), by Product Type 2024 & 2032
- Figure 75: Middle East and Africa Single-use Assemblies Industry Revenue (Million), by Application 2024 & 2032
- Figure 76: Middle East and Africa Single-use Assemblies Industry Volume (K Unit), by Application 2024 & 2032
- Figure 77: Middle East and Africa Single-use Assemblies Industry Revenue Share (%), by Application 2024 & 2032
- Figure 78: Middle East and Africa Single-use Assemblies Industry Volume Share (%), by Application 2024 & 2032
- Figure 79: Middle East and Africa Single-use Assemblies Industry Revenue (Million), by End User 2024 & 2032
- Figure 80: Middle East and Africa Single-use Assemblies Industry Volume (K Unit), by End User 2024 & 2032
- Figure 81: Middle East and Africa Single-use Assemblies Industry Revenue Share (%), by End User 2024 & 2032
- Figure 82: Middle East and Africa Single-use Assemblies Industry Volume Share (%), by End User 2024 & 2032
- Figure 83: Middle East and Africa Single-use Assemblies Industry Revenue (Million), by Country 2024 & 2032
- Figure 84: Middle East and Africa Single-use Assemblies Industry Volume (K Unit), by Country 2024 & 2032
- Figure 85: Middle East and Africa Single-use Assemblies Industry Revenue Share (%), by Country 2024 & 2032
- Figure 86: Middle East and Africa Single-use Assemblies Industry Volume Share (%), by Country 2024 & 2032
- Figure 87: South America Single-use Assemblies Industry Revenue (Million), by Product Type 2024 & 2032
- Figure 88: South America Single-use Assemblies Industry Volume (K Unit), by Product Type 2024 & 2032
- Figure 89: South America Single-use Assemblies Industry Revenue Share (%), by Product Type 2024 & 2032
- Figure 90: South America Single-use Assemblies Industry Volume Share (%), by Product Type 2024 & 2032
- Figure 91: South America Single-use Assemblies Industry Revenue (Million), by Application 2024 & 2032
- Figure 92: South America Single-use Assemblies Industry Volume (K Unit), by Application 2024 & 2032
- Figure 93: South America Single-use Assemblies Industry Revenue Share (%), by Application 2024 & 2032
- Figure 94: South America Single-use Assemblies Industry Volume Share (%), by Application 2024 & 2032
- Figure 95: South America Single-use Assemblies Industry Revenue (Million), by End User 2024 & 2032
- Figure 96: South America Single-use Assemblies Industry Volume (K Unit), by End User 2024 & 2032
- Figure 97: South America Single-use Assemblies Industry Revenue Share (%), by End User 2024 & 2032
- Figure 98: South America Single-use Assemblies Industry Volume Share (%), by End User 2024 & 2032
- Figure 99: South America Single-use Assemblies Industry Revenue (Million), by Country 2024 & 2032
- Figure 100: South America Single-use Assemblies Industry Volume (K Unit), by Country 2024 & 2032
- Figure 101: South America Single-use Assemblies Industry Revenue Share (%), by Country 2024 & 2032
- Figure 102: South America Single-use Assemblies Industry Volume Share (%), by Country 2024 & 2032
List of Tables
- Table 1: Global Single-use Assemblies Industry Revenue Million Forecast, by Region 2019 & 2032
- Table 2: Global Single-use Assemblies Industry Volume K Unit Forecast, by Region 2019 & 2032
- Table 3: Global Single-use Assemblies Industry Revenue Million Forecast, by Product Type 2019 & 2032
- Table 4: Global Single-use Assemblies Industry Volume K Unit Forecast, by Product Type 2019 & 2032
- Table 5: Global Single-use Assemblies Industry Revenue Million Forecast, by Application 2019 & 2032
- Table 6: Global Single-use Assemblies Industry Volume K Unit Forecast, by Application 2019 & 2032
- Table 7: Global Single-use Assemblies Industry Revenue Million Forecast, by End User 2019 & 2032
- Table 8: Global Single-use Assemblies Industry Volume K Unit Forecast, by End User 2019 & 2032
- Table 9: Global Single-use Assemblies Industry Revenue Million Forecast, by Region 2019 & 2032
- Table 10: Global Single-use Assemblies Industry Volume K Unit Forecast, by Region 2019 & 2032
- Table 11: Global Single-use Assemblies Industry Revenue Million Forecast, by Country 2019 & 2032
- Table 12: Global Single-use Assemblies Industry Volume K Unit Forecast, by Country 2019 & 2032
- Table 13: United States Single-use Assemblies Industry Revenue (Million) Forecast, by Application 2019 & 2032
- Table 14: United States Single-use Assemblies Industry Volume (K Unit) Forecast, by Application 2019 & 2032
- Table 15: Canada Single-use Assemblies Industry Revenue (Million) Forecast, by Application 2019 & 2032
- Table 16: Canada Single-use Assemblies Industry Volume (K Unit) Forecast, by Application 2019 & 2032
- Table 17: Mexico Single-use Assemblies Industry Revenue (Million) Forecast, by Application 2019 & 2032
- Table 18: Mexico Single-use Assemblies Industry Volume (K Unit) Forecast, by Application 2019 & 2032
- Table 19: Global Single-use Assemblies Industry Revenue Million Forecast, by Country 2019 & 2032
- Table 20: Global Single-use Assemblies Industry Volume K Unit Forecast, by Country 2019 & 2032
- Table 21: Germany Single-use Assemblies Industry Revenue (Million) Forecast, by Application 2019 & 2032
- Table 22: Germany Single-use Assemblies Industry Volume (K Unit) Forecast, by Application 2019 & 2032
- Table 23: United Kingdom Single-use Assemblies Industry Revenue (Million) Forecast, by Application 2019 & 2032
- Table 24: United Kingdom Single-use Assemblies Industry Volume (K Unit) Forecast, by Application 2019 & 2032
- Table 25: France Single-use Assemblies Industry Revenue (Million) Forecast, by Application 2019 & 2032
- Table 26: France Single-use Assemblies Industry Volume (K Unit) Forecast, by Application 2019 & 2032
- Table 27: Italy Single-use Assemblies Industry Revenue (Million) Forecast, by Application 2019 & 2032
- Table 28: Italy Single-use Assemblies Industry Volume (K Unit) Forecast, by Application 2019 & 2032
- Table 29: Spain Single-use Assemblies Industry Revenue (Million) Forecast, by Application 2019 & 2032
- Table 30: Spain Single-use Assemblies Industry Volume (K Unit) Forecast, by Application 2019 & 2032
- Table 31: Rest of Europe Single-use Assemblies Industry Revenue (Million) Forecast, by Application 2019 & 2032
- Table 32: Rest of Europe Single-use Assemblies Industry Volume (K Unit) Forecast, by Application 2019 & 2032
- Table 33: Global Single-use Assemblies Industry Revenue Million Forecast, by Country 2019 & 2032
- Table 34: Global Single-use Assemblies Industry Volume K Unit Forecast, by Country 2019 & 2032
- Table 35: China Single-use Assemblies Industry Revenue (Million) Forecast, by Application 2019 & 2032
- Table 36: China Single-use Assemblies Industry Volume (K Unit) Forecast, by Application 2019 & 2032
- Table 37: Japan Single-use Assemblies Industry Revenue (Million) Forecast, by Application 2019 & 2032
- Table 38: Japan Single-use Assemblies Industry Volume (K Unit) Forecast, by Application 2019 & 2032
- Table 39: India Single-use Assemblies Industry Revenue (Million) Forecast, by Application 2019 & 2032
- Table 40: India Single-use Assemblies Industry Volume (K Unit) Forecast, by Application 2019 & 2032
- Table 41: Australia Single-use Assemblies Industry Revenue (Million) Forecast, by Application 2019 & 2032
- Table 42: Australia Single-use Assemblies Industry Volume (K Unit) Forecast, by Application 2019 & 2032
- Table 43: South Korea Single-use Assemblies Industry Revenue (Million) Forecast, by Application 2019 & 2032
- Table 44: South Korea Single-use Assemblies Industry Volume (K Unit) Forecast, by Application 2019 & 2032
- Table 45: Rest of Asia Pacific Single-use Assemblies Industry Revenue (Million) Forecast, by Application 2019 & 2032
- Table 46: Rest of Asia Pacific Single-use Assemblies Industry Volume (K Unit) Forecast, by Application 2019 & 2032
- Table 47: Global Single-use Assemblies Industry Revenue Million Forecast, by Country 2019 & 2032
- Table 48: Global Single-use Assemblies Industry Volume K Unit Forecast, by Country 2019 & 2032
- Table 49: GCC Single-use Assemblies Industry Revenue (Million) Forecast, by Application 2019 & 2032
- Table 50: GCC Single-use Assemblies Industry Volume (K Unit) Forecast, by Application 2019 & 2032
- Table 51: South Africa Single-use Assemblies Industry Revenue (Million) Forecast, by Application 2019 & 2032
- Table 52: South Africa Single-use Assemblies Industry Volume (K Unit) Forecast, by Application 2019 & 2032
- Table 53: Rest of Middle East and Africa Single-use Assemblies Industry Revenue (Million) Forecast, by Application 2019 & 2032
- Table 54: Rest of Middle East and Africa Single-use Assemblies Industry Volume (K Unit) Forecast, by Application 2019 & 2032
- Table 55: Global Single-use Assemblies Industry Revenue Million Forecast, by Country 2019 & 2032
- Table 56: Global Single-use Assemblies Industry Volume K Unit Forecast, by Country 2019 & 2032
- Table 57: Brazil Single-use Assemblies Industry Revenue (Million) Forecast, by Application 2019 & 2032
- Table 58: Brazil Single-use Assemblies Industry Volume (K Unit) Forecast, by Application 2019 & 2032
- Table 59: Argentina Single-use Assemblies Industry Revenue (Million) Forecast, by Application 2019 & 2032
- Table 60: Argentina Single-use Assemblies Industry Volume (K Unit) Forecast, by Application 2019 & 2032
- Table 61: Rest of South America Single-use Assemblies Industry Revenue (Million) Forecast, by Application 2019 & 2032
- Table 62: Rest of South America Single-use Assemblies Industry Volume (K Unit) Forecast, by Application 2019 & 2032
- Table 63: Global Single-use Assemblies Industry Revenue Million Forecast, by Product Type 2019 & 2032
- Table 64: Global Single-use Assemblies Industry Volume K Unit Forecast, by Product Type 2019 & 2032
- Table 65: Global Single-use Assemblies Industry Revenue Million Forecast, by Application 2019 & 2032
- Table 66: Global Single-use Assemblies Industry Volume K Unit Forecast, by Application 2019 & 2032
- Table 67: Global Single-use Assemblies Industry Revenue Million Forecast, by End User 2019 & 2032
- Table 68: Global Single-use Assemblies Industry Volume K Unit Forecast, by End User 2019 & 2032
- Table 69: Global Single-use Assemblies Industry Revenue Million Forecast, by Country 2019 & 2032
- Table 70: Global Single-use Assemblies Industry Volume K Unit Forecast, by Country 2019 & 2032
- Table 71: United States Single-use Assemblies Industry Revenue (Million) Forecast, by Application 2019 & 2032
- Table 72: United States Single-use Assemblies Industry Volume (K Unit) Forecast, by Application 2019 & 2032
- Table 73: Canada Single-use Assemblies Industry Revenue (Million) Forecast, by Application 2019 & 2032
- Table 74: Canada Single-use Assemblies Industry Volume (K Unit) Forecast, by Application 2019 & 2032
- Table 75: Mexico Single-use Assemblies Industry Revenue (Million) Forecast, by Application 2019 & 2032
- Table 76: Mexico Single-use Assemblies Industry Volume (K Unit) Forecast, by Application 2019 & 2032
- Table 77: Global Single-use Assemblies Industry Revenue Million Forecast, by Product Type 2019 & 2032
- Table 78: Global Single-use Assemblies Industry Volume K Unit Forecast, by Product Type 2019 & 2032
- Table 79: Global Single-use Assemblies Industry Revenue Million Forecast, by Application 2019 & 2032
- Table 80: Global Single-use Assemblies Industry Volume K Unit Forecast, by Application 2019 & 2032
- Table 81: Global Single-use Assemblies Industry Revenue Million Forecast, by End User 2019 & 2032
- Table 82: Global Single-use Assemblies Industry Volume K Unit Forecast, by End User 2019 & 2032
- Table 83: Global Single-use Assemblies Industry Revenue Million Forecast, by Country 2019 & 2032
- Table 84: Global Single-use Assemblies Industry Volume K Unit Forecast, by Country 2019 & 2032
- Table 85: Germany Single-use Assemblies Industry Revenue (Million) Forecast, by Application 2019 & 2032
- Table 86: Germany Single-use Assemblies Industry Volume (K Unit) Forecast, by Application 2019 & 2032
- Table 87: United Kingdom Single-use Assemblies Industry Revenue (Million) Forecast, by Application 2019 & 2032
- Table 88: United Kingdom Single-use Assemblies Industry Volume (K Unit) Forecast, by Application 2019 & 2032
- Table 89: France Single-use Assemblies Industry Revenue (Million) Forecast, by Application 2019 & 2032
- Table 90: France Single-use Assemblies Industry Volume (K Unit) Forecast, by Application 2019 & 2032
- Table 91: Italy Single-use Assemblies Industry Revenue (Million) Forecast, by Application 2019 & 2032
- Table 92: Italy Single-use Assemblies Industry Volume (K Unit) Forecast, by Application 2019 & 2032
- Table 93: Spain Single-use Assemblies Industry Revenue (Million) Forecast, by Application 2019 & 2032
- Table 94: Spain Single-use Assemblies Industry Volume (K Unit) Forecast, by Application 2019 & 2032
- Table 95: Rest of Europe Single-use Assemblies Industry Revenue (Million) Forecast, by Application 2019 & 2032
- Table 96: Rest of Europe Single-use Assemblies Industry Volume (K Unit) Forecast, by Application 2019 & 2032
- Table 97: Global Single-use Assemblies Industry Revenue Million Forecast, by Product Type 2019 & 2032
- Table 98: Global Single-use Assemblies Industry Volume K Unit Forecast, by Product Type 2019 & 2032
- Table 99: Global Single-use Assemblies Industry Revenue Million Forecast, by Application 2019 & 2032
- Table 100: Global Single-use Assemblies Industry Volume K Unit Forecast, by Application 2019 & 2032
- Table 101: Global Single-use Assemblies Industry Revenue Million Forecast, by End User 2019 & 2032
- Table 102: Global Single-use Assemblies Industry Volume K Unit Forecast, by End User 2019 & 2032
- Table 103: Global Single-use Assemblies Industry Revenue Million Forecast, by Country 2019 & 2032
- Table 104: Global Single-use Assemblies Industry Volume K Unit Forecast, by Country 2019 & 2032
- Table 105: China Single-use Assemblies Industry Revenue (Million) Forecast, by Application 2019 & 2032
- Table 106: China Single-use Assemblies Industry Volume (K Unit) Forecast, by Application 2019 & 2032
- Table 107: Japan Single-use Assemblies Industry Revenue (Million) Forecast, by Application 2019 & 2032
- Table 108: Japan Single-use Assemblies Industry Volume (K Unit) Forecast, by Application 2019 & 2032
- Table 109: India Single-use Assemblies Industry Revenue (Million) Forecast, by Application 2019 & 2032
- Table 110: India Single-use Assemblies Industry Volume (K Unit) Forecast, by Application 2019 & 2032
- Table 111: Australia Single-use Assemblies Industry Revenue (Million) Forecast, by Application 2019 & 2032
- Table 112: Australia Single-use Assemblies Industry Volume (K Unit) Forecast, by Application 2019 & 2032
- Table 113: South Korea Single-use Assemblies Industry Revenue (Million) Forecast, by Application 2019 & 2032
- Table 114: South Korea Single-use Assemblies Industry Volume (K Unit) Forecast, by Application 2019 & 2032
- Table 115: Rest of Asia Pacific Single-use Assemblies Industry Revenue (Million) Forecast, by Application 2019 & 2032
- Table 116: Rest of Asia Pacific Single-use Assemblies Industry Volume (K Unit) Forecast, by Application 2019 & 2032
- Table 117: Global Single-use Assemblies Industry Revenue Million Forecast, by Product Type 2019 & 2032
- Table 118: Global Single-use Assemblies Industry Volume K Unit Forecast, by Product Type 2019 & 2032
- Table 119: Global Single-use Assemblies Industry Revenue Million Forecast, by Application 2019 & 2032
- Table 120: Global Single-use Assemblies Industry Volume K Unit Forecast, by Application 2019 & 2032
- Table 121: Global Single-use Assemblies Industry Revenue Million Forecast, by End User 2019 & 2032
- Table 122: Global Single-use Assemblies Industry Volume K Unit Forecast, by End User 2019 & 2032
- Table 123: Global Single-use Assemblies Industry Revenue Million Forecast, by Country 2019 & 2032
- Table 124: Global Single-use Assemblies Industry Volume K Unit Forecast, by Country 2019 & 2032
- Table 125: GCC Single-use Assemblies Industry Revenue (Million) Forecast, by Application 2019 & 2032
- Table 126: GCC Single-use Assemblies Industry Volume (K Unit) Forecast, by Application 2019 & 2032
- Table 127: South Africa Single-use Assemblies Industry Revenue (Million) Forecast, by Application 2019 & 2032
- Table 128: South Africa Single-use Assemblies Industry Volume (K Unit) Forecast, by Application 2019 & 2032
- Table 129: Rest of Middle East and Africa Single-use Assemblies Industry Revenue (Million) Forecast, by Application 2019 & 2032
- Table 130: Rest of Middle East and Africa Single-use Assemblies Industry Volume (K Unit) Forecast, by Application 2019 & 2032
- Table 131: Global Single-use Assemblies Industry Revenue Million Forecast, by Product Type 2019 & 2032
- Table 132: Global Single-use Assemblies Industry Volume K Unit Forecast, by Product Type 2019 & 2032
- Table 133: Global Single-use Assemblies Industry Revenue Million Forecast, by Application 2019 & 2032
- Table 134: Global Single-use Assemblies Industry Volume K Unit Forecast, by Application 2019 & 2032
- Table 135: Global Single-use Assemblies Industry Revenue Million Forecast, by End User 2019 & 2032
- Table 136: Global Single-use Assemblies Industry Volume K Unit Forecast, by End User 2019 & 2032
- Table 137: Global Single-use Assemblies Industry Revenue Million Forecast, by Country 2019 & 2032
- Table 138: Global Single-use Assemblies Industry Volume K Unit Forecast, by Country 2019 & 2032
- Table 139: Brazil Single-use Assemblies Industry Revenue (Million) Forecast, by Application 2019 & 2032
- Table 140: Brazil Single-use Assemblies Industry Volume (K Unit) Forecast, by Application 2019 & 2032
- Table 141: Argentina Single-use Assemblies Industry Revenue (Million) Forecast, by Application 2019 & 2032
- Table 142: Argentina Single-use Assemblies Industry Volume (K Unit) Forecast, by Application 2019 & 2032
- Table 143: Rest of South America Single-use Assemblies Industry Revenue (Million) Forecast, by Application 2019 & 2032
- Table 144: Rest of South America Single-use Assemblies Industry Volume (K Unit) Forecast, by Application 2019 & 2032
Frequently Asked Questions
1. What is the projected Compound Annual Growth Rate (CAGR) of the Single-use Assemblies Industry?
The projected CAGR is approximately 15.96%.
2. Which companies are prominent players in the Single-use Assemblies Industry?
Key companies in the market include Repligen Corporation, Merck KGaA, Danaher (Pall Corporation), Entegris, Thermo Fisher Scientific Inc, Sartorius AG, PARKER HANNIFIN CORP, Antylia Scientific (Cole-Parmer), Avantor Inc, Saint-Gobain Life Sciences, Lonza, Corning Incorporated.
3. What are the main segments of the Single-use Assemblies Industry?
The market segments include Product Type, Application, End User.
4. Can you provide details about the market size?
The market size is estimated to be USD 2.94 Million as of 2022.
5. What are some drivers contributing to market growth?
Rapid Implementation and Low Risk of Cross-contamination; Increasing R&D Investment by Biopharmaceutical Companies; Growing Biologics Market.
6. What are the notable trends driving market growth?
Biopharmaceutical and Pharmaceutical Companies Segment Accounted For Significant Market Share.
7. Are there any restraints impacting market growth?
Issues Related to Extractables and Leachables.
8. Can you provide examples of recent developments in the market?
April 2024: SaniSure, a global provider of single-use bioprocessing products, launched Fill4Sure, which is a custom single-use filling assembly designed to expedite drugs to market and build security, efficiency, and repeatability into drug product filling. Fill4Sure is a cost-efficient, tailor-made single-use assembly that provides innovative solutions throughout the fill-finish process.
9. What pricing options are available for accessing the report?
Pricing options include single-user, multi-user, and enterprise licenses priced at USD 4750, USD 5250, and USD 8750 respectively.
10. Is the market size provided in terms of value or volume?
The market size is provided in terms of value, measured in Million and volume, measured in K Unit.
11. Are there any specific market keywords associated with the report?
Yes, the market keyword associated with the report is "Single-use Assemblies Industry," which aids in identifying and referencing the specific market segment covered.
12. How do I determine which pricing option suits my needs best?
The pricing options vary based on user requirements and access needs. Individual users may opt for single-user licenses, while businesses requiring broader access may choose multi-user or enterprise licenses for cost-effective access to the report.
13. Are there any additional resources or data provided in the Single-use Assemblies Industry report?
While the report offers comprehensive insights, it's advisable to review the specific contents or supplementary materials provided to ascertain if additional resources or data are available.
14. How can I stay updated on further developments or reports in the Single-use Assemblies Industry?
To stay informed about further developments, trends, and reports in the Single-use Assemblies Industry, consider subscribing to industry newsletters, following relevant companies and organizations, or regularly checking reputable industry news sources and publications.
Methodology
Step 1 - Identification of Relevant Samples Size from Population Database


Step 2 - Approaches for Defining Global Market Size (Value, Volume* & Price*)

Note*: In applicable scenarios
Step 3 - Data Sources
Primary Research
- Web Analytics
- Survey Reports
- Research Institute
- Latest Research Reports
- Opinion Leaders
Secondary Research
- Annual Reports
- White Paper
- Latest Press Release
- Industry Association
- Paid Database
- Investor Presentations

Step 4 - Data Triangulation
Involves using different sources of information in order to increase the validity of a study
These sources are likely to be stakeholders in a program - participants, other researchers, program staff, other community members, and so on.
Then we put all data in single framework & apply various statistical tools to find out the dynamic on the market.
During the analysis stage, feedback from the stakeholder groups would be compared to determine areas of agreement as well as areas of divergence


