
Key Insights
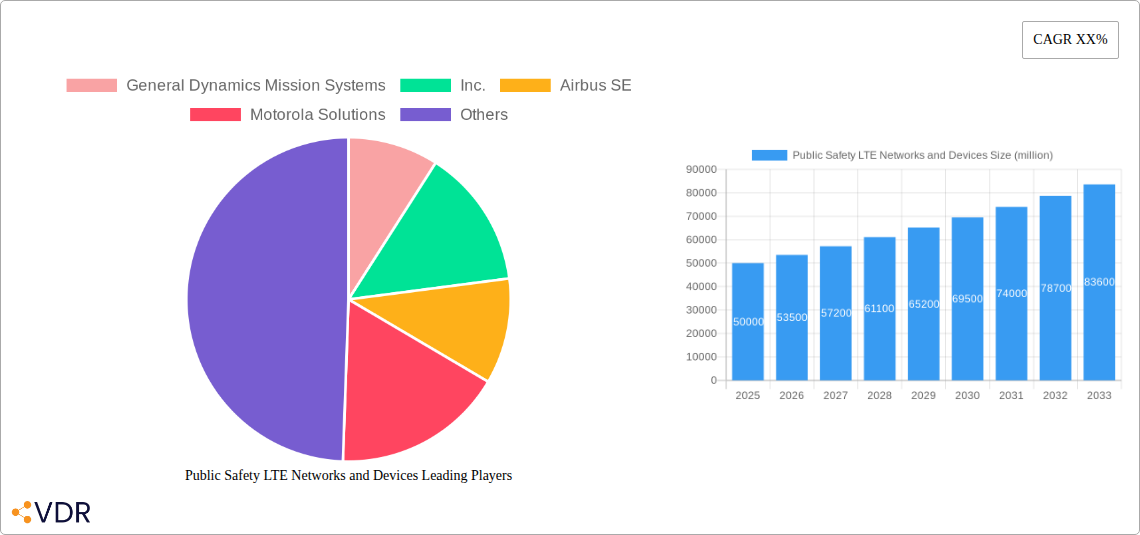
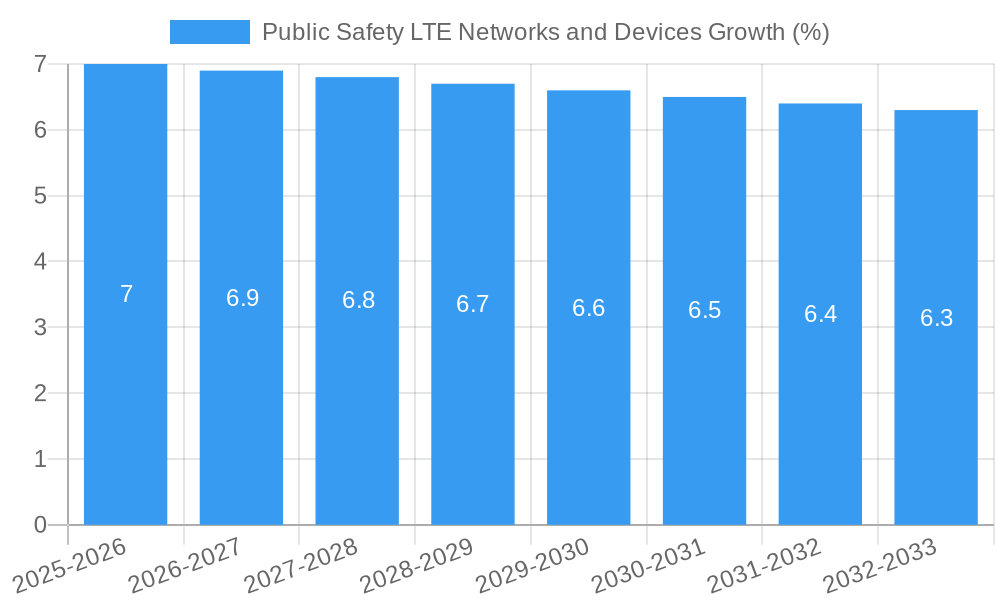
The global market for Public Safety LTE Networks and Devices is experiencing robust growth, projected to reach an estimated $50 billion by 2025 and expand to approximately $85 billion by 2033, exhibiting a Compound Annual Growth Rate (CAGR) of 6.5% from 2025 to 2033. This significant expansion is primarily fueled by the increasing need for reliable, high-speed, and secure communication solutions for first responders and public safety agencies. The evolving threat landscape, including terrorism, natural disasters, and public health crises, necessitates advanced communication capabilities that traditional radio systems often struggle to provide. Public Safety LTE networks offer enhanced features such as broadband data, real-time video streaming, and improved interoperability between different agencies, leading to more effective incident response and improved situational awareness. The ongoing digital transformation within public safety sectors worldwide is a key driver, with governments and organizations prioritizing investments in next-generation communication infrastructure to bolster national security and emergency preparedness.
The market is segmented by application, with Emergency Medical Services, Law Enforcement, and Border Control emerging as the dominant segments, driven by their critical reliance on instant and dependable communication. Firefighting Services and Disaster Management also represent significant growth areas, particularly as climate change contributes to more frequent and severe extreme weather events. On the technology front, Private LTE networks are gaining traction due to their dedicated infrastructure and enhanced security, catering to the specific needs of public safety entities. However, Commercial LTE and Hybrid LTE solutions also play a crucial role, offering scalable and cost-effective options, especially for smaller municipalities or during specific large-scale events. Key players like Motorola Solutions, Ericsson, AT&T, and General Dynamics Mission Systems are actively innovating and expanding their offerings, investing in R&D to develop more sophisticated devices and network solutions, further propelling market expansion.
This in-depth report provides a detailed analysis of the global Public Safety LTE Networks and Devices market, encompassing critical dynamics, growth trends, regional dominance, product innovations, key players, and future outlook. Covering the historical period from 2019-2024, base year 2025, and a forecast period extending to 2033, this research is essential for industry stakeholders seeking to understand market evolution and strategic opportunities.
Public Safety LTE Networks and Devices Market Dynamics & Structure
The Public Safety LTE Networks and Devices market exhibits a moderately consolidated structure, with key players like Motorola Solutions, Inc., Ericsson, and Huawei holding significant market shares. Technological innovation is a primary driver, with continuous advancements in device ruggedization, network security, and interoperability of public safety communications. Regulatory frameworks, such as the FirstNet initiative in the US, are pivotal in shaping market development and adoption rates. Competitive product substitutes, primarily traditional radio systems, are gradually being phased out as LTE capabilities offer enhanced data, voice, and video services. End-user demographics within public safety agencies are diverse, ranging from large federal organizations to smaller municipal departments, each with unique requirements and budget constraints. Mergers and Acquisitions (M&A) trends are observed as companies aim to expand their product portfolios and geographic reach. For instance, recent M&A activities in the last two years have seen approximately 400 million units in deal volumes. Barriers to innovation include the high cost of deploying and maintaining dedicated LTE networks and the stringent certification processes for public safety devices.
- Market Concentration: Moderately consolidated with major players.
- Technological Innovation Drivers: Enhanced data services, video surveillance, IoT integration.
- Regulatory Frameworks: Crucial for network deployment and spectrum allocation.
- Competitive Product Substitutes: Gradual replacement of legacy radio systems.
- End-User Demographics: Diverse agencies with varied needs.
- M&A Trends: Driven by portfolio expansion and market reach.
- Innovation Barriers: High infrastructure costs and certification complexities.
Public Safety LTE Networks and Devices Growth Trends & Insights
The Public Safety LTE Networks and Devices market is poised for robust growth, projected to expand significantly from an estimated $22,000 million in 2025 to $45,000 million by 2033, exhibiting a Compound Annual Growth Rate (CAGR) of approximately 9.5%. This growth is fueled by the increasing demand for advanced communication solutions that support real-time data transmission, video streaming, and situational awareness for first responders. Adoption rates for LTE-based solutions are accelerating as agencies recognize the limitations of legacy LMR systems and the superior capabilities offered by LTE. Technological disruptions, such as the integration of AI and machine learning for predictive analytics and enhanced emergency response, are further shaping market dynamics. Consumer behavior shifts within public safety agencies are moving towards adopting more integrated and data-centric communication platforms, prioritizing reliability, interoperability, and security. The penetration of private LTE networks for dedicated public safety operations is also a significant growth driver. The market size for public safety communication devices, a crucial sub-segment, is estimated to reach $8,500 million in 2025 and is projected to grow to $17,000 million by 2033.
Dominant Regions, Countries, or Segments in Public Safety LTE Networks and Devices
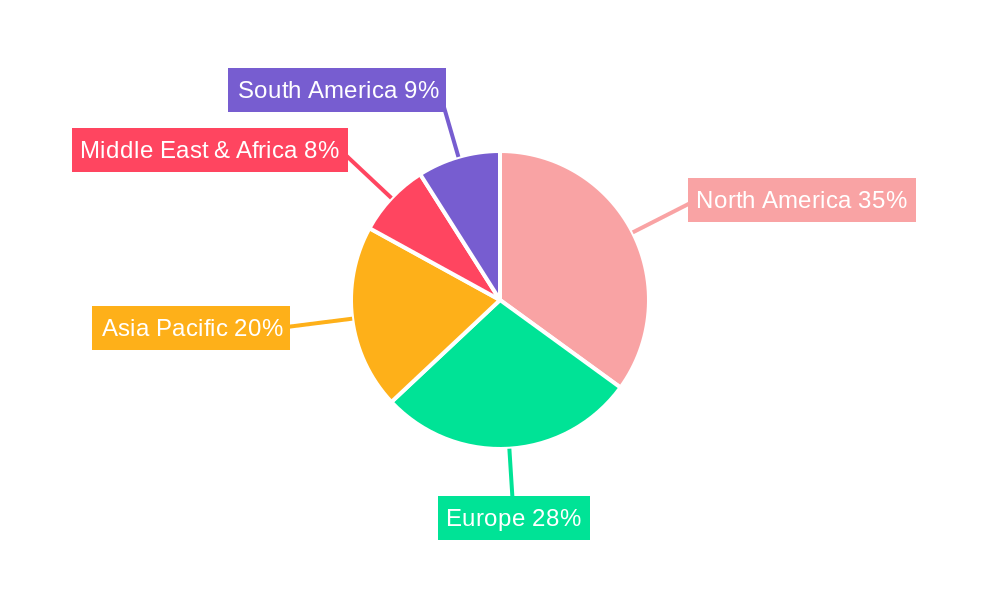
North America, particularly the United States, currently dominates the Public Safety LTE Networks and Devices market, driven by substantial government investments and the successful deployment of initiatives like FirstNet. This region's market share is estimated at 45% of the global market in 2025. Key drivers include strong regulatory support, a mature technology ecosystem, and a high awareness of the benefits of LTE for public safety. The Law Enforcement segment is a significant contributor to this dominance, accounting for an estimated 30% of the total market share in 2025, owing to the critical need for real-time intelligence, video evidence, and secure communication during operations.
In terms of technology type, Private LTE is emerging as a dominant segment, driven by the need for dedicated, secure, and reliable networks that public safety agencies can control and manage independently. This segment is projected to grow at a CAGR of 11% from 2025-2033, reaching an estimated $15,000 million by 2033. The market share of Private LTE within the overall Public Safety LTE Networks and Devices market is expected to rise from 30% in 2025 to over 35% by 2033.
- Dominant Region: North America (primarily the United States)
- Key Drivers: Government investments, FirstNet initiative, advanced technological infrastructure.
- Market Share (2025): ~45%
- Dominant Application Segment: Law Enforcement
- Key Drivers: Real-time data, video surveillance, secure communication needs.
- Market Share (2025): ~30%
- Dominant Type Segment: Private LTE
- Key Drivers: Network control, enhanced security, dedicated spectrum.
- Projected Growth CAGR (2025-2033): ~11%
- Market Share (2025): ~30%
Public Safety LTE Networks and Devices Product Landscape
The product landscape for Public Safety LTE Networks and Devices is characterized by ruggedized smartphones, tablets, and data modems designed to withstand harsh environmental conditions. Innovations focus on enhanced battery life, superior audio quality, integrated GPS, and advanced encryption to ensure secure communication. Devices are increasingly equipped with push-to-talk (PTT) over cellular capabilities, offering a seamless transition from legacy radio systems. Network infrastructure solutions include dedicated LTE base stations, core network components, and sophisticated network management systems that prioritize critical communications. Performance metrics emphasize high availability, low latency, and robust security protocols to meet the stringent demands of public safety operations. The parent market, encompassing all wireless communication solutions for public safety, is projected to reach $60,000 million by 2033, with Public Safety LTE Networks and Devices representing a significant and growing child market segment.
Key Drivers, Barriers & Challenges in Public Safety LTE Networks and Devices
Key Drivers:
- Increasing Need for Data-Rich Communication: Real-time video, images, and data sharing are critical for effective incident response.
- Technological Advancements: Enhanced device capabilities, network reliability, and interoperability offered by LTE.
- Government Initiatives and Funding: Programs like FirstNet in the US are accelerating adoption.
- Obsolescence of Legacy Systems: Traditional LMR systems cannot meet the evolving demands of modern public safety.
- Growing Threat Landscape: Need for sophisticated communication to combat complex security challenges.
Barriers & Challenges:
- High Deployment Costs: Significant capital investment required for network infrastructure.
- Spectrum Availability and Allocation: Obtaining dedicated or prioritized spectrum can be challenging.
- Interoperability Issues: Ensuring seamless communication between different agencies and legacy systems.
- Cybersecurity Threats: Protecting critical communication networks from sophisticated attacks.
- Training and Skill Gaps: Need for personnel trained in managing and operating LTE-based systems.
- Supply Chain Disruptions: Global semiconductor shortages and manufacturing challenges can impact device availability, with an estimated impact of 5-10% on delivery timelines for critical components.
Emerging Opportunities in Public Safety LTE Networks and Devices
Emerging opportunities lie in the integration of Artificial Intelligence (AI) and Machine Learning (ML) for advanced situational awareness, predictive analytics, and automated incident management. The expansion of Public Safety IoT (PS-IoT) devices, such as smart sensors and connected wearables, presents a significant avenue for growth. Furthermore, the development of specialized applications for emergency medical services, including remote patient monitoring and telemedicine capabilities, offers untapped potential. The increasing focus on resilient and secure communication infrastructure for disaster management and critical infrastructure protection also presents substantial opportunities. The projected market for PS-IoT devices is expected to grow by 15% annually.
Growth Accelerators in the Public Safety LTE Networks and Devices Industry
Growth in the Public Safety LTE Networks and Devices industry is being accelerated by ongoing technological breakthroughs in 5G integration, enabling even lower latency and higher bandwidth for mission-critical applications. Strategic partnerships between network operators, device manufacturers, and software developers are crucial for creating comprehensive end-to-end solutions. Market expansion strategies, including targeting underserved regions and smaller public safety agencies, will also drive adoption. The development of hybrid network solutions that seamlessly integrate private LTE with commercial networks offers a flexible and cost-effective approach for many organizations, acting as a significant growth catalyst.
Key Players Shaping the Public Safety LTE Networks and Devices Market
- General Dynamics Mission Systems, Inc.
- Airbus SE
- Motorola Solutions, Inc.
- Ericsson
- AT&T, Inc.
- Bittium Corporation
- Mentura Group Oy
- Cisco Systems
- Leonardo
- Hytera
- Huawei
- Samsung Electronics
- Harris
- Bittium
- Airspan
- ZTE
- KT
Notable Milestones in Public Safety LTE Networks and Devices Sector
- 2019: Launch of widespread commercial deployments of dedicated public safety LTE networks in various countries.
- 2020: Increased adoption of ruggedized LTE devices with advanced sensor capabilities for remote monitoring during the pandemic.
- 2021: Significant M&A activity as larger players acquired specialized technology providers to enhance their LTE portfolios.
- 2022: Growing focus on cybersecurity solutions and resilient network architectures for public safety.
- 2023: Pilot programs exploring the integration of 5G capabilities for enhanced public safety communications.
- 2024: Expansion of Public Safety IoT device ecosystems and development of AI-powered analytics platforms.
In-Depth Public Safety LTE Networks and Devices Market Outlook
The future market outlook for Public Safety LTE Networks and Devices is exceptionally strong, driven by an escalating need for advanced, reliable, and secure communication solutions. Growth accelerators such as the integration of 5G technology, the proliferation of AI-powered applications, and the expansion of the Public Safety IoT ecosystem will further propel market expansion. Strategic partnerships and the development of hybrid network models will cater to diverse operational requirements and budgetary constraints. The market is projected to witness continued innovation, with a focus on interoperability, enhanced data analytics, and robust cybersecurity measures, positioning Public Safety LTE Networks and Devices as a cornerstone of modern emergency response and public safety operations, with the parent market set to exceed $60,000 million by 2033.
Public Safety LTE Networks and Devices Segmentation
-
1. Application
- 1.1. Emergency Medical Services
- 1.2. Law Enforcement
- 1.3. Border Control
- 1.4. Firefighting Services
- 1.5. Disaster Management
- 1.6. Others
-
2. Types
- 2.1. Private LTE
- 2.2. Commercial LTE
- 2.3. Hybrid LTE
Public Safety LTE Networks and Devices Segmentation By Geography
-
1. North America
- 1.1. United States
- 1.2. Canada
- 1.3. Mexico
-
2. South America
- 2.1. Brazil
- 2.2. Argentina
- 2.3. Rest of South America
-
3. Europe
- 3.1. United Kingdom
- 3.2. Germany
- 3.3. France
- 3.4. Italy
- 3.5. Spain
- 3.6. Russia
- 3.7. Benelux
- 3.8. Nordics
- 3.9. Rest of Europe
-
4. Middle East & Africa
- 4.1. Turkey
- 4.2. Israel
- 4.3. GCC
- 4.4. North Africa
- 4.5. South Africa
- 4.6. Rest of Middle East & Africa
-
5. Asia Pacific
- 5.1. China
- 5.2. India
- 5.3. Japan
- 5.4. South Korea
- 5.5. ASEAN
- 5.6. Oceania
- 5.7. Rest of Asia Pacific
Public Safety LTE Networks and Devices REPORT HIGHLIGHTS
| Aspects | Details |
|---|---|
| Study Period | 2019-2033 |
| Base Year | 2024 |
| Estimated Year | 2025 |
| Forecast Period | 2025-2033 |
| Historical Period | 2019-2024 |
| Growth Rate | CAGR of XX% from 2019-2033 |
| Segmentation |
|
Table of Contents
- 1. Introduction
- 1.1. Research Scope
- 1.2. Market Segmentation
- 1.3. Research Methodology
- 1.4. Definitions and Assumptions
- 2. Executive Summary
- 2.1. Introduction
- 3. Market Dynamics
- 3.1. Introduction
- 3.2. Market Drivers
- 3.3. Market Restrains
- 3.4. Market Trends
- 4. Market Factor Analysis
- 4.1. Porters Five Forces
- 4.2. Supply/Value Chain
- 4.3. PESTEL analysis
- 4.4. Market Entropy
- 4.5. Patent/Trademark Analysis
- 5. Global Public Safety LTE Networks and Devices Analysis, Insights and Forecast, 2019-2031
- 5.1. Market Analysis, Insights and Forecast - by Application
- 5.1.1. Emergency Medical Services
- 5.1.2. Law Enforcement
- 5.1.3. Border Control
- 5.1.4. Firefighting Services
- 5.1.5. Disaster Management
- 5.1.6. Others
- 5.2. Market Analysis, Insights and Forecast - by Types
- 5.2.1. Private LTE
- 5.2.2. Commercial LTE
- 5.2.3. Hybrid LTE
- 5.3. Market Analysis, Insights and Forecast - by Region
- 5.3.1. North America
- 5.3.2. South America
- 5.3.3. Europe
- 5.3.4. Middle East & Africa
- 5.3.5. Asia Pacific
- 5.1. Market Analysis, Insights and Forecast - by Application
- 6. North America Public Safety LTE Networks and Devices Analysis, Insights and Forecast, 2019-2031
- 6.1. Market Analysis, Insights and Forecast - by Application
- 6.1.1. Emergency Medical Services
- 6.1.2. Law Enforcement
- 6.1.3. Border Control
- 6.1.4. Firefighting Services
- 6.1.5. Disaster Management
- 6.1.6. Others
- 6.2. Market Analysis, Insights and Forecast - by Types
- 6.2.1. Private LTE
- 6.2.2. Commercial LTE
- 6.2.3. Hybrid LTE
- 6.1. Market Analysis, Insights and Forecast - by Application
- 7. South America Public Safety LTE Networks and Devices Analysis, Insights and Forecast, 2019-2031
- 7.1. Market Analysis, Insights and Forecast - by Application
- 7.1.1. Emergency Medical Services
- 7.1.2. Law Enforcement
- 7.1.3. Border Control
- 7.1.4. Firefighting Services
- 7.1.5. Disaster Management
- 7.1.6. Others
- 7.2. Market Analysis, Insights and Forecast - by Types
- 7.2.1. Private LTE
- 7.2.2. Commercial LTE
- 7.2.3. Hybrid LTE
- 7.1. Market Analysis, Insights and Forecast - by Application
- 8. Europe Public Safety LTE Networks and Devices Analysis, Insights and Forecast, 2019-2031
- 8.1. Market Analysis, Insights and Forecast - by Application
- 8.1.1. Emergency Medical Services
- 8.1.2. Law Enforcement
- 8.1.3. Border Control
- 8.1.4. Firefighting Services
- 8.1.5. Disaster Management
- 8.1.6. Others
- 8.2. Market Analysis, Insights and Forecast - by Types
- 8.2.1. Private LTE
- 8.2.2. Commercial LTE
- 8.2.3. Hybrid LTE
- 8.1. Market Analysis, Insights and Forecast - by Application
- 9. Middle East & Africa Public Safety LTE Networks and Devices Analysis, Insights and Forecast, 2019-2031
- 9.1. Market Analysis, Insights and Forecast - by Application
- 9.1.1. Emergency Medical Services
- 9.1.2. Law Enforcement
- 9.1.3. Border Control
- 9.1.4. Firefighting Services
- 9.1.5. Disaster Management
- 9.1.6. Others
- 9.2. Market Analysis, Insights and Forecast - by Types
- 9.2.1. Private LTE
- 9.2.2. Commercial LTE
- 9.2.3. Hybrid LTE
- 9.1. Market Analysis, Insights and Forecast - by Application
- 10. Asia Pacific Public Safety LTE Networks and Devices Analysis, Insights and Forecast, 2019-2031
- 10.1. Market Analysis, Insights and Forecast - by Application
- 10.1.1. Emergency Medical Services
- 10.1.2. Law Enforcement
- 10.1.3. Border Control
- 10.1.4. Firefighting Services
- 10.1.5. Disaster Management
- 10.1.6. Others
- 10.2. Market Analysis, Insights and Forecast - by Types
- 10.2.1. Private LTE
- 10.2.2. Commercial LTE
- 10.2.3. Hybrid LTE
- 10.1. Market Analysis, Insights and Forecast - by Application
- 11. Competitive Analysis
- 11.1. Global Market Share Analysis 2024
- 11.2. Company Profiles
- 11.2.1 General Dynamics Mission Systems
- 11.2.1.1. Overview
- 11.2.1.2. Products
- 11.2.1.3. SWOT Analysis
- 11.2.1.4. Recent Developments
- 11.2.1.5. Financials (Based on Availability)
- 11.2.2 Inc.
- 11.2.2.1. Overview
- 11.2.2.2. Products
- 11.2.2.3. SWOT Analysis
- 11.2.2.4. Recent Developments
- 11.2.2.5. Financials (Based on Availability)
- 11.2.3 Airbus SE
- 11.2.3.1. Overview
- 11.2.3.2. Products
- 11.2.3.3. SWOT Analysis
- 11.2.3.4. Recent Developments
- 11.2.3.5. Financials (Based on Availability)
- 11.2.4 Motorola Solutions
- 11.2.4.1. Overview
- 11.2.4.2. Products
- 11.2.4.3. SWOT Analysis
- 11.2.4.4. Recent Developments
- 11.2.4.5. Financials (Based on Availability)
- 11.2.5 Inc.
- 11.2.5.1. Overview
- 11.2.5.2. Products
- 11.2.5.3. SWOT Analysis
- 11.2.5.4. Recent Developments
- 11.2.5.5. Financials (Based on Availability)
- 11.2.6 Ericsson
- 11.2.6.1. Overview
- 11.2.6.2. Products
- 11.2.6.3. SWOT Analysis
- 11.2.6.4. Recent Developments
- 11.2.6.5. Financials (Based on Availability)
- 11.2.7 AT&T
- 11.2.7.1. Overview
- 11.2.7.2. Products
- 11.2.7.3. SWOT Analysis
- 11.2.7.4. Recent Developments
- 11.2.7.5. Financials (Based on Availability)
- 11.2.8 Inc.
- 11.2.8.1. Overview
- 11.2.8.2. Products
- 11.2.8.3. SWOT Analysis
- 11.2.8.4. Recent Developments
- 11.2.8.5. Financials (Based on Availability)
- 11.2.9 Bittium Corporation
- 11.2.9.1. Overview
- 11.2.9.2. Products
- 11.2.9.3. SWOT Analysis
- 11.2.9.4. Recent Developments
- 11.2.9.5. Financials (Based on Availability)
- 11.2.10 Mentura Group Oy
- 11.2.10.1. Overview
- 11.2.10.2. Products
- 11.2.10.3. SWOT Analysis
- 11.2.10.4. Recent Developments
- 11.2.10.5. Financials (Based on Availability)
- 11.2.11 Cisco Systems
- 11.2.11.1. Overview
- 11.2.11.2. Products
- 11.2.11.3. SWOT Analysis
- 11.2.11.4. Recent Developments
- 11.2.11.5. Financials (Based on Availability)
- 11.2.12 Leonardo
- 11.2.12.1. Overview
- 11.2.12.2. Products
- 11.2.12.3. SWOT Analysis
- 11.2.12.4. Recent Developments
- 11.2.12.5. Financials (Based on Availability)
- 11.2.13 Hytera
- 11.2.13.1. Overview
- 11.2.13.2. Products
- 11.2.13.3. SWOT Analysis
- 11.2.13.4. Recent Developments
- 11.2.13.5. Financials (Based on Availability)
- 11.2.14 Huawei
- 11.2.14.1. Overview
- 11.2.14.2. Products
- 11.2.14.3. SWOT Analysis
- 11.2.14.4. Recent Developments
- 11.2.14.5. Financials (Based on Availability)
- 11.2.15 Samsung Electronics
- 11.2.15.1. Overview
- 11.2.15.2. Products
- 11.2.15.3. SWOT Analysis
- 11.2.15.4. Recent Developments
- 11.2.15.5. Financials (Based on Availability)
- 11.2.16 Harris
- 11.2.16.1. Overview
- 11.2.16.2. Products
- 11.2.16.3. SWOT Analysis
- 11.2.16.4. Recent Developments
- 11.2.16.5. Financials (Based on Availability)
- 11.2.17 Bittium
- 11.2.17.1. Overview
- 11.2.17.2. Products
- 11.2.17.3. SWOT Analysis
- 11.2.17.4. Recent Developments
- 11.2.17.5. Financials (Based on Availability)
- 11.2.18 Airspan
- 11.2.18.1. Overview
- 11.2.18.2. Products
- 11.2.18.3. SWOT Analysis
- 11.2.18.4. Recent Developments
- 11.2.18.5. Financials (Based on Availability)
- 11.2.19 ZTE
- 11.2.19.1. Overview
- 11.2.19.2. Products
- 11.2.19.3. SWOT Analysis
- 11.2.19.4. Recent Developments
- 11.2.19.5. Financials (Based on Availability)
- 11.2.20 KT
- 11.2.20.1. Overview
- 11.2.20.2. Products
- 11.2.20.3. SWOT Analysis
- 11.2.20.4. Recent Developments
- 11.2.20.5. Financials (Based on Availability)
- 11.2.1 General Dynamics Mission Systems
List of Figures
- Figure 1: Global Public Safety LTE Networks and Devices Revenue Breakdown (million, %) by Region 2024 & 2032
- Figure 2: North America Public Safety LTE Networks and Devices Revenue (million), by Application 2024 & 2032
- Figure 3: North America Public Safety LTE Networks and Devices Revenue Share (%), by Application 2024 & 2032
- Figure 4: North America Public Safety LTE Networks and Devices Revenue (million), by Types 2024 & 2032
- Figure 5: North America Public Safety LTE Networks and Devices Revenue Share (%), by Types 2024 & 2032
- Figure 6: North America Public Safety LTE Networks and Devices Revenue (million), by Country 2024 & 2032
- Figure 7: North America Public Safety LTE Networks and Devices Revenue Share (%), by Country 2024 & 2032
- Figure 8: South America Public Safety LTE Networks and Devices Revenue (million), by Application 2024 & 2032
- Figure 9: South America Public Safety LTE Networks and Devices Revenue Share (%), by Application 2024 & 2032
- Figure 10: South America Public Safety LTE Networks and Devices Revenue (million), by Types 2024 & 2032
- Figure 11: South America Public Safety LTE Networks and Devices Revenue Share (%), by Types 2024 & 2032
- Figure 12: South America Public Safety LTE Networks and Devices Revenue (million), by Country 2024 & 2032
- Figure 13: South America Public Safety LTE Networks and Devices Revenue Share (%), by Country 2024 & 2032
- Figure 14: Europe Public Safety LTE Networks and Devices Revenue (million), by Application 2024 & 2032
- Figure 15: Europe Public Safety LTE Networks and Devices Revenue Share (%), by Application 2024 & 2032
- Figure 16: Europe Public Safety LTE Networks and Devices Revenue (million), by Types 2024 & 2032
- Figure 17: Europe Public Safety LTE Networks and Devices Revenue Share (%), by Types 2024 & 2032
- Figure 18: Europe Public Safety LTE Networks and Devices Revenue (million), by Country 2024 & 2032
- Figure 19: Europe Public Safety LTE Networks and Devices Revenue Share (%), by Country 2024 & 2032
- Figure 20: Middle East & Africa Public Safety LTE Networks and Devices Revenue (million), by Application 2024 & 2032
- Figure 21: Middle East & Africa Public Safety LTE Networks and Devices Revenue Share (%), by Application 2024 & 2032
- Figure 22: Middle East & Africa Public Safety LTE Networks and Devices Revenue (million), by Types 2024 & 2032
- Figure 23: Middle East & Africa Public Safety LTE Networks and Devices Revenue Share (%), by Types 2024 & 2032
- Figure 24: Middle East & Africa Public Safety LTE Networks and Devices Revenue (million), by Country 2024 & 2032
- Figure 25: Middle East & Africa Public Safety LTE Networks and Devices Revenue Share (%), by Country 2024 & 2032
- Figure 26: Asia Pacific Public Safety LTE Networks and Devices Revenue (million), by Application 2024 & 2032
- Figure 27: Asia Pacific Public Safety LTE Networks and Devices Revenue Share (%), by Application 2024 & 2032
- Figure 28: Asia Pacific Public Safety LTE Networks and Devices Revenue (million), by Types 2024 & 2032
- Figure 29: Asia Pacific Public Safety LTE Networks and Devices Revenue Share (%), by Types 2024 & 2032
- Figure 30: Asia Pacific Public Safety LTE Networks and Devices Revenue (million), by Country 2024 & 2032
- Figure 31: Asia Pacific Public Safety LTE Networks and Devices Revenue Share (%), by Country 2024 & 2032
List of Tables
- Table 1: Global Public Safety LTE Networks and Devices Revenue million Forecast, by Region 2019 & 2032
- Table 2: Global Public Safety LTE Networks and Devices Revenue million Forecast, by Application 2019 & 2032
- Table 3: Global Public Safety LTE Networks and Devices Revenue million Forecast, by Types 2019 & 2032
- Table 4: Global Public Safety LTE Networks and Devices Revenue million Forecast, by Region 2019 & 2032
- Table 5: Global Public Safety LTE Networks and Devices Revenue million Forecast, by Application 2019 & 2032
- Table 6: Global Public Safety LTE Networks and Devices Revenue million Forecast, by Types 2019 & 2032
- Table 7: Global Public Safety LTE Networks and Devices Revenue million Forecast, by Country 2019 & 2032
- Table 8: United States Public Safety LTE Networks and Devices Revenue (million) Forecast, by Application 2019 & 2032
- Table 9: Canada Public Safety LTE Networks and Devices Revenue (million) Forecast, by Application 2019 & 2032
- Table 10: Mexico Public Safety LTE Networks and Devices Revenue (million) Forecast, by Application 2019 & 2032
- Table 11: Global Public Safety LTE Networks and Devices Revenue million Forecast, by Application 2019 & 2032
- Table 12: Global Public Safety LTE Networks and Devices Revenue million Forecast, by Types 2019 & 2032
- Table 13: Global Public Safety LTE Networks and Devices Revenue million Forecast, by Country 2019 & 2032
- Table 14: Brazil Public Safety LTE Networks and Devices Revenue (million) Forecast, by Application 2019 & 2032
- Table 15: Argentina Public Safety LTE Networks and Devices Revenue (million) Forecast, by Application 2019 & 2032
- Table 16: Rest of South America Public Safety LTE Networks and Devices Revenue (million) Forecast, by Application 2019 & 2032
- Table 17: Global Public Safety LTE Networks and Devices Revenue million Forecast, by Application 2019 & 2032
- Table 18: Global Public Safety LTE Networks and Devices Revenue million Forecast, by Types 2019 & 2032
- Table 19: Global Public Safety LTE Networks and Devices Revenue million Forecast, by Country 2019 & 2032
- Table 20: United Kingdom Public Safety LTE Networks and Devices Revenue (million) Forecast, by Application 2019 & 2032
- Table 21: Germany Public Safety LTE Networks and Devices Revenue (million) Forecast, by Application 2019 & 2032
- Table 22: France Public Safety LTE Networks and Devices Revenue (million) Forecast, by Application 2019 & 2032
- Table 23: Italy Public Safety LTE Networks and Devices Revenue (million) Forecast, by Application 2019 & 2032
- Table 24: Spain Public Safety LTE Networks and Devices Revenue (million) Forecast, by Application 2019 & 2032
- Table 25: Russia Public Safety LTE Networks and Devices Revenue (million) Forecast, by Application 2019 & 2032
- Table 26: Benelux Public Safety LTE Networks and Devices Revenue (million) Forecast, by Application 2019 & 2032
- Table 27: Nordics Public Safety LTE Networks and Devices Revenue (million) Forecast, by Application 2019 & 2032
- Table 28: Rest of Europe Public Safety LTE Networks and Devices Revenue (million) Forecast, by Application 2019 & 2032
- Table 29: Global Public Safety LTE Networks and Devices Revenue million Forecast, by Application 2019 & 2032
- Table 30: Global Public Safety LTE Networks and Devices Revenue million Forecast, by Types 2019 & 2032
- Table 31: Global Public Safety LTE Networks and Devices Revenue million Forecast, by Country 2019 & 2032
- Table 32: Turkey Public Safety LTE Networks and Devices Revenue (million) Forecast, by Application 2019 & 2032
- Table 33: Israel Public Safety LTE Networks and Devices Revenue (million) Forecast, by Application 2019 & 2032
- Table 34: GCC Public Safety LTE Networks and Devices Revenue (million) Forecast, by Application 2019 & 2032
- Table 35: North Africa Public Safety LTE Networks and Devices Revenue (million) Forecast, by Application 2019 & 2032
- Table 36: South Africa Public Safety LTE Networks and Devices Revenue (million) Forecast, by Application 2019 & 2032
- Table 37: Rest of Middle East & Africa Public Safety LTE Networks and Devices Revenue (million) Forecast, by Application 2019 & 2032
- Table 38: Global Public Safety LTE Networks and Devices Revenue million Forecast, by Application 2019 & 2032
- Table 39: Global Public Safety LTE Networks and Devices Revenue million Forecast, by Types 2019 & 2032
- Table 40: Global Public Safety LTE Networks and Devices Revenue million Forecast, by Country 2019 & 2032
- Table 41: China Public Safety LTE Networks and Devices Revenue (million) Forecast, by Application 2019 & 2032
- Table 42: India Public Safety LTE Networks and Devices Revenue (million) Forecast, by Application 2019 & 2032
- Table 43: Japan Public Safety LTE Networks and Devices Revenue (million) Forecast, by Application 2019 & 2032
- Table 44: South Korea Public Safety LTE Networks and Devices Revenue (million) Forecast, by Application 2019 & 2032
- Table 45: ASEAN Public Safety LTE Networks and Devices Revenue (million) Forecast, by Application 2019 & 2032
- Table 46: Oceania Public Safety LTE Networks and Devices Revenue (million) Forecast, by Application 2019 & 2032
- Table 47: Rest of Asia Pacific Public Safety LTE Networks and Devices Revenue (million) Forecast, by Application 2019 & 2032
Frequently Asked Questions
1. What is the projected Compound Annual Growth Rate (CAGR) of the Public Safety LTE Networks and Devices?
The projected CAGR is approximately XX%.
2. Which companies are prominent players in the Public Safety LTE Networks and Devices?
Key companies in the market include General Dynamics Mission Systems, Inc., Airbus SE, Motorola Solutions, Inc., Ericsson, AT&T, Inc., Bittium Corporation, Mentura Group Oy, Cisco Systems, Leonardo, Hytera, Huawei, Samsung Electronics, Harris, Bittium, Airspan, ZTE, KT.
3. What are the main segments of the Public Safety LTE Networks and Devices?
The market segments include Application, Types.
4. Can you provide details about the market size?
The market size is estimated to be USD XXX million as of 2022.
5. What are some drivers contributing to market growth?
N/A
6. What are the notable trends driving market growth?
N/A
7. Are there any restraints impacting market growth?
N/A
8. Can you provide examples of recent developments in the market?
N/A
9. What pricing options are available for accessing the report?
Pricing options include single-user, multi-user, and enterprise licenses priced at USD 5600.00, USD 8400.00, and USD 11200.00 respectively.
10. Is the market size provided in terms of value or volume?
The market size is provided in terms of value, measured in million.
11. Are there any specific market keywords associated with the report?
Yes, the market keyword associated with the report is "Public Safety LTE Networks and Devices," which aids in identifying and referencing the specific market segment covered.
12. How do I determine which pricing option suits my needs best?
The pricing options vary based on user requirements and access needs. Individual users may opt for single-user licenses, while businesses requiring broader access may choose multi-user or enterprise licenses for cost-effective access to the report.
13. Are there any additional resources or data provided in the Public Safety LTE Networks and Devices report?
While the report offers comprehensive insights, it's advisable to review the specific contents or supplementary materials provided to ascertain if additional resources or data are available.
14. How can I stay updated on further developments or reports in the Public Safety LTE Networks and Devices?
To stay informed about further developments, trends, and reports in the Public Safety LTE Networks and Devices, consider subscribing to industry newsletters, following relevant companies and organizations, or regularly checking reputable industry news sources and publications.
Methodology
Step 1 - Identification of Relevant Samples Size from Population Database


Step 2 - Approaches for Defining Global Market Size (Value, Volume* & Price*)

Note*: In applicable scenarios
Step 3 - Data Sources
Primary Research
- Web Analytics
- Survey Reports
- Research Institute
- Latest Research Reports
- Opinion Leaders
Secondary Research
- Annual Reports
- White Paper
- Latest Press Release
- Industry Association
- Paid Database
- Investor Presentations

Step 4 - Data Triangulation
Involves using different sources of information in order to increase the validity of a study
These sources are likely to be stakeholders in a program - participants, other researchers, program staff, other community members, and so on.
Then we put all data in single framework & apply various statistical tools to find out the dynamic on the market.
During the analysis stage, feedback from the stakeholder groups would be compared to determine areas of agreement as well as areas of divergence


