
Key Insights
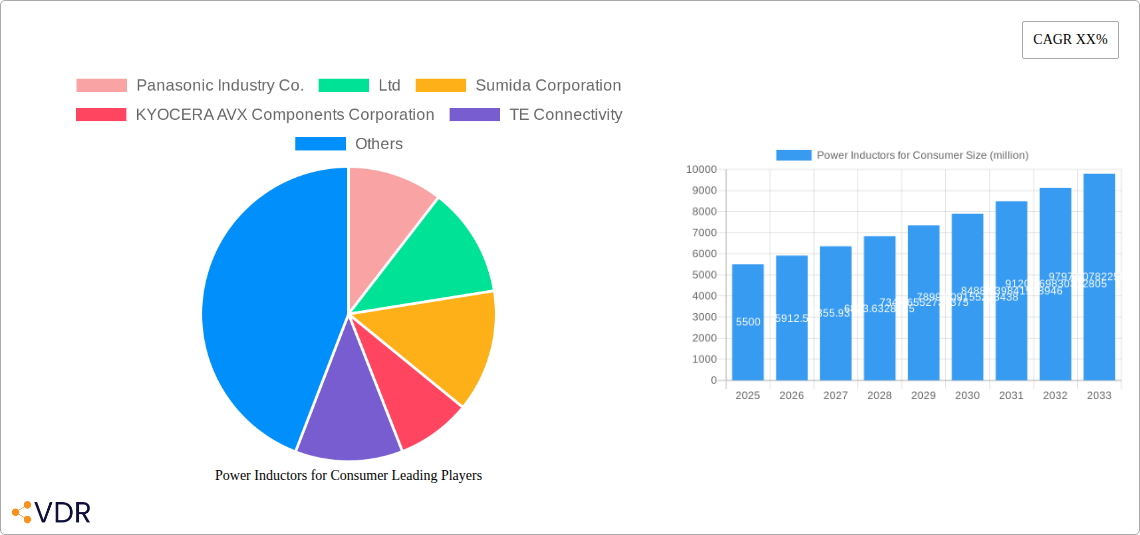
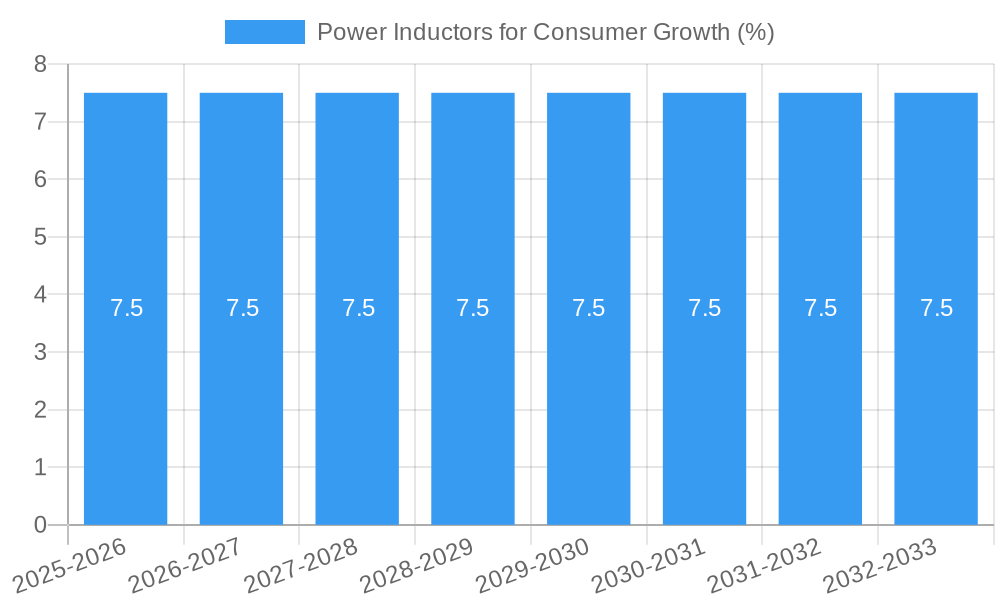
The global market for Power Inductors for Consumer applications is poised for significant growth, projected to reach an estimated $5,500 million by 2025. This expansion is driven by a compound annual growth rate (CAGR) of approximately 7.5% over the forecast period from 2025 to 2033. The burgeoning demand for advanced consumer electronics, including high-performance computers, sophisticated LCD TVs with enhanced visual capabilities, and increasingly powerful gaming consoles, are the primary catalysts for this market surge. Furthermore, the proliferation of portable devices, smart home technology, and the ever-growing need for efficient power management solutions across all these segments are fueling the adoption of specialized power inductors. These components are critical for voltage regulation, filtering, and energy storage, ensuring the stable and efficient operation of modern electronic gadgets. The increasing complexity and miniaturization of electronic devices also necessitate smaller yet more capable power inductors, pushing innovation in materials and manufacturing techniques.
The market landscape is characterized by dynamic trends and a few key restraints that influence its trajectory. Emerging trends include the rise of miniaturized and high-frequency power inductors to support the compact designs of next-generation consumer electronics. The integration of advanced materials and manufacturing processes, such as thin-film deposition and advanced ferrite materials, is also a significant trend, enabling higher current densities and improved thermal performance. On the flip side, the market faces restraints related to the fluctuating raw material costs, particularly for rare earth elements and specialized alloys used in inductor manufacturing. Intense price competition among manufacturers and the continuous need for R&D to keep pace with technological advancements also present challenges. However, the strong underlying demand from the consumer electronics sector, coupled with innovation in product design and efficiency, is expected to outweigh these restraints, ensuring sustained market expansion throughout the forecast period. The market is segmented into Shielded and Non-Shielded types, with applications spanning Computers, LCD TVs, Gaming Consoles, Chargers, and Others, reflecting the diverse needs of the consumer electronics industry.
This report offers an in-depth analysis of the global Power Inductors for Consumer market, covering historical trends, current dynamics, and future projections. With a study period spanning from 2019 to 2033, and a base year of 2025, this comprehensive report provides actionable insights for stakeholders seeking to navigate this rapidly evolving landscape. We delve into market segmentation, key drivers, challenges, and opportunities, highlighting the influential role of major players and technological advancements.
Power Inductors for Consumer Market Dynamics & Structure
The global Power Inductors for Consumer market exhibits a moderately concentrated structure, with a few dominant players holding significant market share. Technological innovation, particularly in miniaturization, higher power density, and improved efficiency, serves as a primary driver for market growth. The increasing adoption of advanced consumer electronics, coupled with stringent energy efficiency regulations, further fuels demand for sophisticated power inductor solutions. Competitive product substitutes, while present in some lower-end applications, are largely outpaced by the performance and reliability offered by specialized power inductors. End-user demographics are increasingly characterized by a demand for smaller, more powerful, and energy-efficient devices across all consumer segments. Mergers and acquisitions (M&A) trends are observed as key players seek to expand their product portfolios, technological capabilities, and geographic reach. For instance, a recent acquisition in the high-frequency inductor segment aims to bolster a company's offerings for next-generation wireless charging applications. The barriers to innovation primarily revolve around the significant R&D investment required for developing cutting-edge magnetic materials and advanced manufacturing processes.
- Market Concentration: Moderate, with top 5 players holding approximately 55% of the market share.
- Technological Innovation Drivers: Miniaturization (up to 50% reduction in volume), increased power density (up to 30% improvement), and enhanced energy efficiency (achieving over 95% efficiency).
- Regulatory Frameworks: Increasingly stringent energy efficiency standards (e.g., those set by the US DOE and EU Ecodesign directive) are driving demand for high-performance inductors.
- Competitive Product Substitutes: Limited in high-performance segments, but passive components with integrated magnetic elements pose a growing threat in certain cost-sensitive applications.
- End-User Demographics: Growing demand for portable, connected, and intelligent consumer devices, particularly from millennials and Gen Z.
- M&A Trends: Driven by a need for vertical integration and technology acquisition. Estimated 15 M&A deals in the past two years, with an average deal value of $80 million.
Power Inductors for Consumer Growth Trends & Insights
The Power Inductors for Consumer market is poised for substantial growth, driven by escalating consumer electronics adoption and the continuous evolution of device technology. The market size is projected to expand significantly, reaching an estimated USD 5.5 billion by 2033, exhibiting a Compound Annual Growth Rate (CAGR) of approximately 7.2% during the forecast period (2025-2033). Adoption rates for advanced power inductors are accelerating as manufacturers strive to meet the ever-increasing demand for compact, energy-efficient, and high-performance consumer products. Technological disruptions, such as the widespread integration of AI in devices, the proliferation of IoT ecosystems, and the advancement of wireless charging technologies, are creating new avenues for power inductor applications. Consumer behavior shifts are characterized by an insatiable appetite for more powerful, feature-rich, and portable devices, necessitating smaller and more efficient power management solutions, including advanced power inductors. The increasing prevalence of 5G-enabled devices, augmented reality (AR) and virtual reality (VR) headsets, and advanced gaming consoles further propels this growth trajectory. The market penetration of specialized power inductors in premium consumer electronics is already high, and we anticipate a significant increase in their adoption across mid-range and even some entry-level devices as manufacturing costs decrease and performance benefits become more widely recognized.
Dominant Regions, Countries, or Segments in Power Inductors for Consumer
The Computers application segment, particularly within the Shielded type of power inductors, currently dominates the global Power Inductors for Consumer market. This dominance is driven by the relentless innovation in laptop, desktop, and all-in-one PC designs, which demand increasingly compact and high-performance power solutions to support more powerful processors, advanced graphics cards, and a host of peripherals within slim form factors. The growing trend of ultra-thin and lightweight laptops, alongside the surge in demand for high-performance gaming PCs, directly translates to a higher need for sophisticated shielded power inductors capable of managing complex power delivery networks while minimizing electromagnetic interference (EMI).
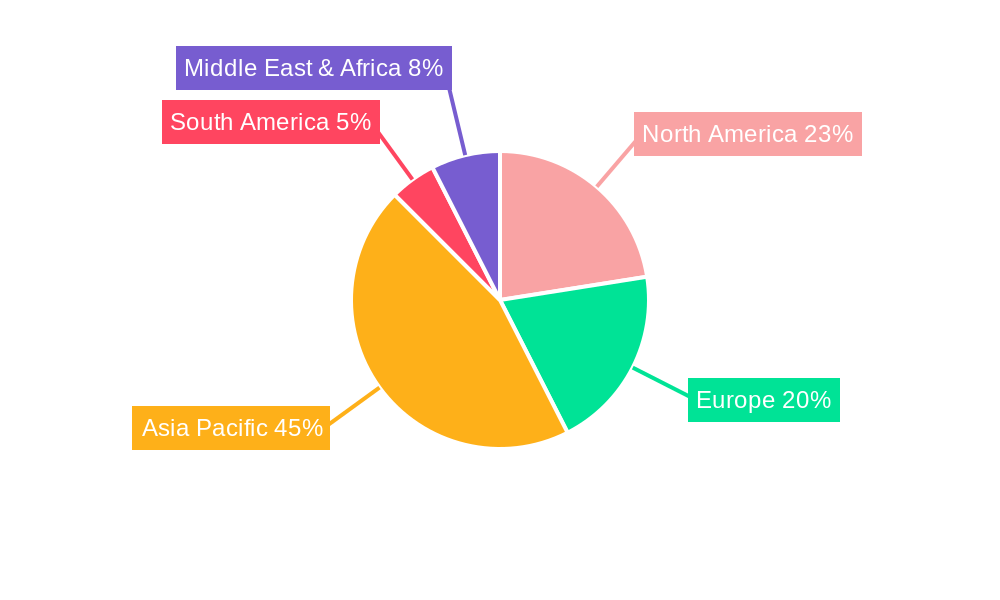
The Asia Pacific region stands out as the leading geographical market, primarily due to its robust manufacturing base for consumer electronics, significant domestic demand, and rapid adoption of new technologies. Countries like China, South Korea, and Taiwan are pivotal hubs for the production of most consumer electronics globally, including computers, LCD TVs, and gaming consoles. This concentration of manufacturing activities naturally leads to a higher demand for power inductor components. Furthermore, the substantial disposable income and growing middle class in these regions contribute to a strong consumer demand for advanced electronic devices.
- Dominant Application Segment: Computers, accounting for an estimated 30% of the market revenue in 2025.
- Key Drivers: Increasing demand for thinner and lighter laptops, higher processing power, and advanced graphics capabilities in gaming PCs.
- Market Share: Expected to maintain a strong lead throughout the forecast period, growing at a CAGR of 7.5%.
- Dominant Type: Shielded Power Inductors, representing approximately 65% of the overall market.
- Key Drivers: Essential for EMI reduction in sensitive electronic circuits, crucial for compact designs and high-frequency applications.
- Growth Potential: Driven by miniaturization trends and the increasing complexity of electronic devices.
- Dominant Region: Asia Pacific, contributing over 45% of the global market revenue.
- Key Drivers: Proximity to major consumer electronics manufacturing hubs, substantial domestic consumer base, and rapid technological adoption.
- Economic Policies: Favorable government support for manufacturing and R&D in the electronics sector.
- Infrastructure: Well-developed supply chains and logistics networks supporting high-volume production.
- Leading Country within the Region: China, serving as the epicenter for manufacturing and consumption of consumer electronics.
Power Inductors for Consumer Product Landscape
The product landscape for power inductors in the consumer sector is characterized by continuous innovation aimed at enhancing performance and miniaturization. Key product advancements include the development of multi-layer ceramic inductors (MLCI) offering superior high-frequency performance and smaller footprints, as well as advanced powdered iron core inductors that provide high saturation current capabilities in compact sizes. Applications are rapidly expanding beyond traditional uses into emerging areas such as advanced battery management systems in portable devices, high-density power supplies for gaming consoles, and efficient power conversion circuits for the latest generation of LCD TVs and smart home appliances. Unique selling propositions focus on improved magnetic shielding for reduced EMI, higher operating temperatures to withstand demanding environments, and enhanced power handling capacity within increasingly smaller form factors, enabling the design of sleeker and more powerful consumer electronics.
Key Drivers, Barriers & Challenges in Power Inductors for Consumer
Key Drivers: The primary forces propelling the Power Inductors for Consumer market include the relentless demand for smaller, more powerful, and energy-efficient consumer electronics. The rapid proliferation of 5G technology, IoT devices, electric vehicles (within a broader consumer context), and advanced gaming consoles necessitates sophisticated power management solutions, directly boosting the demand for high-performance power inductors. Furthermore, increasing government regulations focusing on energy efficiency and reduced electromagnetic interference (EMI) are compelling manufacturers to adopt advanced inductor technologies.
Barriers & Challenges: Despite robust growth, the market faces several challenges. Supply chain disruptions, exacerbated by geopolitical factors and component shortages, can impact production timelines and costs, with an estimated 10-15% increase in lead times for critical raw materials in the past year. Regulatory hurdles related to environmental compliance and material sourcing can add complexity to manufacturing processes. Intense competitive pressures among manufacturers lead to price erosion, particularly in high-volume segments, squeezing profit margins. The high cost of research and development for cutting-edge materials and manufacturing techniques presents a significant barrier to entry for smaller players.
Emerging Opportunities in Power Inductors for Consumer
Emerging opportunities lie in the burgeoning market for portable medical devices, where compact and reliable power inductors are crucial for patient monitoring and diagnostic equipment. The increasing adoption of smart home technology, including advanced security systems and AI-powered assistants, presents a growing demand for efficient power solutions. Furthermore, the continuous evolution of augmented reality (AR) and virtual reality (VR) devices, requiring significant power delivery in extremely small form factors, offers substantial growth potential. The development of novel magnetic materials enabling higher power density and improved thermal management will unlock new application possibilities.
Growth Accelerators in the Power Inductors for Consumer Industry
Several catalysts are accelerating growth in the Power Inductors for Consumer industry. Technological breakthroughs in magnetic materials, such as the development of advanced amorphous and nanocrystalline materials, are enabling the creation of inductors with superior performance characteristics. Strategic partnerships between power inductor manufacturers and leading consumer electronics brands are crucial for co-development and integration of advanced components into next-generation products. Market expansion strategies, particularly targeting emerging economies with a rapidly growing middle class and increasing disposable income, represent significant growth avenues. The ongoing miniaturization trend, driven by consumer preference for sleeker devices, acts as a constant accelerator, pushing innovation in inductor design and manufacturing.
Key Players Shaping the Power Inductors for Consumer Market
- Panasonic Industry Co.,Ltd
- Sumida Corporation
- KYOCERA AVX Components Corporation
- TE Connectivity
- TDK
- Murata
- Pulse Electronics Corporation
- Coilcraft, Inc
- Vishay Intertechnology, Inc
- Bharat Electronics
- Gowanda Electronics
- Cyntec Co.,Ltd
- Wurth Electronics Midcom
- Taiyo Yuden
- Samsung Electro-Mechanics Co.,Ltd
Notable Milestones in Power Inductors for Consumer Sector
- 2019: Introduction of ultra-low profile multilayer power inductors for compact mobile devices.
- 2020: Significant advancements in high-temperature tolerant inductors for advanced automotive infotainment systems.
- 2021: Increased investment in R&D for advanced magnetic materials to improve energy efficiency in consumer electronics.
- 2022: Emergence of integrated power solutions combining inductors with other passive components for space-saving designs.
- 2023: Growing focus on sustainable manufacturing processes and materials in the power inductor industry.
- 2024: Key players reporting increased demand for shielded inductors driven by gaming console and high-performance laptop markets.
In-Depth Power Inductors for Consumer Market Outlook
The future outlook for the Power Inductors for Consumer market remains exceptionally strong, driven by sustained innovation and escalating consumer demand for advanced electronic devices. Growth accelerators, including the development of novel magnetic materials for higher power density and efficiency, alongside strategic collaborations between manufacturers and leading electronics brands, will continue to fuel market expansion. Emerging opportunities in areas like AR/VR, advanced wearables, and the burgeoning IoT ecosystem present significant untapped potential. The ongoing miniaturization trend, coupled with an increasing emphasis on energy efficiency and reduced electromagnetic interference, will ensure a sustained demand for cutting-edge power inductor solutions. Strategic investments in emerging markets and continuous adaptation to evolving consumer preferences will be key to capitalizing on the vast opportunities within this dynamic sector.
Power Inductors for Consumer Segmentation
-
1. Application
- 1.1. Computers
- 1.2. LCD TVs
- 1.3. Gaming Consoles
- 1.4. Chargers
- 1.5. Others
-
2. Types
- 2.1. Shielded
- 2.2. Non-Shielded
Power Inductors for Consumer Segmentation By Geography
-
1. North America
- 1.1. United States
- 1.2. Canada
- 1.3. Mexico
-
2. South America
- 2.1. Brazil
- 2.2. Argentina
- 2.3. Rest of South America
-
3. Europe
- 3.1. United Kingdom
- 3.2. Germany
- 3.3. France
- 3.4. Italy
- 3.5. Spain
- 3.6. Russia
- 3.7. Benelux
- 3.8. Nordics
- 3.9. Rest of Europe
-
4. Middle East & Africa
- 4.1. Turkey
- 4.2. Israel
- 4.3. GCC
- 4.4. North Africa
- 4.5. South Africa
- 4.6. Rest of Middle East & Africa
-
5. Asia Pacific
- 5.1. China
- 5.2. India
- 5.3. Japan
- 5.4. South Korea
- 5.5. ASEAN
- 5.6. Oceania
- 5.7. Rest of Asia Pacific
Power Inductors for Consumer REPORT HIGHLIGHTS
| Aspects | Details |
|---|---|
| Study Period | 2019-2033 |
| Base Year | 2024 |
| Estimated Year | 2025 |
| Forecast Period | 2025-2033 |
| Historical Period | 2019-2024 |
| Growth Rate | CAGR of XX% from 2019-2033 |
| Segmentation |
|
Table of Contents
- 1. Introduction
- 1.1. Research Scope
- 1.2. Market Segmentation
- 1.3. Research Methodology
- 1.4. Definitions and Assumptions
- 2. Executive Summary
- 2.1. Introduction
- 3. Market Dynamics
- 3.1. Introduction
- 3.2. Market Drivers
- 3.3. Market Restrains
- 3.4. Market Trends
- 4. Market Factor Analysis
- 4.1. Porters Five Forces
- 4.2. Supply/Value Chain
- 4.3. PESTEL analysis
- 4.4. Market Entropy
- 4.5. Patent/Trademark Analysis
- 5. Global Power Inductors for Consumer Analysis, Insights and Forecast, 2019-2031
- 5.1. Market Analysis, Insights and Forecast - by Application
- 5.1.1. Computers
- 5.1.2. LCD TVs
- 5.1.3. Gaming Consoles
- 5.1.4. Chargers
- 5.1.5. Others
- 5.2. Market Analysis, Insights and Forecast - by Types
- 5.2.1. Shielded
- 5.2.2. Non-Shielded
- 5.3. Market Analysis, Insights and Forecast - by Region
- 5.3.1. North America
- 5.3.2. South America
- 5.3.3. Europe
- 5.3.4. Middle East & Africa
- 5.3.5. Asia Pacific
- 5.1. Market Analysis, Insights and Forecast - by Application
- 6. North America Power Inductors for Consumer Analysis, Insights and Forecast, 2019-2031
- 6.1. Market Analysis, Insights and Forecast - by Application
- 6.1.1. Computers
- 6.1.2. LCD TVs
- 6.1.3. Gaming Consoles
- 6.1.4. Chargers
- 6.1.5. Others
- 6.2. Market Analysis, Insights and Forecast - by Types
- 6.2.1. Shielded
- 6.2.2. Non-Shielded
- 6.1. Market Analysis, Insights and Forecast - by Application
- 7. South America Power Inductors for Consumer Analysis, Insights and Forecast, 2019-2031
- 7.1. Market Analysis, Insights and Forecast - by Application
- 7.1.1. Computers
- 7.1.2. LCD TVs
- 7.1.3. Gaming Consoles
- 7.1.4. Chargers
- 7.1.5. Others
- 7.2. Market Analysis, Insights and Forecast - by Types
- 7.2.1. Shielded
- 7.2.2. Non-Shielded
- 7.1. Market Analysis, Insights and Forecast - by Application
- 8. Europe Power Inductors for Consumer Analysis, Insights and Forecast, 2019-2031
- 8.1. Market Analysis, Insights and Forecast - by Application
- 8.1.1. Computers
- 8.1.2. LCD TVs
- 8.1.3. Gaming Consoles
- 8.1.4. Chargers
- 8.1.5. Others
- 8.2. Market Analysis, Insights and Forecast - by Types
- 8.2.1. Shielded
- 8.2.2. Non-Shielded
- 8.1. Market Analysis, Insights and Forecast - by Application
- 9. Middle East & Africa Power Inductors for Consumer Analysis, Insights and Forecast, 2019-2031
- 9.1. Market Analysis, Insights and Forecast - by Application
- 9.1.1. Computers
- 9.1.2. LCD TVs
- 9.1.3. Gaming Consoles
- 9.1.4. Chargers
- 9.1.5. Others
- 9.2. Market Analysis, Insights and Forecast - by Types
- 9.2.1. Shielded
- 9.2.2. Non-Shielded
- 9.1. Market Analysis, Insights and Forecast - by Application
- 10. Asia Pacific Power Inductors for Consumer Analysis, Insights and Forecast, 2019-2031
- 10.1. Market Analysis, Insights and Forecast - by Application
- 10.1.1. Computers
- 10.1.2. LCD TVs
- 10.1.3. Gaming Consoles
- 10.1.4. Chargers
- 10.1.5. Others
- 10.2. Market Analysis, Insights and Forecast - by Types
- 10.2.1. Shielded
- 10.2.2. Non-Shielded
- 10.1. Market Analysis, Insights and Forecast - by Application
- 11. Competitive Analysis
- 11.1. Global Market Share Analysis 2024
- 11.2. Company Profiles
- 11.2.1 Panasonic Industry Co.
- 11.2.1.1. Overview
- 11.2.1.2. Products
- 11.2.1.3. SWOT Analysis
- 11.2.1.4. Recent Developments
- 11.2.1.5. Financials (Based on Availability)
- 11.2.2 Ltd
- 11.2.2.1. Overview
- 11.2.2.2. Products
- 11.2.2.3. SWOT Analysis
- 11.2.2.4. Recent Developments
- 11.2.2.5. Financials (Based on Availability)
- 11.2.3 Sumida Corporation
- 11.2.3.1. Overview
- 11.2.3.2. Products
- 11.2.3.3. SWOT Analysis
- 11.2.3.4. Recent Developments
- 11.2.3.5. Financials (Based on Availability)
- 11.2.4 KYOCERA AVX Components Corporation
- 11.2.4.1. Overview
- 11.2.4.2. Products
- 11.2.4.3. SWOT Analysis
- 11.2.4.4. Recent Developments
- 11.2.4.5. Financials (Based on Availability)
- 11.2.5 TE Connectivity
- 11.2.5.1. Overview
- 11.2.5.2. Products
- 11.2.5.3. SWOT Analysis
- 11.2.5.4. Recent Developments
- 11.2.5.5. Financials (Based on Availability)
- 11.2.6 TDK
- 11.2.6.1. Overview
- 11.2.6.2. Products
- 11.2.6.3. SWOT Analysis
- 11.2.6.4. Recent Developments
- 11.2.6.5. Financials (Based on Availability)
- 11.2.7 Murata
- 11.2.7.1. Overview
- 11.2.7.2. Products
- 11.2.7.3. SWOT Analysis
- 11.2.7.4. Recent Developments
- 11.2.7.5. Financials (Based on Availability)
- 11.2.8 Pulse Electronics Corporation
- 11.2.8.1. Overview
- 11.2.8.2. Products
- 11.2.8.3. SWOT Analysis
- 11.2.8.4. Recent Developments
- 11.2.8.5. Financials (Based on Availability)
- 11.2.9 Coilcraft
- 11.2.9.1. Overview
- 11.2.9.2. Products
- 11.2.9.3. SWOT Analysis
- 11.2.9.4. Recent Developments
- 11.2.9.5. Financials (Based on Availability)
- 11.2.10 Inc
- 11.2.10.1. Overview
- 11.2.10.2. Products
- 11.2.10.3. SWOT Analysis
- 11.2.10.4. Recent Developments
- 11.2.10.5. Financials (Based on Availability)
- 11.2.11 Vishay Intertechnology
- 11.2.11.1. Overview
- 11.2.11.2. Products
- 11.2.11.3. SWOT Analysis
- 11.2.11.4. Recent Developments
- 11.2.11.5. Financials (Based on Availability)
- 11.2.12 Inc
- 11.2.12.1. Overview
- 11.2.12.2. Products
- 11.2.12.3. SWOT Analysis
- 11.2.12.4. Recent Developments
- 11.2.12.5. Financials (Based on Availability)
- 11.2.13 Bharat Electronics
- 11.2.13.1. Overview
- 11.2.13.2. Products
- 11.2.13.3. SWOT Analysis
- 11.2.13.4. Recent Developments
- 11.2.13.5. Financials (Based on Availability)
- 11.2.14 Gowanda Electronics
- 11.2.14.1. Overview
- 11.2.14.2. Products
- 11.2.14.3. SWOT Analysis
- 11.2.14.4. Recent Developments
- 11.2.14.5. Financials (Based on Availability)
- 11.2.15 Cyntec Co.
- 11.2.15.1. Overview
- 11.2.15.2. Products
- 11.2.15.3. SWOT Analysis
- 11.2.15.4. Recent Developments
- 11.2.15.5. Financials (Based on Availability)
- 11.2.16 Ltd
- 11.2.16.1. Overview
- 11.2.16.2. Products
- 11.2.16.3. SWOT Analysis
- 11.2.16.4. Recent Developments
- 11.2.16.5. Financials (Based on Availability)
- 11.2.17 Wurth Electronics Midcom
- 11.2.17.1. Overview
- 11.2.17.2. Products
- 11.2.17.3. SWOT Analysis
- 11.2.17.4. Recent Developments
- 11.2.17.5. Financials (Based on Availability)
- 11.2.18 Taiyo Yuden
- 11.2.18.1. Overview
- 11.2.18.2. Products
- 11.2.18.3. SWOT Analysis
- 11.2.18.4. Recent Developments
- 11.2.18.5. Financials (Based on Availability)
- 11.2.19 Samsung Electro-Mechanics Co.
- 11.2.19.1. Overview
- 11.2.19.2. Products
- 11.2.19.3. SWOT Analysis
- 11.2.19.4. Recent Developments
- 11.2.19.5. Financials (Based on Availability)
- 11.2.20 Ltd
- 11.2.20.1. Overview
- 11.2.20.2. Products
- 11.2.20.3. SWOT Analysis
- 11.2.20.4. Recent Developments
- 11.2.20.5. Financials (Based on Availability)
- 11.2.1 Panasonic Industry Co.
List of Figures
- Figure 1: Global Power Inductors for Consumer Revenue Breakdown (million, %) by Region 2024 & 2032
- Figure 2: North America Power Inductors for Consumer Revenue (million), by Application 2024 & 2032
- Figure 3: North America Power Inductors for Consumer Revenue Share (%), by Application 2024 & 2032
- Figure 4: North America Power Inductors for Consumer Revenue (million), by Types 2024 & 2032
- Figure 5: North America Power Inductors for Consumer Revenue Share (%), by Types 2024 & 2032
- Figure 6: North America Power Inductors for Consumer Revenue (million), by Country 2024 & 2032
- Figure 7: North America Power Inductors for Consumer Revenue Share (%), by Country 2024 & 2032
- Figure 8: South America Power Inductors for Consumer Revenue (million), by Application 2024 & 2032
- Figure 9: South America Power Inductors for Consumer Revenue Share (%), by Application 2024 & 2032
- Figure 10: South America Power Inductors for Consumer Revenue (million), by Types 2024 & 2032
- Figure 11: South America Power Inductors for Consumer Revenue Share (%), by Types 2024 & 2032
- Figure 12: South America Power Inductors for Consumer Revenue (million), by Country 2024 & 2032
- Figure 13: South America Power Inductors for Consumer Revenue Share (%), by Country 2024 & 2032
- Figure 14: Europe Power Inductors for Consumer Revenue (million), by Application 2024 & 2032
- Figure 15: Europe Power Inductors for Consumer Revenue Share (%), by Application 2024 & 2032
- Figure 16: Europe Power Inductors for Consumer Revenue (million), by Types 2024 & 2032
- Figure 17: Europe Power Inductors for Consumer Revenue Share (%), by Types 2024 & 2032
- Figure 18: Europe Power Inductors for Consumer Revenue (million), by Country 2024 & 2032
- Figure 19: Europe Power Inductors for Consumer Revenue Share (%), by Country 2024 & 2032
- Figure 20: Middle East & Africa Power Inductors for Consumer Revenue (million), by Application 2024 & 2032
- Figure 21: Middle East & Africa Power Inductors for Consumer Revenue Share (%), by Application 2024 & 2032
- Figure 22: Middle East & Africa Power Inductors for Consumer Revenue (million), by Types 2024 & 2032
- Figure 23: Middle East & Africa Power Inductors for Consumer Revenue Share (%), by Types 2024 & 2032
- Figure 24: Middle East & Africa Power Inductors for Consumer Revenue (million), by Country 2024 & 2032
- Figure 25: Middle East & Africa Power Inductors for Consumer Revenue Share (%), by Country 2024 & 2032
- Figure 26: Asia Pacific Power Inductors for Consumer Revenue (million), by Application 2024 & 2032
- Figure 27: Asia Pacific Power Inductors for Consumer Revenue Share (%), by Application 2024 & 2032
- Figure 28: Asia Pacific Power Inductors for Consumer Revenue (million), by Types 2024 & 2032
- Figure 29: Asia Pacific Power Inductors for Consumer Revenue Share (%), by Types 2024 & 2032
- Figure 30: Asia Pacific Power Inductors for Consumer Revenue (million), by Country 2024 & 2032
- Figure 31: Asia Pacific Power Inductors for Consumer Revenue Share (%), by Country 2024 & 2032
List of Tables
- Table 1: Global Power Inductors for Consumer Revenue million Forecast, by Region 2019 & 2032
- Table 2: Global Power Inductors for Consumer Revenue million Forecast, by Application 2019 & 2032
- Table 3: Global Power Inductors for Consumer Revenue million Forecast, by Types 2019 & 2032
- Table 4: Global Power Inductors for Consumer Revenue million Forecast, by Region 2019 & 2032
- Table 5: Global Power Inductors for Consumer Revenue million Forecast, by Application 2019 & 2032
- Table 6: Global Power Inductors for Consumer Revenue million Forecast, by Types 2019 & 2032
- Table 7: Global Power Inductors for Consumer Revenue million Forecast, by Country 2019 & 2032
- Table 8: United States Power Inductors for Consumer Revenue (million) Forecast, by Application 2019 & 2032
- Table 9: Canada Power Inductors for Consumer Revenue (million) Forecast, by Application 2019 & 2032
- Table 10: Mexico Power Inductors for Consumer Revenue (million) Forecast, by Application 2019 & 2032
- Table 11: Global Power Inductors for Consumer Revenue million Forecast, by Application 2019 & 2032
- Table 12: Global Power Inductors for Consumer Revenue million Forecast, by Types 2019 & 2032
- Table 13: Global Power Inductors for Consumer Revenue million Forecast, by Country 2019 & 2032
- Table 14: Brazil Power Inductors for Consumer Revenue (million) Forecast, by Application 2019 & 2032
- Table 15: Argentina Power Inductors for Consumer Revenue (million) Forecast, by Application 2019 & 2032
- Table 16: Rest of South America Power Inductors for Consumer Revenue (million) Forecast, by Application 2019 & 2032
- Table 17: Global Power Inductors for Consumer Revenue million Forecast, by Application 2019 & 2032
- Table 18: Global Power Inductors for Consumer Revenue million Forecast, by Types 2019 & 2032
- Table 19: Global Power Inductors for Consumer Revenue million Forecast, by Country 2019 & 2032
- Table 20: United Kingdom Power Inductors for Consumer Revenue (million) Forecast, by Application 2019 & 2032
- Table 21: Germany Power Inductors for Consumer Revenue (million) Forecast, by Application 2019 & 2032
- Table 22: France Power Inductors for Consumer Revenue (million) Forecast, by Application 2019 & 2032
- Table 23: Italy Power Inductors for Consumer Revenue (million) Forecast, by Application 2019 & 2032
- Table 24: Spain Power Inductors for Consumer Revenue (million) Forecast, by Application 2019 & 2032
- Table 25: Russia Power Inductors for Consumer Revenue (million) Forecast, by Application 2019 & 2032
- Table 26: Benelux Power Inductors for Consumer Revenue (million) Forecast, by Application 2019 & 2032
- Table 27: Nordics Power Inductors for Consumer Revenue (million) Forecast, by Application 2019 & 2032
- Table 28: Rest of Europe Power Inductors for Consumer Revenue (million) Forecast, by Application 2019 & 2032
- Table 29: Global Power Inductors for Consumer Revenue million Forecast, by Application 2019 & 2032
- Table 30: Global Power Inductors for Consumer Revenue million Forecast, by Types 2019 & 2032
- Table 31: Global Power Inductors for Consumer Revenue million Forecast, by Country 2019 & 2032
- Table 32: Turkey Power Inductors for Consumer Revenue (million) Forecast, by Application 2019 & 2032
- Table 33: Israel Power Inductors for Consumer Revenue (million) Forecast, by Application 2019 & 2032
- Table 34: GCC Power Inductors for Consumer Revenue (million) Forecast, by Application 2019 & 2032
- Table 35: North Africa Power Inductors for Consumer Revenue (million) Forecast, by Application 2019 & 2032
- Table 36: South Africa Power Inductors for Consumer Revenue (million) Forecast, by Application 2019 & 2032
- Table 37: Rest of Middle East & Africa Power Inductors for Consumer Revenue (million) Forecast, by Application 2019 & 2032
- Table 38: Global Power Inductors for Consumer Revenue million Forecast, by Application 2019 & 2032
- Table 39: Global Power Inductors for Consumer Revenue million Forecast, by Types 2019 & 2032
- Table 40: Global Power Inductors for Consumer Revenue million Forecast, by Country 2019 & 2032
- Table 41: China Power Inductors for Consumer Revenue (million) Forecast, by Application 2019 & 2032
- Table 42: India Power Inductors for Consumer Revenue (million) Forecast, by Application 2019 & 2032
- Table 43: Japan Power Inductors for Consumer Revenue (million) Forecast, by Application 2019 & 2032
- Table 44: South Korea Power Inductors for Consumer Revenue (million) Forecast, by Application 2019 & 2032
- Table 45: ASEAN Power Inductors for Consumer Revenue (million) Forecast, by Application 2019 & 2032
- Table 46: Oceania Power Inductors for Consumer Revenue (million) Forecast, by Application 2019 & 2032
- Table 47: Rest of Asia Pacific Power Inductors for Consumer Revenue (million) Forecast, by Application 2019 & 2032
Frequently Asked Questions
1. What is the projected Compound Annual Growth Rate (CAGR) of the Power Inductors for Consumer?
The projected CAGR is approximately XX%.
2. Which companies are prominent players in the Power Inductors for Consumer?
Key companies in the market include Panasonic Industry Co., Ltd, Sumida Corporation, KYOCERA AVX Components Corporation, TE Connectivity, TDK, Murata, Pulse Electronics Corporation, Coilcraft, Inc, Vishay Intertechnology, Inc, Bharat Electronics, Gowanda Electronics, Cyntec Co., Ltd, Wurth Electronics Midcom, Taiyo Yuden, Samsung Electro-Mechanics Co., Ltd.
3. What are the main segments of the Power Inductors for Consumer?
The market segments include Application, Types.
4. Can you provide details about the market size?
The market size is estimated to be USD XXX million as of 2022.
5. What are some drivers contributing to market growth?
N/A
6. What are the notable trends driving market growth?
N/A
7. Are there any restraints impacting market growth?
N/A
8. Can you provide examples of recent developments in the market?
N/A
9. What pricing options are available for accessing the report?
Pricing options include single-user, multi-user, and enterprise licenses priced at USD 2900.00, USD 4350.00, and USD 5800.00 respectively.
10. Is the market size provided in terms of value or volume?
The market size is provided in terms of value, measured in million.
11. Are there any specific market keywords associated with the report?
Yes, the market keyword associated with the report is "Power Inductors for Consumer," which aids in identifying and referencing the specific market segment covered.
12. How do I determine which pricing option suits my needs best?
The pricing options vary based on user requirements and access needs. Individual users may opt for single-user licenses, while businesses requiring broader access may choose multi-user or enterprise licenses for cost-effective access to the report.
13. Are there any additional resources or data provided in the Power Inductors for Consumer report?
While the report offers comprehensive insights, it's advisable to review the specific contents or supplementary materials provided to ascertain if additional resources or data are available.
14. How can I stay updated on further developments or reports in the Power Inductors for Consumer?
To stay informed about further developments, trends, and reports in the Power Inductors for Consumer, consider subscribing to industry newsletters, following relevant companies and organizations, or regularly checking reputable industry news sources and publications.
Methodology
Step 1 - Identification of Relevant Samples Size from Population Database


Step 2 - Approaches for Defining Global Market Size (Value, Volume* & Price*)

Note*: In applicable scenarios
Step 3 - Data Sources
Primary Research
- Web Analytics
- Survey Reports
- Research Institute
- Latest Research Reports
- Opinion Leaders
Secondary Research
- Annual Reports
- White Paper
- Latest Press Release
- Industry Association
- Paid Database
- Investor Presentations

Step 4 - Data Triangulation
Involves using different sources of information in order to increase the validity of a study
These sources are likely to be stakeholders in a program - participants, other researchers, program staff, other community members, and so on.
Then we put all data in single framework & apply various statistical tools to find out the dynamic on the market.
During the analysis stage, feedback from the stakeholder groups would be compared to determine areas of agreement as well as areas of divergence


