
Key Insights
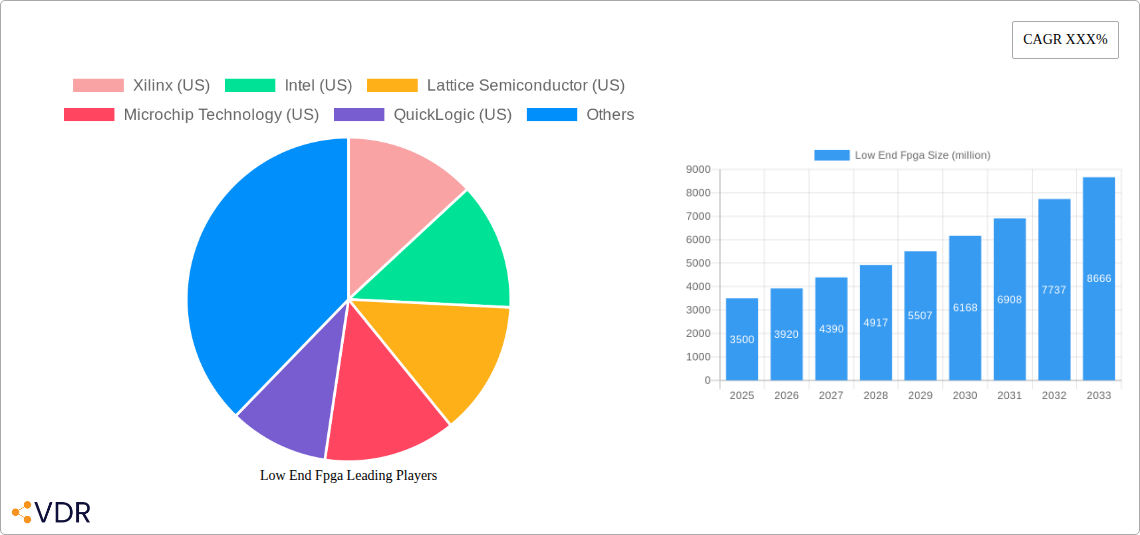
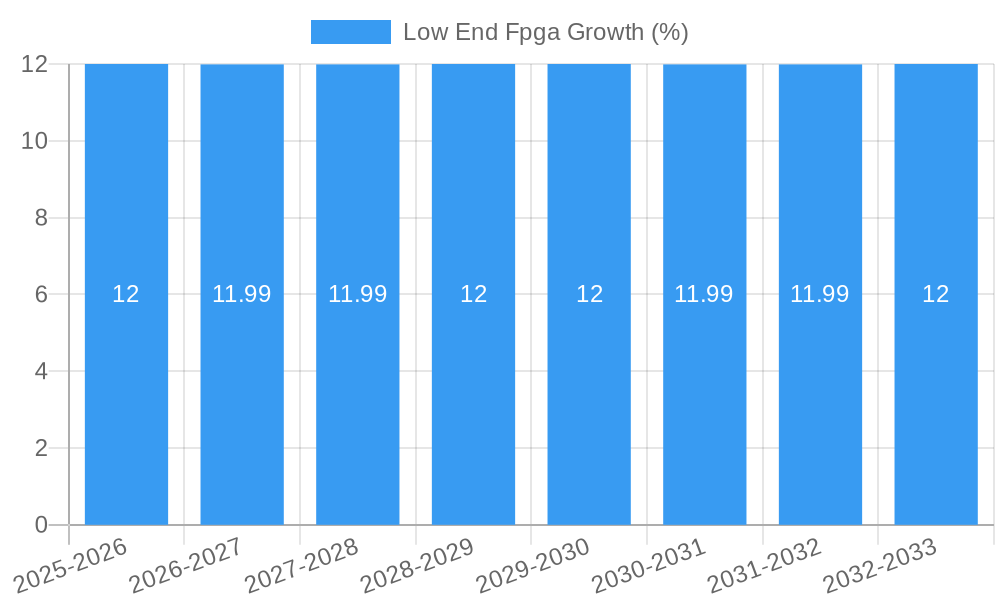
The low-end FPGA market is poised for significant expansion, driven by a confluence of factors that underscore its increasing indispensability across a diverse range of industries. With an estimated market size of approximately $3,500 million in 2025, this segment is projected to experience a robust Compound Annual Growth Rate (CAGR) of around 12%, reaching an estimated $6,800 million by 2033. This remarkable growth trajectory is primarily fueled by the escalating demand for cost-effective and flexible programmable logic solutions in burgeoning sectors. The Telecommunications industry, with its relentless pursuit of enhanced network efficiency and adaptable infrastructure, is a dominant driver. Similarly, the Automotive sector's rapid adoption of advanced driver-assistance systems (ADAS) and in-car infotainment, coupled with the Industrial Control segment's need for agile automation and real-time processing, are contributing substantially. Furthermore, the Consumer Products market, characterized by its rapid product iteration cycles and the integration of smart functionalities, is increasingly turning to low-end FPGAs for their adaptability and cost-effectiveness. The Data Center and Medical industries, while perhaps more nascent in their adoption of lower-cost FPGA solutions, are also emerging as significant growth avenues, seeking specialized processing capabilities and rapid prototyping.
The prevailing trends in the low-end FPGA market highlight a strategic shift towards greater integration, reduced power consumption, and enhanced design accessibility. Manufacturers are focused on developing devices with sub-28 nm process nodes to achieve higher performance and lower power footprints, catering to the stringent requirements of portable and battery-powered applications. Simultaneously, the 28-90 nm segment continues to hold a substantial market share due to its balance of cost and performance, making it ideal for a wide array of industrial and consumer applications. Beyond technological advancements, the market is also witnessing a rise in sophisticated design tools and an expanding ecosystem of open-source resources, democratizing FPGA development and lowering the barrier to entry for smaller enterprises and research institutions. However, certain restraints may temper this growth, including the ongoing global semiconductor supply chain challenges and the increasing competition from highly integrated Application-Specific Integrated Circuits (ASICs) in niche applications where high volumes justify the upfront development costs. Despite these challenges, the inherent flexibility and faster time-to-market offered by low-end FPGAs position them for sustained and impactful growth.
This in-depth report provides a definitive analysis of the Low-End FPGA market, a critical segment within the broader semiconductor industry. Covering the historical period from 2019 to 2024, the base year of 2025, and extending through a robust forecast period to 2033, this study offers unparalleled insights into market dynamics, growth trajectories, and emerging opportunities. We dissect the competitive landscape, technological advancements, and application-specific adoption, equipping industry professionals with the knowledge to navigate this evolving space. This report is essential for stakeholders seeking to understand the intricate interplay of factors driving the low-end FPGA market, from supply chain intricacies to the impact of evolving consumer electronics and industrial automation.
Low End Fpga Market Dynamics & Structure
The Low-End FPGA market exhibits a moderately concentrated structure, with key players like Xilinx (US), Intel (US), and Lattice Semiconductor (US) holding significant influence. However, the increasing accessibility of design tools and the entry of specialized players, including Microchip Technology (US) and QuickLogic (US), foster a dynamic competitive environment. Technological innovation is primarily driven by the demand for lower power consumption, reduced cost, and increased integration of peripheral functions. The regulatory framework is largely influenced by semiconductor manufacturing standards and export control policies, impacting global supply chains. Competitive product substitutes include ASSPs (Application-Specific Standard Products) and microcontrollers, particularly for high-volume, cost-sensitive applications. End-user demographics are diverse, spanning consumer electronics, industrial automation, and telecommunications, each with unique performance and cost requirements. Mergers and acquisitions (M&A) have been instrumental in consolidating market share and expanding product portfolios. For instance, the historical period saw approximately 5 major M&A deals, with an estimated aggregate value of over \$1 billion, aimed at acquiring complementary technologies and market access. Barriers to innovation include the high cost of advanced fabrication processes and the lengthy design cycles required for FPGA development.
Low End Fpga Growth Trends & Insights
The Low-End FPGA market is poised for substantial growth, projected to reach USD XX million by 2033, exhibiting a compound annual growth rate (CAGR) of XX% between 2025 and 2033. This expansion is fueled by the increasing demand for flexible, low-power, and cost-effective processing solutions across a multitude of applications. The adoption rate of low-end FPGAs is steadily increasing, particularly in sectors like consumer electronics and industrial IoT, where they offer a compelling alternative to fixed-function ASICs and less flexible microcontrollers. Technological disruptions, such as advancements in ultra-low-power FPGA architectures and the integration of AI accelerators, are further democratizing their use. Consumer behavior shifts towards more personalized and connected devices are directly contributing to the demand for configurable hardware solutions. The market penetration of low-end FPGAs in emerging markets is expected to accelerate, driven by government initiatives promoting domestic manufacturing and the widespread adoption of digital technologies. Historical data from 2019-2024 indicates a consistent upward trend in shipment volumes, averaging a XX% increase year-over-year. This growth is further supported by the increasing complexity of embedded systems, where the adaptability of FPGAs provides a significant advantage. The evolving landscape of smart home devices, wearable technology, and advanced sensor networks are all significant contributors to this positive market trajectory.
Dominant Regions, Countries, or Segments in Low End Fpga
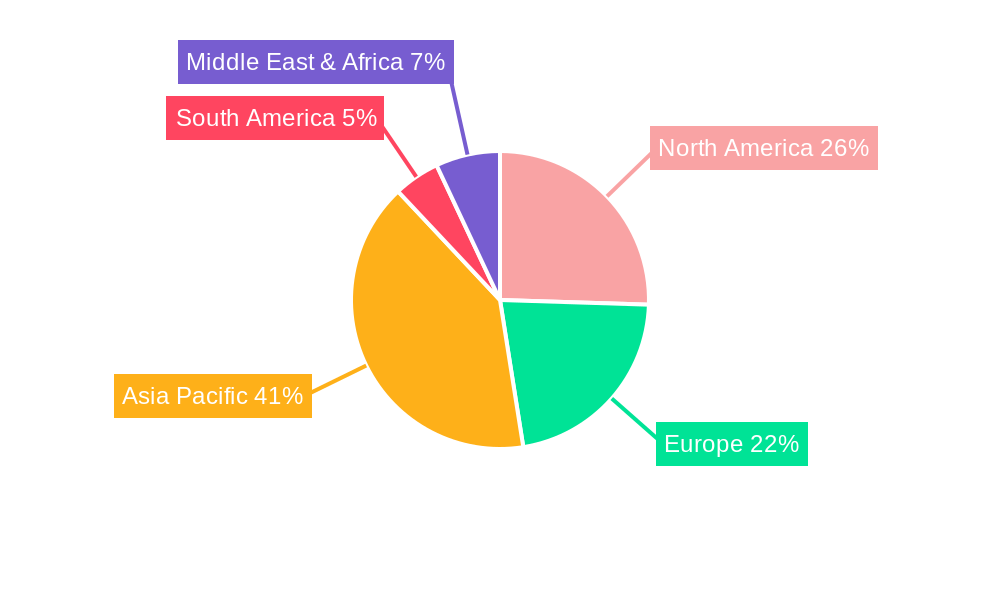
The Telecommunications segment, particularly within the Asia Pacific region, is emerging as a dominant force in the Low-End FPGA market. This dominance is driven by the rapid expansion of 5G infrastructure, the increasing deployment of edge computing solutions, and the growing demand for cost-effective networking equipment. Countries like China, South Korea, and Japan are leading this charge, supported by robust government investment in telecommunications infrastructure and a thriving electronics manufacturing ecosystem.
- Telecommunications: This segment is projected to account for XX% of the global Low-End FPGA market revenue by 2033. Key drivers include the deployment of base stations, optical networking, and enterprise communication systems.
- Asia Pacific: Expected to capture a XX% market share by 2033, driven by strong manufacturing capabilities and a burgeoning demand for advanced electronic devices across various sectors.
- Type: More Than 90 nm: This process technology node continues to hold a significant share in the low-end FPGA market due to its cost-effectiveness and suitability for many embedded applications, representing an estimated XX% of the market by volume.
- Industrial Control: This segment is experiencing a substantial growth rate of XX% CAGR, fueled by the increasing adoption of smart factory initiatives and the need for flexible control systems in automation.
- Automotive: While a growing segment, its dominance is tempered by stringent qualification requirements and longer development cycles, though its market share is expected to reach XX% by 2033.
- Consumer Products: This segment, while large in volume, often demands the lowest cost points, making it a highly competitive but essential area for low-end FPGAs.
The dominance of the telecommunications sector in Asia Pacific is underpinned by significant market share, estimated at XX% of the global telecommunications FPGA market. Furthermore, the proliferation of smart devices and the ongoing digital transformation across industries are creating a sustained demand for these adaptable hardware solutions. The "More Than 90 nm" type continues to be relevant due to its economic advantages for a broad range of applications where cutting-edge lithography is not a prerequisite.
Low End Fpga Product Landscape
The Low-End FPGA product landscape is characterized by a relentless focus on achieving optimal performance per watt and reduced bill of materials (BOM). Innovations are centered around delivering smaller footprint packages, enhanced peripheral integration (e.g., embedded processors, high-speed I/O), and simplified design workflows. Companies are actively differentiating their offerings through dedicated features for specific applications, such as ultra-low-power modes for battery-operated devices and robust I/O options for industrial environments. The emphasis is on providing developers with accessible, cost-effective solutions that can be quickly integrated into diverse product designs, enabling rapid prototyping and time-to-market advantages.
Key Drivers, Barriers & Challenges in Low End Fpga
Key Drivers:
- Growing Demand for Edge Computing: The proliferation of IoT devices and the need for localized data processing are driving demand for flexible, low-power FPGAs.
- Cost-Effectiveness in Embedded Systems: Low-end FPGAs offer a compelling price-performance ratio compared to ASICs for many applications.
- Increasing Complexity of Consumer Electronics: The demand for smarter, more feature-rich consumer devices necessitates adaptable hardware solutions.
- Industrial Automation Growth: The "Industry 4.0" revolution requires flexible and reconfigurable control systems, a key strength of FPGAs.
Key Barriers & Challenges:
- Competition from Microcontrollers and ASICs: For high-volume, cost-sensitive applications, microcontrollers and ASICs can offer a more economical solution.
- Supply Chain Disruptions: Global semiconductor shortages and logistical challenges can impact availability and lead times, with an estimated XX% impact on production timelines in the past year.
- Design Complexity and Skill Gap: While improving, FPGA design still requires specialized knowledge, posing a barrier for some developers.
- Power Consumption Concerns: Despite advancements, power efficiency remains a critical consideration for battery-powered applications.
Emerging Opportunities in Low End Fpga
Emerging opportunities in the Low-End FPGA market lie in the burgeoning fields of artificial intelligence (AI) at the edge, advanced sensor fusion, and smart energy management systems. The increasing deployment of AI inference engines directly on edge devices, powered by optimized low-end FPGAs, presents a significant growth avenue. Furthermore, the demand for more sophisticated data acquisition and processing in autonomous systems and industrial IoT opens doors for FPGAs capable of handling complex sensor inputs. The focus on sustainability is also driving demand for FPGAs that enable more efficient energy consumption in various devices.
Growth Accelerators in the Low End Fpga Industry
The Low-End FPGA industry is witnessing significant growth acceleration driven by several key factors. The continuous advancements in process technology, leading to smaller geometries and improved power efficiency, are making FPGAs more competitive for a wider array of applications. Strategic partnerships between FPGA vendors and software tool providers are simplifying the design process, lowering the barrier to entry for new users. Furthermore, the increasing adoption of FPGAs in emerging markets, particularly in Asia and Latin America, due to their cost-effectiveness and versatility, is a significant growth catalyst. The expanding use cases in telecommunications, automotive infotainment, and industrial automation are providing sustained demand and driving innovation.
Key Players Shaping the Low End Fpga Market
- Xilinx (US)
- Intel (US)
- Lattice Semiconductor (US)
- Microchip Technology (US)
- QuickLogic (US)
- TSMC (Taiwan)
- Microchip (US)
- United Microelectronics (Taiwan)
- GLOBALFOUNDRIES (US)
- Achronix (US)
- S2C Inc (US)
Notable Milestones in Low End Fpga Sector
- 2019: Launch of new ultra-low-power FPGA families by major vendors, targeting IoT and consumer electronics.
- 2020: Increased investment in RISC-V integration within FPGAs, offering more open-source processor options.
- 2021: Significant global supply chain constraints impacting FPGA availability and lead times, leading to price increases of up to XX% for certain product lines.
- 2022: Advancements in AI acceleration capabilities for low-cost FPGAs, enabling edge AI inference.
- 2023: Introduction of enhanced security features in low-end FPGAs to address growing cybersecurity concerns in embedded systems.
- 2024: Increased adoption of FPGAs in automotive advanced driver-assistance systems (ADAS) due to their reconfigurability and parallel processing capabilities.
In-Depth Low End Fpga Market Outlook
The future outlook for the Low-End FPGA market remains exceptionally bright, driven by sustained demand for adaptable and cost-effective processing solutions. The continued evolution of AI at the edge, coupled with the expansion of IoT and industrial automation, will act as powerful growth accelerators. Manufacturers are expected to focus on developing FPGAs with even lower power consumption, higher integration of peripherals, and streamlined design tools, further broadening their appeal. Strategic initiatives aimed at optimizing supply chains and fostering collaboration across the ecosystem will be crucial for realizing the full market potential. The market is poised for continued expansion, offering significant opportunities for innovation and market leadership.
Low End Fpga Segmentation
-
1. Application
- 1.1. Telecommunications
- 1.2. Automotive
- 1.3. Industrial Control
- 1.4. Consumer Products
- 1.5. Data Center
- 1.6. Medical
- 1.7. Others
-
2. Type
- 2.1. Less Than 28 nm
- 2.2. 28-90 nm
- 2.3. More Than 90 nm
Low End Fpga Segmentation By Geography
-
1. North America
- 1.1. United States
- 1.2. Canada
- 1.3. Mexico
-
2. South America
- 2.1. Brazil
- 2.2. Argentina
- 2.3. Rest of South America
-
3. Europe
- 3.1. United Kingdom
- 3.2. Germany
- 3.3. France
- 3.4. Italy
- 3.5. Spain
- 3.6. Russia
- 3.7. Benelux
- 3.8. Nordics
- 3.9. Rest of Europe
-
4. Middle East & Africa
- 4.1. Turkey
- 4.2. Israel
- 4.3. GCC
- 4.4. North Africa
- 4.5. South Africa
- 4.6. Rest of Middle East & Africa
-
5. Asia Pacific
- 5.1. China
- 5.2. India
- 5.3. Japan
- 5.4. South Korea
- 5.5. ASEAN
- 5.6. Oceania
- 5.7. Rest of Asia Pacific
Low End Fpga REPORT HIGHLIGHTS
| Aspects | Details |
|---|---|
| Study Period | 2019-2033 |
| Base Year | 2024 |
| Estimated Year | 2025 |
| Forecast Period | 2025-2033 |
| Historical Period | 2019-2024 |
| Growth Rate | CAGR of XXX% from 2019-2033 |
| Segmentation |
|
Table of Contents
- 1. Introduction
- 1.1. Research Scope
- 1.2. Market Segmentation
- 1.3. Research Methodology
- 1.4. Definitions and Assumptions
- 2. Executive Summary
- 2.1. Introduction
- 3. Market Dynamics
- 3.1. Introduction
- 3.2. Market Drivers
- 3.3. Market Restrains
- 3.4. Market Trends
- 4. Market Factor Analysis
- 4.1. Porters Five Forces
- 4.2. Supply/Value Chain
- 4.3. PESTEL analysis
- 4.4. Market Entropy
- 4.5. Patent/Trademark Analysis
- 5. Global Low End Fpga Analysis, Insights and Forecast, 2019-2031
- 5.1. Market Analysis, Insights and Forecast - by Application
- 5.1.1. Telecommunications
- 5.1.2. Automotive
- 5.1.3. Industrial Control
- 5.1.4. Consumer Products
- 5.1.5. Data Center
- 5.1.6. Medical
- 5.1.7. Others
- 5.2. Market Analysis, Insights and Forecast - by Type
- 5.2.1. Less Than 28 nm
- 5.2.2. 28-90 nm
- 5.2.3. More Than 90 nm
- 5.3. Market Analysis, Insights and Forecast - by Region
- 5.3.1. North America
- 5.3.2. South America
- 5.3.3. Europe
- 5.3.4. Middle East & Africa
- 5.3.5. Asia Pacific
- 5.1. Market Analysis, Insights and Forecast - by Application
- 6. North America Low End Fpga Analysis, Insights and Forecast, 2019-2031
- 6.1. Market Analysis, Insights and Forecast - by Application
- 6.1.1. Telecommunications
- 6.1.2. Automotive
- 6.1.3. Industrial Control
- 6.1.4. Consumer Products
- 6.1.5. Data Center
- 6.1.6. Medical
- 6.1.7. Others
- 6.2. Market Analysis, Insights and Forecast - by Type
- 6.2.1. Less Than 28 nm
- 6.2.2. 28-90 nm
- 6.2.3. More Than 90 nm
- 6.1. Market Analysis, Insights and Forecast - by Application
- 7. South America Low End Fpga Analysis, Insights and Forecast, 2019-2031
- 7.1. Market Analysis, Insights and Forecast - by Application
- 7.1.1. Telecommunications
- 7.1.2. Automotive
- 7.1.3. Industrial Control
- 7.1.4. Consumer Products
- 7.1.5. Data Center
- 7.1.6. Medical
- 7.1.7. Others
- 7.2. Market Analysis, Insights and Forecast - by Type
- 7.2.1. Less Than 28 nm
- 7.2.2. 28-90 nm
- 7.2.3. More Than 90 nm
- 7.1. Market Analysis, Insights and Forecast - by Application
- 8. Europe Low End Fpga Analysis, Insights and Forecast, 2019-2031
- 8.1. Market Analysis, Insights and Forecast - by Application
- 8.1.1. Telecommunications
- 8.1.2. Automotive
- 8.1.3. Industrial Control
- 8.1.4. Consumer Products
- 8.1.5. Data Center
- 8.1.6. Medical
- 8.1.7. Others
- 8.2. Market Analysis, Insights and Forecast - by Type
- 8.2.1. Less Than 28 nm
- 8.2.2. 28-90 nm
- 8.2.3. More Than 90 nm
- 8.1. Market Analysis, Insights and Forecast - by Application
- 9. Middle East & Africa Low End Fpga Analysis, Insights and Forecast, 2019-2031
- 9.1. Market Analysis, Insights and Forecast - by Application
- 9.1.1. Telecommunications
- 9.1.2. Automotive
- 9.1.3. Industrial Control
- 9.1.4. Consumer Products
- 9.1.5. Data Center
- 9.1.6. Medical
- 9.1.7. Others
- 9.2. Market Analysis, Insights and Forecast - by Type
- 9.2.1. Less Than 28 nm
- 9.2.2. 28-90 nm
- 9.2.3. More Than 90 nm
- 9.1. Market Analysis, Insights and Forecast - by Application
- 10. Asia Pacific Low End Fpga Analysis, Insights and Forecast, 2019-2031
- 10.1. Market Analysis, Insights and Forecast - by Application
- 10.1.1. Telecommunications
- 10.1.2. Automotive
- 10.1.3. Industrial Control
- 10.1.4. Consumer Products
- 10.1.5. Data Center
- 10.1.6. Medical
- 10.1.7. Others
- 10.2. Market Analysis, Insights and Forecast - by Type
- 10.2.1. Less Than 28 nm
- 10.2.2. 28-90 nm
- 10.2.3. More Than 90 nm
- 10.1. Market Analysis, Insights and Forecast - by Application
- 11. Competitive Analysis
- 11.1. Global Market Share Analysis 2024
- 11.2. Company Profiles
- 11.2.1 Xilinx (US)
- 11.2.1.1. Overview
- 11.2.1.2. Products
- 11.2.1.3. SWOT Analysis
- 11.2.1.4. Recent Developments
- 11.2.1.5. Financials (Based on Availability)
- 11.2.2 Intel (US)
- 11.2.2.1. Overview
- 11.2.2.2. Products
- 11.2.2.3. SWOT Analysis
- 11.2.2.4. Recent Developments
- 11.2.2.5. Financials (Based on Availability)
- 11.2.3 Lattice Semiconductor (US)
- 11.2.3.1. Overview
- 11.2.3.2. Products
- 11.2.3.3. SWOT Analysis
- 11.2.3.4. Recent Developments
- 11.2.3.5. Financials (Based on Availability)
- 11.2.4 Microchip Technology (US)
- 11.2.4.1. Overview
- 11.2.4.2. Products
- 11.2.4.3. SWOT Analysis
- 11.2.4.4. Recent Developments
- 11.2.4.5. Financials (Based on Availability)
- 11.2.5 QuickLogic (US)
- 11.2.5.1. Overview
- 11.2.5.2. Products
- 11.2.5.3. SWOT Analysis
- 11.2.5.4. Recent Developments
- 11.2.5.5. Financials (Based on Availability)
- 11.2.6 TSMC (Taiwan)
- 11.2.6.1. Overview
- 11.2.6.2. Products
- 11.2.6.3. SWOT Analysis
- 11.2.6.4. Recent Developments
- 11.2.6.5. Financials (Based on Availability)
- 11.2.7 Microchip (US)
- 11.2.7.1. Overview
- 11.2.7.2. Products
- 11.2.7.3. SWOT Analysis
- 11.2.7.4. Recent Developments
- 11.2.7.5. Financials (Based on Availability)
- 11.2.8 United Microelectronics (Taiwan)
- 11.2.8.1. Overview
- 11.2.8.2. Products
- 11.2.8.3. SWOT Analysis
- 11.2.8.4. Recent Developments
- 11.2.8.5. Financials (Based on Availability)
- 11.2.9 GLOBALFOUNDRIES (US)
- 11.2.9.1. Overview
- 11.2.9.2. Products
- 11.2.9.3. SWOT Analysis
- 11.2.9.4. Recent Developments
- 11.2.9.5. Financials (Based on Availability)
- 11.2.10 Achronix (US)
- 11.2.10.1. Overview
- 11.2.10.2. Products
- 11.2.10.3. SWOT Analysis
- 11.2.10.4. Recent Developments
- 11.2.10.5. Financials (Based on Availability)
- 11.2.11 S2C Inc (US)
- 11.2.11.1. Overview
- 11.2.11.2. Products
- 11.2.11.3. SWOT Analysis
- 11.2.11.4. Recent Developments
- 11.2.11.5. Financials (Based on Availability)
- 11.2.1 Xilinx (US)
List of Figures
- Figure 1: Global Low End Fpga Revenue Breakdown (million, %) by Region 2024 & 2032
- Figure 2: Global Low End Fpga Volume Breakdown (K, %) by Region 2024 & 2032
- Figure 3: North America Low End Fpga Revenue (million), by Application 2024 & 2032
- Figure 4: North America Low End Fpga Volume (K), by Application 2024 & 2032
- Figure 5: North America Low End Fpga Revenue Share (%), by Application 2024 & 2032
- Figure 6: North America Low End Fpga Volume Share (%), by Application 2024 & 2032
- Figure 7: North America Low End Fpga Revenue (million), by Type 2024 & 2032
- Figure 8: North America Low End Fpga Volume (K), by Type 2024 & 2032
- Figure 9: North America Low End Fpga Revenue Share (%), by Type 2024 & 2032
- Figure 10: North America Low End Fpga Volume Share (%), by Type 2024 & 2032
- Figure 11: North America Low End Fpga Revenue (million), by Country 2024 & 2032
- Figure 12: North America Low End Fpga Volume (K), by Country 2024 & 2032
- Figure 13: North America Low End Fpga Revenue Share (%), by Country 2024 & 2032
- Figure 14: North America Low End Fpga Volume Share (%), by Country 2024 & 2032
- Figure 15: South America Low End Fpga Revenue (million), by Application 2024 & 2032
- Figure 16: South America Low End Fpga Volume (K), by Application 2024 & 2032
- Figure 17: South America Low End Fpga Revenue Share (%), by Application 2024 & 2032
- Figure 18: South America Low End Fpga Volume Share (%), by Application 2024 & 2032
- Figure 19: South America Low End Fpga Revenue (million), by Type 2024 & 2032
- Figure 20: South America Low End Fpga Volume (K), by Type 2024 & 2032
- Figure 21: South America Low End Fpga Revenue Share (%), by Type 2024 & 2032
- Figure 22: South America Low End Fpga Volume Share (%), by Type 2024 & 2032
- Figure 23: South America Low End Fpga Revenue (million), by Country 2024 & 2032
- Figure 24: South America Low End Fpga Volume (K), by Country 2024 & 2032
- Figure 25: South America Low End Fpga Revenue Share (%), by Country 2024 & 2032
- Figure 26: South America Low End Fpga Volume Share (%), by Country 2024 & 2032
- Figure 27: Europe Low End Fpga Revenue (million), by Application 2024 & 2032
- Figure 28: Europe Low End Fpga Volume (K), by Application 2024 & 2032
- Figure 29: Europe Low End Fpga Revenue Share (%), by Application 2024 & 2032
- Figure 30: Europe Low End Fpga Volume Share (%), by Application 2024 & 2032
- Figure 31: Europe Low End Fpga Revenue (million), by Type 2024 & 2032
- Figure 32: Europe Low End Fpga Volume (K), by Type 2024 & 2032
- Figure 33: Europe Low End Fpga Revenue Share (%), by Type 2024 & 2032
- Figure 34: Europe Low End Fpga Volume Share (%), by Type 2024 & 2032
- Figure 35: Europe Low End Fpga Revenue (million), by Country 2024 & 2032
- Figure 36: Europe Low End Fpga Volume (K), by Country 2024 & 2032
- Figure 37: Europe Low End Fpga Revenue Share (%), by Country 2024 & 2032
- Figure 38: Europe Low End Fpga Volume Share (%), by Country 2024 & 2032
- Figure 39: Middle East & Africa Low End Fpga Revenue (million), by Application 2024 & 2032
- Figure 40: Middle East & Africa Low End Fpga Volume (K), by Application 2024 & 2032
- Figure 41: Middle East & Africa Low End Fpga Revenue Share (%), by Application 2024 & 2032
- Figure 42: Middle East & Africa Low End Fpga Volume Share (%), by Application 2024 & 2032
- Figure 43: Middle East & Africa Low End Fpga Revenue (million), by Type 2024 & 2032
- Figure 44: Middle East & Africa Low End Fpga Volume (K), by Type 2024 & 2032
- Figure 45: Middle East & Africa Low End Fpga Revenue Share (%), by Type 2024 & 2032
- Figure 46: Middle East & Africa Low End Fpga Volume Share (%), by Type 2024 & 2032
- Figure 47: Middle East & Africa Low End Fpga Revenue (million), by Country 2024 & 2032
- Figure 48: Middle East & Africa Low End Fpga Volume (K), by Country 2024 & 2032
- Figure 49: Middle East & Africa Low End Fpga Revenue Share (%), by Country 2024 & 2032
- Figure 50: Middle East & Africa Low End Fpga Volume Share (%), by Country 2024 & 2032
- Figure 51: Asia Pacific Low End Fpga Revenue (million), by Application 2024 & 2032
- Figure 52: Asia Pacific Low End Fpga Volume (K), by Application 2024 & 2032
- Figure 53: Asia Pacific Low End Fpga Revenue Share (%), by Application 2024 & 2032
- Figure 54: Asia Pacific Low End Fpga Volume Share (%), by Application 2024 & 2032
- Figure 55: Asia Pacific Low End Fpga Revenue (million), by Type 2024 & 2032
- Figure 56: Asia Pacific Low End Fpga Volume (K), by Type 2024 & 2032
- Figure 57: Asia Pacific Low End Fpga Revenue Share (%), by Type 2024 & 2032
- Figure 58: Asia Pacific Low End Fpga Volume Share (%), by Type 2024 & 2032
- Figure 59: Asia Pacific Low End Fpga Revenue (million), by Country 2024 & 2032
- Figure 60: Asia Pacific Low End Fpga Volume (K), by Country 2024 & 2032
- Figure 61: Asia Pacific Low End Fpga Revenue Share (%), by Country 2024 & 2032
- Figure 62: Asia Pacific Low End Fpga Volume Share (%), by Country 2024 & 2032
List of Tables
- Table 1: Global Low End Fpga Revenue million Forecast, by Region 2019 & 2032
- Table 2: Global Low End Fpga Volume K Forecast, by Region 2019 & 2032
- Table 3: Global Low End Fpga Revenue million Forecast, by Application 2019 & 2032
- Table 4: Global Low End Fpga Volume K Forecast, by Application 2019 & 2032
- Table 5: Global Low End Fpga Revenue million Forecast, by Type 2019 & 2032
- Table 6: Global Low End Fpga Volume K Forecast, by Type 2019 & 2032
- Table 7: Global Low End Fpga Revenue million Forecast, by Region 2019 & 2032
- Table 8: Global Low End Fpga Volume K Forecast, by Region 2019 & 2032
- Table 9: Global Low End Fpga Revenue million Forecast, by Application 2019 & 2032
- Table 10: Global Low End Fpga Volume K Forecast, by Application 2019 & 2032
- Table 11: Global Low End Fpga Revenue million Forecast, by Type 2019 & 2032
- Table 12: Global Low End Fpga Volume K Forecast, by Type 2019 & 2032
- Table 13: Global Low End Fpga Revenue million Forecast, by Country 2019 & 2032
- Table 14: Global Low End Fpga Volume K Forecast, by Country 2019 & 2032
- Table 15: United States Low End Fpga Revenue (million) Forecast, by Application 2019 & 2032
- Table 16: United States Low End Fpga Volume (K) Forecast, by Application 2019 & 2032
- Table 17: Canada Low End Fpga Revenue (million) Forecast, by Application 2019 & 2032
- Table 18: Canada Low End Fpga Volume (K) Forecast, by Application 2019 & 2032
- Table 19: Mexico Low End Fpga Revenue (million) Forecast, by Application 2019 & 2032
- Table 20: Mexico Low End Fpga Volume (K) Forecast, by Application 2019 & 2032
- Table 21: Global Low End Fpga Revenue million Forecast, by Application 2019 & 2032
- Table 22: Global Low End Fpga Volume K Forecast, by Application 2019 & 2032
- Table 23: Global Low End Fpga Revenue million Forecast, by Type 2019 & 2032
- Table 24: Global Low End Fpga Volume K Forecast, by Type 2019 & 2032
- Table 25: Global Low End Fpga Revenue million Forecast, by Country 2019 & 2032
- Table 26: Global Low End Fpga Volume K Forecast, by Country 2019 & 2032
- Table 27: Brazil Low End Fpga Revenue (million) Forecast, by Application 2019 & 2032
- Table 28: Brazil Low End Fpga Volume (K) Forecast, by Application 2019 & 2032
- Table 29: Argentina Low End Fpga Revenue (million) Forecast, by Application 2019 & 2032
- Table 30: Argentina Low End Fpga Volume (K) Forecast, by Application 2019 & 2032
- Table 31: Rest of South America Low End Fpga Revenue (million) Forecast, by Application 2019 & 2032
- Table 32: Rest of South America Low End Fpga Volume (K) Forecast, by Application 2019 & 2032
- Table 33: Global Low End Fpga Revenue million Forecast, by Application 2019 & 2032
- Table 34: Global Low End Fpga Volume K Forecast, by Application 2019 & 2032
- Table 35: Global Low End Fpga Revenue million Forecast, by Type 2019 & 2032
- Table 36: Global Low End Fpga Volume K Forecast, by Type 2019 & 2032
- Table 37: Global Low End Fpga Revenue million Forecast, by Country 2019 & 2032
- Table 38: Global Low End Fpga Volume K Forecast, by Country 2019 & 2032
- Table 39: United Kingdom Low End Fpga Revenue (million) Forecast, by Application 2019 & 2032
- Table 40: United Kingdom Low End Fpga Volume (K) Forecast, by Application 2019 & 2032
- Table 41: Germany Low End Fpga Revenue (million) Forecast, by Application 2019 & 2032
- Table 42: Germany Low End Fpga Volume (K) Forecast, by Application 2019 & 2032
- Table 43: France Low End Fpga Revenue (million) Forecast, by Application 2019 & 2032
- Table 44: France Low End Fpga Volume (K) Forecast, by Application 2019 & 2032
- Table 45: Italy Low End Fpga Revenue (million) Forecast, by Application 2019 & 2032
- Table 46: Italy Low End Fpga Volume (K) Forecast, by Application 2019 & 2032
- Table 47: Spain Low End Fpga Revenue (million) Forecast, by Application 2019 & 2032
- Table 48: Spain Low End Fpga Volume (K) Forecast, by Application 2019 & 2032
- Table 49: Russia Low End Fpga Revenue (million) Forecast, by Application 2019 & 2032
- Table 50: Russia Low End Fpga Volume (K) Forecast, by Application 2019 & 2032
- Table 51: Benelux Low End Fpga Revenue (million) Forecast, by Application 2019 & 2032
- Table 52: Benelux Low End Fpga Volume (K) Forecast, by Application 2019 & 2032
- Table 53: Nordics Low End Fpga Revenue (million) Forecast, by Application 2019 & 2032
- Table 54: Nordics Low End Fpga Volume (K) Forecast, by Application 2019 & 2032
- Table 55: Rest of Europe Low End Fpga Revenue (million) Forecast, by Application 2019 & 2032
- Table 56: Rest of Europe Low End Fpga Volume (K) Forecast, by Application 2019 & 2032
- Table 57: Global Low End Fpga Revenue million Forecast, by Application 2019 & 2032
- Table 58: Global Low End Fpga Volume K Forecast, by Application 2019 & 2032
- Table 59: Global Low End Fpga Revenue million Forecast, by Type 2019 & 2032
- Table 60: Global Low End Fpga Volume K Forecast, by Type 2019 & 2032
- Table 61: Global Low End Fpga Revenue million Forecast, by Country 2019 & 2032
- Table 62: Global Low End Fpga Volume K Forecast, by Country 2019 & 2032
- Table 63: Turkey Low End Fpga Revenue (million) Forecast, by Application 2019 & 2032
- Table 64: Turkey Low End Fpga Volume (K) Forecast, by Application 2019 & 2032
- Table 65: Israel Low End Fpga Revenue (million) Forecast, by Application 2019 & 2032
- Table 66: Israel Low End Fpga Volume (K) Forecast, by Application 2019 & 2032
- Table 67: GCC Low End Fpga Revenue (million) Forecast, by Application 2019 & 2032
- Table 68: GCC Low End Fpga Volume (K) Forecast, by Application 2019 & 2032
- Table 69: North Africa Low End Fpga Revenue (million) Forecast, by Application 2019 & 2032
- Table 70: North Africa Low End Fpga Volume (K) Forecast, by Application 2019 & 2032
- Table 71: South Africa Low End Fpga Revenue (million) Forecast, by Application 2019 & 2032
- Table 72: South Africa Low End Fpga Volume (K) Forecast, by Application 2019 & 2032
- Table 73: Rest of Middle East & Africa Low End Fpga Revenue (million) Forecast, by Application 2019 & 2032
- Table 74: Rest of Middle East & Africa Low End Fpga Volume (K) Forecast, by Application 2019 & 2032
- Table 75: Global Low End Fpga Revenue million Forecast, by Application 2019 & 2032
- Table 76: Global Low End Fpga Volume K Forecast, by Application 2019 & 2032
- Table 77: Global Low End Fpga Revenue million Forecast, by Type 2019 & 2032
- Table 78: Global Low End Fpga Volume K Forecast, by Type 2019 & 2032
- Table 79: Global Low End Fpga Revenue million Forecast, by Country 2019 & 2032
- Table 80: Global Low End Fpga Volume K Forecast, by Country 2019 & 2032
- Table 81: China Low End Fpga Revenue (million) Forecast, by Application 2019 & 2032
- Table 82: China Low End Fpga Volume (K) Forecast, by Application 2019 & 2032
- Table 83: India Low End Fpga Revenue (million) Forecast, by Application 2019 & 2032
- Table 84: India Low End Fpga Volume (K) Forecast, by Application 2019 & 2032
- Table 85: Japan Low End Fpga Revenue (million) Forecast, by Application 2019 & 2032
- Table 86: Japan Low End Fpga Volume (K) Forecast, by Application 2019 & 2032
- Table 87: South Korea Low End Fpga Revenue (million) Forecast, by Application 2019 & 2032
- Table 88: South Korea Low End Fpga Volume (K) Forecast, by Application 2019 & 2032
- Table 89: ASEAN Low End Fpga Revenue (million) Forecast, by Application 2019 & 2032
- Table 90: ASEAN Low End Fpga Volume (K) Forecast, by Application 2019 & 2032
- Table 91: Oceania Low End Fpga Revenue (million) Forecast, by Application 2019 & 2032
- Table 92: Oceania Low End Fpga Volume (K) Forecast, by Application 2019 & 2032
- Table 93: Rest of Asia Pacific Low End Fpga Revenue (million) Forecast, by Application 2019 & 2032
- Table 94: Rest of Asia Pacific Low End Fpga Volume (K) Forecast, by Application 2019 & 2032
Frequently Asked Questions
1. What is the projected Compound Annual Growth Rate (CAGR) of the Low End Fpga?
The projected CAGR is approximately XXX%.
2. Which companies are prominent players in the Low End Fpga?
Key companies in the market include Xilinx (US), Intel (US), Lattice Semiconductor (US), Microchip Technology (US), QuickLogic (US), TSMC (Taiwan), Microchip (US), United Microelectronics (Taiwan), GLOBALFOUNDRIES (US), Achronix (US), S2C Inc (US).
3. What are the main segments of the Low End Fpga?
The market segments include Application, Type.
4. Can you provide details about the market size?
The market size is estimated to be USD XXX million as of 2022.
5. What are some drivers contributing to market growth?
N/A
6. What are the notable trends driving market growth?
N/A
7. Are there any restraints impacting market growth?
N/A
8. Can you provide examples of recent developments in the market?
N/A
9. What pricing options are available for accessing the report?
Pricing options include single-user, multi-user, and enterprise licenses priced at USD 3950.00, USD 5925.00, and USD 7900.00 respectively.
10. Is the market size provided in terms of value or volume?
The market size is provided in terms of value, measured in million and volume, measured in K.
11. Are there any specific market keywords associated with the report?
Yes, the market keyword associated with the report is "Low End Fpga," which aids in identifying and referencing the specific market segment covered.
12. How do I determine which pricing option suits my needs best?
The pricing options vary based on user requirements and access needs. Individual users may opt for single-user licenses, while businesses requiring broader access may choose multi-user or enterprise licenses for cost-effective access to the report.
13. Are there any additional resources or data provided in the Low End Fpga report?
While the report offers comprehensive insights, it's advisable to review the specific contents or supplementary materials provided to ascertain if additional resources or data are available.
14. How can I stay updated on further developments or reports in the Low End Fpga?
To stay informed about further developments, trends, and reports in the Low End Fpga, consider subscribing to industry newsletters, following relevant companies and organizations, or regularly checking reputable industry news sources and publications.
Methodology
Step 1 - Identification of Relevant Samples Size from Population Database


Step 2 - Approaches for Defining Global Market Size (Value, Volume* & Price*)

Note*: In applicable scenarios
Step 3 - Data Sources
Primary Research
- Web Analytics
- Survey Reports
- Research Institute
- Latest Research Reports
- Opinion Leaders
Secondary Research
- Annual Reports
- White Paper
- Latest Press Release
- Industry Association
- Paid Database
- Investor Presentations

Step 4 - Data Triangulation
Involves using different sources of information in order to increase the validity of a study
These sources are likely to be stakeholders in a program - participants, other researchers, program staff, other community members, and so on.
Then we put all data in single framework & apply various statistical tools to find out the dynamic on the market.
During the analysis stage, feedback from the stakeholder groups would be compared to determine areas of agreement as well as areas of divergence


