
Key Insights
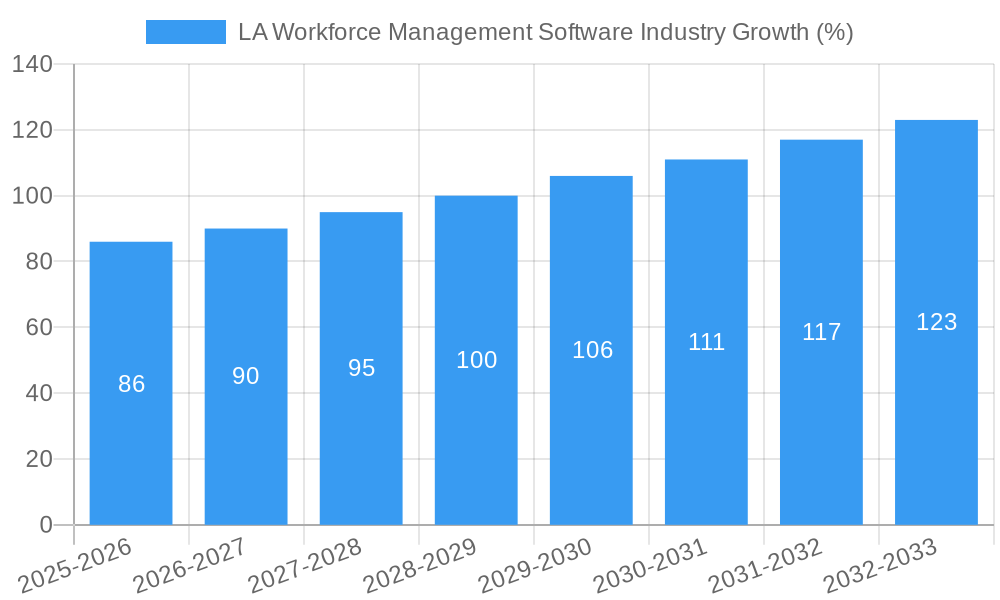
The Latin American (LA) workforce management software market is experiencing robust growth, projected to reach a substantial size in the coming years. A 5.48% Compound Annual Growth Rate (CAGR) from 2019-2024 indicates a steadily expanding market driven by several key factors. The increasing adoption of cloud-based solutions across various sectors, including BFSI (Banking, Financial Services, and Insurance), retail, manufacturing, and healthcare, is a primary driver. These industries are increasingly leveraging software to optimize scheduling, track time and attendance, improve employee performance, and manage absences more efficiently. Furthermore, the need for enhanced operational efficiency, improved workforce productivity, and better compliance with labor regulations fuels market expansion. The demand for integrated solutions that address multiple workforce management needs, such as performance management combined with time and attendance tracking, is also contributing to growth. While data on specific regional market shares within LA is unavailable, Mexico and Brazil, given their significant economic size and developing technological infrastructure, are likely to be the leading markets. Competition is fierce, with both established global players and regional specialists vying for market share. The market is further segmented by deployment model (cloud vs. on-premise), software functionalities (scheduling, analytics, etc.), and end-user vertical. Future growth will depend on continued technological advancements, increasing digital adoption across diverse industries, and government initiatives promoting technological innovation. The expansion of high-speed internet access and improvements in digital literacy will significantly impact the market trajectory in the coming years.
The competitive landscape is characterized by a mix of global giants like Workday, IBM, and SAP, alongside specialized providers such as Reflexis, Kronos, and 7shifts catering to specific industry needs. The success of vendors will hinge on their ability to provide customized solutions tailored to the unique challenges faced by different LA industries and to adapt to local market preferences. This includes localization of software in multiple languages and adherence to specific labor regulations. While initial investment costs and integration complexities can pose restraints, the long-term cost savings and productivity improvements that workforce management software offers are increasingly convincing businesses to make the transition. The future of the LA workforce management software market appears bright, driven by a confluence of economic, technological, and regulatory factors.
LA Workforce Management Software Industry Market Report: 2019-2033
This comprehensive report provides a detailed analysis of the Latin American (LA) Workforce Management Software market, covering the period from 2019 to 2033. It offers invaluable insights for industry professionals, investors, and strategic decision-makers seeking to understand the market dynamics, growth trends, and future prospects of this rapidly evolving sector. The report utilizes a robust methodology incorporating both qualitative and quantitative data, providing a 360° view of the LA workforce management software landscape.
Key segments analyzed include: Workforce Scheduling and Workforce Analytics, Time and Attendance Management, Performance and Goal Management, Absence and Leave Management, and Other Software (Fatigue Management, Task Management, etc.). Deployment modes encompass On-premise and Cloud solutions, targeting key end-user verticals such as BFSI, Consumer Goods and Retail, Automotive, Energy and Utilities, Healthcare, Manufacturing, and Other End-user Verticals across Brazil, Mexico, Argentina, and the Rest of Latin America.
LA Workforce Management Software Industry Market Dynamics & Structure
The LA workforce management software market is characterized by a moderately concentrated landscape, with several major players competing alongside numerous niche providers. Technological innovation, particularly in areas like AI-powered scheduling and predictive analytics, is a significant driver of market growth. However, regulatory frameworks concerning data privacy and security pose challenges. The market also witnesses considerable competitive pressure from alternative solutions and evolving end-user demands. Mergers and acquisitions (M&A) activity has been relatively moderate in recent years, with xx million USD in deal value recorded during 2019-2024, indicating potential for future consolidation.
- Market Concentration: Moderately concentrated, with a Herfindahl-Hirschman Index (HHI) of xx.
- Technological Innovation: AI-driven analytics, automation, and mobile accessibility are key drivers.
- Regulatory Framework: Data privacy regulations (e.g., GDPR, local equivalents) impact software adoption.
- Competitive Substitutes: Basic spreadsheets and legacy systems present competition.
- End-User Demographics: Growing adoption by SMEs and large enterprises alike.
- M&A Trends: xx million USD in M&A activity during 2019-2024, with a projected increase in the forecast period.
LA Workforce Management Software Industry Growth Trends & Insights
The LA workforce management software market experienced significant growth during the historical period (2019-2024), driven by increasing adoption across various sectors. The market size reached xx million USD in 2024 and is projected to expand at a Compound Annual Growth Rate (CAGR) of xx% during the forecast period (2025-2033), reaching xx million USD by 2033. This growth is fueled by factors such as rising labor costs, the need for enhanced operational efficiency, and the increasing adoption of cloud-based solutions. Technological disruptions like the integration of AI and machine learning are further accelerating market expansion. Consumer behavior shifts toward greater employee self-service and demand for mobile-friendly applications are also influencing market dynamics. Market penetration is currently at xx%, with substantial room for future expansion, particularly in smaller and medium-sized enterprises.
Dominant Regions, Countries, or Segments in LA Workforce Management Software Industry
Brazil represents the largest national market, driven by its sizable economy and relatively advanced technological infrastructure. Mexico follows closely, exhibiting strong growth potential. The dominant segment is Workforce Scheduling and Workforce Analytics, reflecting the increasing emphasis on optimizing workforce allocation and improving productivity. Cloud-based deployment is also gaining significant traction due to its scalability, cost-effectiveness, and accessibility.
- Key Drivers: Government initiatives to promote digital transformation, increasing investment in infrastructure, and a growing demand for efficient workforce management solutions across diverse industries.
- Dominance Factors: Brazil and Mexico's large populations, growing economies, and evolving technological landscape underpin their market leadership.
- Growth Potential: Significant untapped potential exists in smaller markets within Latin America, especially as technological adoption accelerates.
LA Workforce Management Software Industry Product Landscape
The LA workforce management software market is witnessing continuous product innovation, with vendors introducing solutions offering improved analytics, AI-powered features, and enhanced user interfaces. Many platforms now incorporate features like real-time scheduling, employee self-service portals, and advanced reporting capabilities. Unique selling propositions include streamlined integrations with existing HR systems, enhanced mobile capabilities, and robust security features. Key technological advancements focus on AI-driven predictive analytics to optimize workforce planning and improve operational efficiency.
Key Drivers, Barriers & Challenges in LA Workforce Management Software Industry
Key Drivers: The increasing need for operational efficiency, rising labor costs, and the growing adoption of cloud computing are major drivers of market growth. Government initiatives supporting digital transformation and investments in infrastructure further accelerate market expansion.
Challenges: High implementation costs, integration complexities with existing systems, and concerns about data security and privacy pose challenges. Competition from established players and emerging technologies also present hurdles. Supply chain disruptions impacting hardware availability can also affect market growth. The level of technological expertise among end-users and the digital divide in some regions create adoption barriers.
Emerging Opportunities in LA Workforce Management Software Industry
Untapped market potential exists among SMEs in less-developed regions of Latin America. The increasing adoption of mobile technology presents opportunities for developing user-friendly mobile-first solutions. Integrating advanced analytics capabilities for better workforce optimization is another avenue for growth. Additionally, tailored solutions addressing unique industry-specific needs (e.g., specialized features for the agricultural sector) represent promising growth areas.
Growth Accelerators in the LA Workforce Management Software Industry
Strategic partnerships between software vendors and HR service providers can significantly boost market growth. Investments in R&D to develop innovative features like predictive analytics and AI-powered scheduling will drive adoption. Market expansion strategies focused on targeting specific niche industries and regions with tailored solutions will further accelerate market growth. Technological breakthroughs in areas like blockchain for secure data management can unlock new market opportunities.
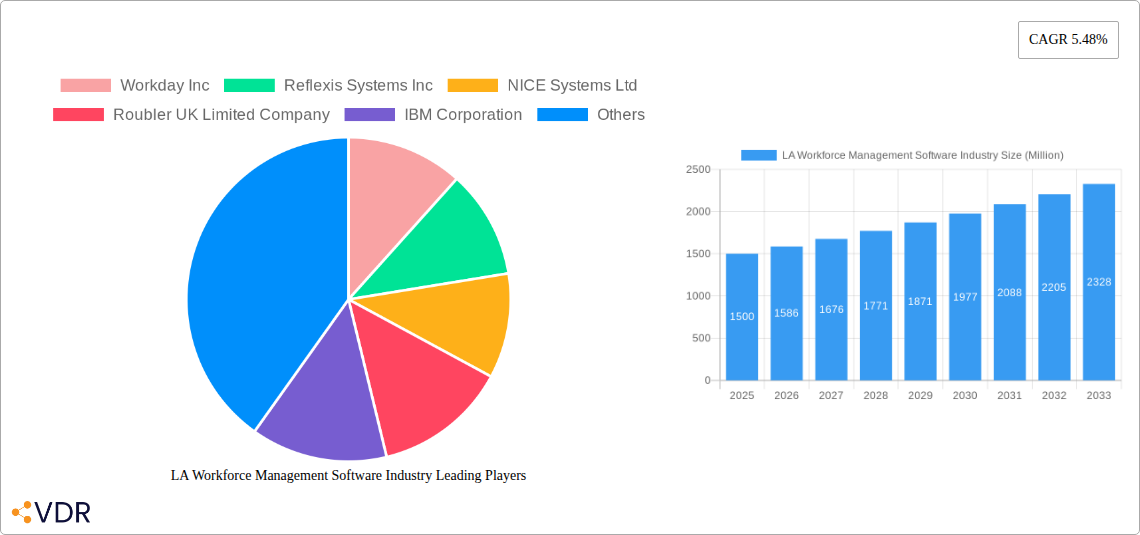
Key Players Shaping the LA Workforce Management Software Market
- Workday Inc
- Reflexis Systems Inc
- NICE Systems Ltd
- Roubler UK Limited Company
- IBM Corporation
- Blue Yonder Group Inc
- Active Operations Management International LLP
- Sage Group PLC
- Kronos Incorporated
- 7shifts
- ServiceMax Inc
- Infor Group
- Atoss Software AG
- Oracle Corporation
- ADP LLC
- Tamigo UK Ltd
- SISQUAL
- WorkForce Software LLC
- SAP SE
- Mitrefinch Ltd
- Kirona Solutions Limited
Notable Milestones in LA Workforce Management Software Industry Sector
- 2020: Increased adoption of cloud-based solutions due to the pandemic.
- 2021: Launch of several AI-powered workforce management platforms.
- 2022: Several key mergers and acquisitions in the sector.
- 2023: Introduction of new regulations impacting data privacy.
- 2024: Growing emphasis on employee experience and self-service tools.
In-Depth LA Workforce Management Software Industry Market Outlook
The LA workforce management software market holds significant growth potential driven by increasing technological advancements, strategic partnerships, and the expanding adoption across various industries. The continued focus on improving workforce efficiency and productivity, coupled with the growing demand for cloud-based solutions, will fuel market expansion in the coming years. Opportunities exist for innovative companies to cater to specific niche markets and leverage advanced technologies to gain a competitive edge. The market is poised for significant growth as digital transformation accelerates across Latin America.
LA Workforce Management Software Industry Segmentation
-
1. Type
- 1.1. Workforce Scheduling and Workforce Analytics
- 1.2. Time and Attendance Management
- 1.3. Performance and Goal Management
- 1.4. Absence and Leave Management
- 1.5. Other So
-
2. Deployment Mode
- 2.1. On-premise
- 2.2. Cloud
-
3. End-user Vertical
- 3.1. BFSI
- 3.2. Consumer Goods and Retail
- 3.3. Automotive
- 3.4. Energy and Utilities
- 3.5. Healthcare
- 3.6. Manufacturing
- 3.7. Other End-user Verticals
LA Workforce Management Software Industry Segmentation By Geography
-
1. North America
- 1.1. United States
- 1.2. Canada
- 1.3. Mexico
-
2. South America
- 2.1. Brazil
- 2.2. Argentina
- 2.3. Rest of South America
-
3. Europe
- 3.1. United Kingdom
- 3.2. Germany
- 3.3. France
- 3.4. Italy
- 3.5. Spain
- 3.6. Russia
- 3.7. Benelux
- 3.8. Nordics
- 3.9. Rest of Europe
-
4. Middle East & Africa
- 4.1. Turkey
- 4.2. Israel
- 4.3. GCC
- 4.4. North Africa
- 4.5. South Africa
- 4.6. Rest of Middle East & Africa
-
5. Asia Pacific
- 5.1. China
- 5.2. India
- 5.3. Japan
- 5.4. South Korea
- 5.5. ASEAN
- 5.6. Oceania
- 5.7. Rest of Asia Pacific
LA Workforce Management Software Industry REPORT HIGHLIGHTS
| Aspects | Details |
|---|---|
| Study Period | 2019-2033 |
| Base Year | 2024 |
| Estimated Year | 2025 |
| Forecast Period | 2025-2033 |
| Historical Period | 2019-2024 |
| Growth Rate | CAGR of 5.48% from 2019-2033 |
| Segmentation |
|
Table of Contents
- 1. Introduction
- 1.1. Research Scope
- 1.2. Market Segmentation
- 1.3. Research Methodology
- 1.4. Definitions and Assumptions
- 2. Executive Summary
- 2.1. Introduction
- 3. Market Dynamics
- 3.1. Introduction
- 3.2. Market Drivers
- 3.2.1. Increasing Adoption of Internet of Things (IoT) and Cloud-based Solutions Expanding the Market; Growing Adoption of Analytical Solutions and WFM by SMEs Driving Market Growth
- 3.3. Market Restrains
- 3.3.1. ; Availability of open-source alternatives
- 3.4. Market Trends
- 3.4.1. Retail and Consumer Goods to Hold the Largest Market Share
- 4. Market Factor Analysis
- 4.1. Porters Five Forces
- 4.2. Supply/Value Chain
- 4.3. PESTEL analysis
- 4.4. Market Entropy
- 4.5. Patent/Trademark Analysis
- 5. Global LA Workforce Management Software Industry Analysis, Insights and Forecast, 2019-2031
- 5.1. Market Analysis, Insights and Forecast - by Type
- 5.1.1. Workforce Scheduling and Workforce Analytics
- 5.1.2. Time and Attendance Management
- 5.1.3. Performance and Goal Management
- 5.1.4. Absence and Leave Management
- 5.1.5. Other So
- 5.2. Market Analysis, Insights and Forecast - by Deployment Mode
- 5.2.1. On-premise
- 5.2.2. Cloud
- 5.3. Market Analysis, Insights and Forecast - by End-user Vertical
- 5.3.1. BFSI
- 5.3.2. Consumer Goods and Retail
- 5.3.3. Automotive
- 5.3.4. Energy and Utilities
- 5.3.5. Healthcare
- 5.3.6. Manufacturing
- 5.3.7. Other End-user Verticals
- 5.4. Market Analysis, Insights and Forecast - by Region
- 5.4.1. North America
- 5.4.2. South America
- 5.4.3. Europe
- 5.4.4. Middle East & Africa
- 5.4.5. Asia Pacific
- 5.1. Market Analysis, Insights and Forecast - by Type
- 6. North America LA Workforce Management Software Industry Analysis, Insights and Forecast, 2019-2031
- 6.1. Market Analysis, Insights and Forecast - by Type
- 6.1.1. Workforce Scheduling and Workforce Analytics
- 6.1.2. Time and Attendance Management
- 6.1.3. Performance and Goal Management
- 6.1.4. Absence and Leave Management
- 6.1.5. Other So
- 6.2. Market Analysis, Insights and Forecast - by Deployment Mode
- 6.2.1. On-premise
- 6.2.2. Cloud
- 6.3. Market Analysis, Insights and Forecast - by End-user Vertical
- 6.3.1. BFSI
- 6.3.2. Consumer Goods and Retail
- 6.3.3. Automotive
- 6.3.4. Energy and Utilities
- 6.3.5. Healthcare
- 6.3.6. Manufacturing
- 6.3.7. Other End-user Verticals
- 6.1. Market Analysis, Insights and Forecast - by Type
- 7. South America LA Workforce Management Software Industry Analysis, Insights and Forecast, 2019-2031
- 7.1. Market Analysis, Insights and Forecast - by Type
- 7.1.1. Workforce Scheduling and Workforce Analytics
- 7.1.2. Time and Attendance Management
- 7.1.3. Performance and Goal Management
- 7.1.4. Absence and Leave Management
- 7.1.5. Other So
- 7.2. Market Analysis, Insights and Forecast - by Deployment Mode
- 7.2.1. On-premise
- 7.2.2. Cloud
- 7.3. Market Analysis, Insights and Forecast - by End-user Vertical
- 7.3.1. BFSI
- 7.3.2. Consumer Goods and Retail
- 7.3.3. Automotive
- 7.3.4. Energy and Utilities
- 7.3.5. Healthcare
- 7.3.6. Manufacturing
- 7.3.7. Other End-user Verticals
- 7.1. Market Analysis, Insights and Forecast - by Type
- 8. Europe LA Workforce Management Software Industry Analysis, Insights and Forecast, 2019-2031
- 8.1. Market Analysis, Insights and Forecast - by Type
- 8.1.1. Workforce Scheduling and Workforce Analytics
- 8.1.2. Time and Attendance Management
- 8.1.3. Performance and Goal Management
- 8.1.4. Absence and Leave Management
- 8.1.5. Other So
- 8.2. Market Analysis, Insights and Forecast - by Deployment Mode
- 8.2.1. On-premise
- 8.2.2. Cloud
- 8.3. Market Analysis, Insights and Forecast - by End-user Vertical
- 8.3.1. BFSI
- 8.3.2. Consumer Goods and Retail
- 8.3.3. Automotive
- 8.3.4. Energy and Utilities
- 8.3.5. Healthcare
- 8.3.6. Manufacturing
- 8.3.7. Other End-user Verticals
- 8.1. Market Analysis, Insights and Forecast - by Type
- 9. Middle East & Africa LA Workforce Management Software Industry Analysis, Insights and Forecast, 2019-2031
- 9.1. Market Analysis, Insights and Forecast - by Type
- 9.1.1. Workforce Scheduling and Workforce Analytics
- 9.1.2. Time and Attendance Management
- 9.1.3. Performance and Goal Management
- 9.1.4. Absence and Leave Management
- 9.1.5. Other So
- 9.2. Market Analysis, Insights and Forecast - by Deployment Mode
- 9.2.1. On-premise
- 9.2.2. Cloud
- 9.3. Market Analysis, Insights and Forecast - by End-user Vertical
- 9.3.1. BFSI
- 9.3.2. Consumer Goods and Retail
- 9.3.3. Automotive
- 9.3.4. Energy and Utilities
- 9.3.5. Healthcare
- 9.3.6. Manufacturing
- 9.3.7. Other End-user Verticals
- 9.1. Market Analysis, Insights and Forecast - by Type
- 10. Asia Pacific LA Workforce Management Software Industry Analysis, Insights and Forecast, 2019-2031
- 10.1. Market Analysis, Insights and Forecast - by Type
- 10.1.1. Workforce Scheduling and Workforce Analytics
- 10.1.2. Time and Attendance Management
- 10.1.3. Performance and Goal Management
- 10.1.4. Absence and Leave Management
- 10.1.5. Other So
- 10.2. Market Analysis, Insights and Forecast - by Deployment Mode
- 10.2.1. On-premise
- 10.2.2. Cloud
- 10.3. Market Analysis, Insights and Forecast - by End-user Vertical
- 10.3.1. BFSI
- 10.3.2. Consumer Goods and Retail
- 10.3.3. Automotive
- 10.3.4. Energy and Utilities
- 10.3.5. Healthcare
- 10.3.6. Manufacturing
- 10.3.7. Other End-user Verticals
- 10.1. Market Analysis, Insights and Forecast - by Type
- 11. North America LA Workforce Management Software Industry Analysis, Insights and Forecast, 2019-2031
- 11.1. Market Analysis, Insights and Forecast - By Country/Sub-region
- 11.1.1.
- 12. Europe LA Workforce Management Software Industry Analysis, Insights and Forecast, 2019-2031
- 12.1. Market Analysis, Insights and Forecast - By Country/Sub-region
- 12.1.1.
- 13. Asia Pacific LA Workforce Management Software Industry Analysis, Insights and Forecast, 2019-2031
- 13.1. Market Analysis, Insights and Forecast - By Country/Sub-region
- 13.1.1.
- 14. Latin America LA Workforce Management Software Industry Analysis, Insights and Forecast, 2019-2031
- 14.1. Market Analysis, Insights and Forecast - By Country/Sub-region
- 14.1.1.
- 15. Middle East LA Workforce Management Software Industry Analysis, Insights and Forecast, 2019-2031
- 15.1. Market Analysis, Insights and Forecast - By Country/Sub-region
- 15.1.1.
- 16. Competitive Analysis
- 16.1. Global Market Share Analysis 2024
- 16.2. Company Profiles
- 16.2.1 Workday Inc
- 16.2.1.1. Overview
- 16.2.1.2. Products
- 16.2.1.3. SWOT Analysis
- 16.2.1.4. Recent Developments
- 16.2.1.5. Financials (Based on Availability)
- 16.2.2 Reflexis Systems Inc
- 16.2.2.1. Overview
- 16.2.2.2. Products
- 16.2.2.3. SWOT Analysis
- 16.2.2.4. Recent Developments
- 16.2.2.5. Financials (Based on Availability)
- 16.2.3 NICE Systems Ltd
- 16.2.3.1. Overview
- 16.2.3.2. Products
- 16.2.3.3. SWOT Analysis
- 16.2.3.4. Recent Developments
- 16.2.3.5. Financials (Based on Availability)
- 16.2.4 Roubler UK Limited Company
- 16.2.4.1. Overview
- 16.2.4.2. Products
- 16.2.4.3. SWOT Analysis
- 16.2.4.4. Recent Developments
- 16.2.4.5. Financials (Based on Availability)
- 16.2.5 IBM Corporation
- 16.2.5.1. Overview
- 16.2.5.2. Products
- 16.2.5.3. SWOT Analysis
- 16.2.5.4. Recent Developments
- 16.2.5.5. Financials (Based on Availability)
- 16.2.6 Blue Yonder Group Inc
- 16.2.6.1. Overview
- 16.2.6.2. Products
- 16.2.6.3. SWOT Analysis
- 16.2.6.4. Recent Developments
- 16.2.6.5. Financials (Based on Availability)
- 16.2.7 Active Operations Management International LLP
- 16.2.7.1. Overview
- 16.2.7.2. Products
- 16.2.7.3. SWOT Analysis
- 16.2.7.4. Recent Developments
- 16.2.7.5. Financials (Based on Availability)
- 16.2.8 Sage Group PLC
- 16.2.8.1. Overview
- 16.2.8.2. Products
- 16.2.8.3. SWOT Analysis
- 16.2.8.4. Recent Developments
- 16.2.8.5. Financials (Based on Availability)
- 16.2.9 Kronos Incorporated
- 16.2.9.1. Overview
- 16.2.9.2. Products
- 16.2.9.3. SWOT Analysis
- 16.2.9.4. Recent Developments
- 16.2.9.5. Financials (Based on Availability)
- 16.2.10 7shifts
- 16.2.10.1. Overview
- 16.2.10.2. Products
- 16.2.10.3. SWOT Analysis
- 16.2.10.4. Recent Developments
- 16.2.10.5. Financials (Based on Availability)
- 16.2.11 ServiceMax Inc
- 16.2.11.1. Overview
- 16.2.11.2. Products
- 16.2.11.3. SWOT Analysis
- 16.2.11.4. Recent Developments
- 16.2.11.5. Financials (Based on Availability)
- 16.2.12 Infor Group
- 16.2.12.1. Overview
- 16.2.12.2. Products
- 16.2.12.3. SWOT Analysis
- 16.2.12.4. Recent Developments
- 16.2.12.5. Financials (Based on Availability)
- 16.2.13 Atoss Software AG
- 16.2.13.1. Overview
- 16.2.13.2. Products
- 16.2.13.3. SWOT Analysis
- 16.2.13.4. Recent Developments
- 16.2.13.5. Financials (Based on Availability)
- 16.2.14 Oracle Corporation
- 16.2.14.1. Overview
- 16.2.14.2. Products
- 16.2.14.3. SWOT Analysis
- 16.2.14.4. Recent Developments
- 16.2.14.5. Financials (Based on Availability)
- 16.2.15 ADP LLC
- 16.2.15.1. Overview
- 16.2.15.2. Products
- 16.2.15.3. SWOT Analysis
- 16.2.15.4. Recent Developments
- 16.2.15.5. Financials (Based on Availability)
- 16.2.16 Tamigo UK Ltd
- 16.2.16.1. Overview
- 16.2.16.2. Products
- 16.2.16.3. SWOT Analysis
- 16.2.16.4. Recent Developments
- 16.2.16.5. Financials (Based on Availability)
- 16.2.17 SISQUAL
- 16.2.17.1. Overview
- 16.2.17.2. Products
- 16.2.17.3. SWOT Analysis
- 16.2.17.4. Recent Developments
- 16.2.17.5. Financials (Based on Availability)
- 16.2.18 WorkForce Software LLC
- 16.2.18.1. Overview
- 16.2.18.2. Products
- 16.2.18.3. SWOT Analysis
- 16.2.18.4. Recent Developments
- 16.2.18.5. Financials (Based on Availability)
- 16.2.19 SAP SE
- 16.2.19.1. Overview
- 16.2.19.2. Products
- 16.2.19.3. SWOT Analysis
- 16.2.19.4. Recent Developments
- 16.2.19.5. Financials (Based on Availability)
- 16.2.20 Mitrefinch Ltd
- 16.2.20.1. Overview
- 16.2.20.2. Products
- 16.2.20.3. SWOT Analysis
- 16.2.20.4. Recent Developments
- 16.2.20.5. Financials (Based on Availability)
- 16.2.21 Kirona Solutions Limited
- 16.2.21.1. Overview
- 16.2.21.2. Products
- 16.2.21.3. SWOT Analysis
- 16.2.21.4. Recent Developments
- 16.2.21.5. Financials (Based on Availability)
- 16.2.1 Workday Inc
List of Figures
- Figure 1: Global LA Workforce Management Software Industry Revenue Breakdown (Million, %) by Region 2024 & 2032
- Figure 2: Global LA Workforce Management Software Industry Volume Breakdown (K Unit, %) by Region 2024 & 2032
- Figure 3: North America LA Workforce Management Software Industry Revenue (Million), by Country 2024 & 2032
- Figure 4: North America LA Workforce Management Software Industry Volume (K Unit), by Country 2024 & 2032
- Figure 5: North America LA Workforce Management Software Industry Revenue Share (%), by Country 2024 & 2032
- Figure 6: North America LA Workforce Management Software Industry Volume Share (%), by Country 2024 & 2032
- Figure 7: Europe LA Workforce Management Software Industry Revenue (Million), by Country 2024 & 2032
- Figure 8: Europe LA Workforce Management Software Industry Volume (K Unit), by Country 2024 & 2032
- Figure 9: Europe LA Workforce Management Software Industry Revenue Share (%), by Country 2024 & 2032
- Figure 10: Europe LA Workforce Management Software Industry Volume Share (%), by Country 2024 & 2032
- Figure 11: Asia Pacific LA Workforce Management Software Industry Revenue (Million), by Country 2024 & 2032
- Figure 12: Asia Pacific LA Workforce Management Software Industry Volume (K Unit), by Country 2024 & 2032
- Figure 13: Asia Pacific LA Workforce Management Software Industry Revenue Share (%), by Country 2024 & 2032
- Figure 14: Asia Pacific LA Workforce Management Software Industry Volume Share (%), by Country 2024 & 2032
- Figure 15: Latin America LA Workforce Management Software Industry Revenue (Million), by Country 2024 & 2032
- Figure 16: Latin America LA Workforce Management Software Industry Volume (K Unit), by Country 2024 & 2032
- Figure 17: Latin America LA Workforce Management Software Industry Revenue Share (%), by Country 2024 & 2032
- Figure 18: Latin America LA Workforce Management Software Industry Volume Share (%), by Country 2024 & 2032
- Figure 19: Middle East LA Workforce Management Software Industry Revenue (Million), by Country 2024 & 2032
- Figure 20: Middle East LA Workforce Management Software Industry Volume (K Unit), by Country 2024 & 2032
- Figure 21: Middle East LA Workforce Management Software Industry Revenue Share (%), by Country 2024 & 2032
- Figure 22: Middle East LA Workforce Management Software Industry Volume Share (%), by Country 2024 & 2032
- Figure 23: North America LA Workforce Management Software Industry Revenue (Million), by Type 2024 & 2032
- Figure 24: North America LA Workforce Management Software Industry Volume (K Unit), by Type 2024 & 2032
- Figure 25: North America LA Workforce Management Software Industry Revenue Share (%), by Type 2024 & 2032
- Figure 26: North America LA Workforce Management Software Industry Volume Share (%), by Type 2024 & 2032
- Figure 27: North America LA Workforce Management Software Industry Revenue (Million), by Deployment Mode 2024 & 2032
- Figure 28: North America LA Workforce Management Software Industry Volume (K Unit), by Deployment Mode 2024 & 2032
- Figure 29: North America LA Workforce Management Software Industry Revenue Share (%), by Deployment Mode 2024 & 2032
- Figure 30: North America LA Workforce Management Software Industry Volume Share (%), by Deployment Mode 2024 & 2032
- Figure 31: North America LA Workforce Management Software Industry Revenue (Million), by End-user Vertical 2024 & 2032
- Figure 32: North America LA Workforce Management Software Industry Volume (K Unit), by End-user Vertical 2024 & 2032
- Figure 33: North America LA Workforce Management Software Industry Revenue Share (%), by End-user Vertical 2024 & 2032
- Figure 34: North America LA Workforce Management Software Industry Volume Share (%), by End-user Vertical 2024 & 2032
- Figure 35: North America LA Workforce Management Software Industry Revenue (Million), by Country 2024 & 2032
- Figure 36: North America LA Workforce Management Software Industry Volume (K Unit), by Country 2024 & 2032
- Figure 37: North America LA Workforce Management Software Industry Revenue Share (%), by Country 2024 & 2032
- Figure 38: North America LA Workforce Management Software Industry Volume Share (%), by Country 2024 & 2032
- Figure 39: South America LA Workforce Management Software Industry Revenue (Million), by Type 2024 & 2032
- Figure 40: South America LA Workforce Management Software Industry Volume (K Unit), by Type 2024 & 2032
- Figure 41: South America LA Workforce Management Software Industry Revenue Share (%), by Type 2024 & 2032
- Figure 42: South America LA Workforce Management Software Industry Volume Share (%), by Type 2024 & 2032
- Figure 43: South America LA Workforce Management Software Industry Revenue (Million), by Deployment Mode 2024 & 2032
- Figure 44: South America LA Workforce Management Software Industry Volume (K Unit), by Deployment Mode 2024 & 2032
- Figure 45: South America LA Workforce Management Software Industry Revenue Share (%), by Deployment Mode 2024 & 2032
- Figure 46: South America LA Workforce Management Software Industry Volume Share (%), by Deployment Mode 2024 & 2032
- Figure 47: South America LA Workforce Management Software Industry Revenue (Million), by End-user Vertical 2024 & 2032
- Figure 48: South America LA Workforce Management Software Industry Volume (K Unit), by End-user Vertical 2024 & 2032
- Figure 49: South America LA Workforce Management Software Industry Revenue Share (%), by End-user Vertical 2024 & 2032
- Figure 50: South America LA Workforce Management Software Industry Volume Share (%), by End-user Vertical 2024 & 2032
- Figure 51: South America LA Workforce Management Software Industry Revenue (Million), by Country 2024 & 2032
- Figure 52: South America LA Workforce Management Software Industry Volume (K Unit), by Country 2024 & 2032
- Figure 53: South America LA Workforce Management Software Industry Revenue Share (%), by Country 2024 & 2032
- Figure 54: South America LA Workforce Management Software Industry Volume Share (%), by Country 2024 & 2032
- Figure 55: Europe LA Workforce Management Software Industry Revenue (Million), by Type 2024 & 2032
- Figure 56: Europe LA Workforce Management Software Industry Volume (K Unit), by Type 2024 & 2032
- Figure 57: Europe LA Workforce Management Software Industry Revenue Share (%), by Type 2024 & 2032
- Figure 58: Europe LA Workforce Management Software Industry Volume Share (%), by Type 2024 & 2032
- Figure 59: Europe LA Workforce Management Software Industry Revenue (Million), by Deployment Mode 2024 & 2032
- Figure 60: Europe LA Workforce Management Software Industry Volume (K Unit), by Deployment Mode 2024 & 2032
- Figure 61: Europe LA Workforce Management Software Industry Revenue Share (%), by Deployment Mode 2024 & 2032
- Figure 62: Europe LA Workforce Management Software Industry Volume Share (%), by Deployment Mode 2024 & 2032
- Figure 63: Europe LA Workforce Management Software Industry Revenue (Million), by End-user Vertical 2024 & 2032
- Figure 64: Europe LA Workforce Management Software Industry Volume (K Unit), by End-user Vertical 2024 & 2032
- Figure 65: Europe LA Workforce Management Software Industry Revenue Share (%), by End-user Vertical 2024 & 2032
- Figure 66: Europe LA Workforce Management Software Industry Volume Share (%), by End-user Vertical 2024 & 2032
- Figure 67: Europe LA Workforce Management Software Industry Revenue (Million), by Country 2024 & 2032
- Figure 68: Europe LA Workforce Management Software Industry Volume (K Unit), by Country 2024 & 2032
- Figure 69: Europe LA Workforce Management Software Industry Revenue Share (%), by Country 2024 & 2032
- Figure 70: Europe LA Workforce Management Software Industry Volume Share (%), by Country 2024 & 2032
- Figure 71: Middle East & Africa LA Workforce Management Software Industry Revenue (Million), by Type 2024 & 2032
- Figure 72: Middle East & Africa LA Workforce Management Software Industry Volume (K Unit), by Type 2024 & 2032
- Figure 73: Middle East & Africa LA Workforce Management Software Industry Revenue Share (%), by Type 2024 & 2032
- Figure 74: Middle East & Africa LA Workforce Management Software Industry Volume Share (%), by Type 2024 & 2032
- Figure 75: Middle East & Africa LA Workforce Management Software Industry Revenue (Million), by Deployment Mode 2024 & 2032
- Figure 76: Middle East & Africa LA Workforce Management Software Industry Volume (K Unit), by Deployment Mode 2024 & 2032
- Figure 77: Middle East & Africa LA Workforce Management Software Industry Revenue Share (%), by Deployment Mode 2024 & 2032
- Figure 78: Middle East & Africa LA Workforce Management Software Industry Volume Share (%), by Deployment Mode 2024 & 2032
- Figure 79: Middle East & Africa LA Workforce Management Software Industry Revenue (Million), by End-user Vertical 2024 & 2032
- Figure 80: Middle East & Africa LA Workforce Management Software Industry Volume (K Unit), by End-user Vertical 2024 & 2032
- Figure 81: Middle East & Africa LA Workforce Management Software Industry Revenue Share (%), by End-user Vertical 2024 & 2032
- Figure 82: Middle East & Africa LA Workforce Management Software Industry Volume Share (%), by End-user Vertical 2024 & 2032
- Figure 83: Middle East & Africa LA Workforce Management Software Industry Revenue (Million), by Country 2024 & 2032
- Figure 84: Middle East & Africa LA Workforce Management Software Industry Volume (K Unit), by Country 2024 & 2032
- Figure 85: Middle East & Africa LA Workforce Management Software Industry Revenue Share (%), by Country 2024 & 2032
- Figure 86: Middle East & Africa LA Workforce Management Software Industry Volume Share (%), by Country 2024 & 2032
- Figure 87: Asia Pacific LA Workforce Management Software Industry Revenue (Million), by Type 2024 & 2032
- Figure 88: Asia Pacific LA Workforce Management Software Industry Volume (K Unit), by Type 2024 & 2032
- Figure 89: Asia Pacific LA Workforce Management Software Industry Revenue Share (%), by Type 2024 & 2032
- Figure 90: Asia Pacific LA Workforce Management Software Industry Volume Share (%), by Type 2024 & 2032
- Figure 91: Asia Pacific LA Workforce Management Software Industry Revenue (Million), by Deployment Mode 2024 & 2032
- Figure 92: Asia Pacific LA Workforce Management Software Industry Volume (K Unit), by Deployment Mode 2024 & 2032
- Figure 93: Asia Pacific LA Workforce Management Software Industry Revenue Share (%), by Deployment Mode 2024 & 2032
- Figure 94: Asia Pacific LA Workforce Management Software Industry Volume Share (%), by Deployment Mode 2024 & 2032
- Figure 95: Asia Pacific LA Workforce Management Software Industry Revenue (Million), by End-user Vertical 2024 & 2032
- Figure 96: Asia Pacific LA Workforce Management Software Industry Volume (K Unit), by End-user Vertical 2024 & 2032
- Figure 97: Asia Pacific LA Workforce Management Software Industry Revenue Share (%), by End-user Vertical 2024 & 2032
- Figure 98: Asia Pacific LA Workforce Management Software Industry Volume Share (%), by End-user Vertical 2024 & 2032
- Figure 99: Asia Pacific LA Workforce Management Software Industry Revenue (Million), by Country 2024 & 2032
- Figure 100: Asia Pacific LA Workforce Management Software Industry Volume (K Unit), by Country 2024 & 2032
- Figure 101: Asia Pacific LA Workforce Management Software Industry Revenue Share (%), by Country 2024 & 2032
- Figure 102: Asia Pacific LA Workforce Management Software Industry Volume Share (%), by Country 2024 & 2032
List of Tables
- Table 1: Global LA Workforce Management Software Industry Revenue Million Forecast, by Region 2019 & 2032
- Table 2: Global LA Workforce Management Software Industry Volume K Unit Forecast, by Region 2019 & 2032
- Table 3: Global LA Workforce Management Software Industry Revenue Million Forecast, by Type 2019 & 2032
- Table 4: Global LA Workforce Management Software Industry Volume K Unit Forecast, by Type 2019 & 2032
- Table 5: Global LA Workforce Management Software Industry Revenue Million Forecast, by Deployment Mode 2019 & 2032
- Table 6: Global LA Workforce Management Software Industry Volume K Unit Forecast, by Deployment Mode 2019 & 2032
- Table 7: Global LA Workforce Management Software Industry Revenue Million Forecast, by End-user Vertical 2019 & 2032
- Table 8: Global LA Workforce Management Software Industry Volume K Unit Forecast, by End-user Vertical 2019 & 2032
- Table 9: Global LA Workforce Management Software Industry Revenue Million Forecast, by Region 2019 & 2032
- Table 10: Global LA Workforce Management Software Industry Volume K Unit Forecast, by Region 2019 & 2032
- Table 11: Global LA Workforce Management Software Industry Revenue Million Forecast, by Country 2019 & 2032
- Table 12: Global LA Workforce Management Software Industry Volume K Unit Forecast, by Country 2019 & 2032
- Table 13: LA Workforce Management Software Industry Revenue (Million) Forecast, by Application 2019 & 2032
- Table 14: LA Workforce Management Software Industry Volume (K Unit) Forecast, by Application 2019 & 2032
- Table 15: Global LA Workforce Management Software Industry Revenue Million Forecast, by Country 2019 & 2032
- Table 16: Global LA Workforce Management Software Industry Volume K Unit Forecast, by Country 2019 & 2032
- Table 17: LA Workforce Management Software Industry Revenue (Million) Forecast, by Application 2019 & 2032
- Table 18: LA Workforce Management Software Industry Volume (K Unit) Forecast, by Application 2019 & 2032
- Table 19: Global LA Workforce Management Software Industry Revenue Million Forecast, by Country 2019 & 2032
- Table 20: Global LA Workforce Management Software Industry Volume K Unit Forecast, by Country 2019 & 2032
- Table 21: LA Workforce Management Software Industry Revenue (Million) Forecast, by Application 2019 & 2032
- Table 22: LA Workforce Management Software Industry Volume (K Unit) Forecast, by Application 2019 & 2032
- Table 23: Global LA Workforce Management Software Industry Revenue Million Forecast, by Country 2019 & 2032
- Table 24: Global LA Workforce Management Software Industry Volume K Unit Forecast, by Country 2019 & 2032
- Table 25: LA Workforce Management Software Industry Revenue (Million) Forecast, by Application 2019 & 2032
- Table 26: LA Workforce Management Software Industry Volume (K Unit) Forecast, by Application 2019 & 2032
- Table 27: Global LA Workforce Management Software Industry Revenue Million Forecast, by Country 2019 & 2032
- Table 28: Global LA Workforce Management Software Industry Volume K Unit Forecast, by Country 2019 & 2032
- Table 29: LA Workforce Management Software Industry Revenue (Million) Forecast, by Application 2019 & 2032
- Table 30: LA Workforce Management Software Industry Volume (K Unit) Forecast, by Application 2019 & 2032
- Table 31: Global LA Workforce Management Software Industry Revenue Million Forecast, by Type 2019 & 2032
- Table 32: Global LA Workforce Management Software Industry Volume K Unit Forecast, by Type 2019 & 2032
- Table 33: Global LA Workforce Management Software Industry Revenue Million Forecast, by Deployment Mode 2019 & 2032
- Table 34: Global LA Workforce Management Software Industry Volume K Unit Forecast, by Deployment Mode 2019 & 2032
- Table 35: Global LA Workforce Management Software Industry Revenue Million Forecast, by End-user Vertical 2019 & 2032
- Table 36: Global LA Workforce Management Software Industry Volume K Unit Forecast, by End-user Vertical 2019 & 2032
- Table 37: Global LA Workforce Management Software Industry Revenue Million Forecast, by Country 2019 & 2032
- Table 38: Global LA Workforce Management Software Industry Volume K Unit Forecast, by Country 2019 & 2032
- Table 39: United States LA Workforce Management Software Industry Revenue (Million) Forecast, by Application 2019 & 2032
- Table 40: United States LA Workforce Management Software Industry Volume (K Unit) Forecast, by Application 2019 & 2032
- Table 41: Canada LA Workforce Management Software Industry Revenue (Million) Forecast, by Application 2019 & 2032
- Table 42: Canada LA Workforce Management Software Industry Volume (K Unit) Forecast, by Application 2019 & 2032
- Table 43: Mexico LA Workforce Management Software Industry Revenue (Million) Forecast, by Application 2019 & 2032
- Table 44: Mexico LA Workforce Management Software Industry Volume (K Unit) Forecast, by Application 2019 & 2032
- Table 45: Global LA Workforce Management Software Industry Revenue Million Forecast, by Type 2019 & 2032
- Table 46: Global LA Workforce Management Software Industry Volume K Unit Forecast, by Type 2019 & 2032
- Table 47: Global LA Workforce Management Software Industry Revenue Million Forecast, by Deployment Mode 2019 & 2032
- Table 48: Global LA Workforce Management Software Industry Volume K Unit Forecast, by Deployment Mode 2019 & 2032
- Table 49: Global LA Workforce Management Software Industry Revenue Million Forecast, by End-user Vertical 2019 & 2032
- Table 50: Global LA Workforce Management Software Industry Volume K Unit Forecast, by End-user Vertical 2019 & 2032
- Table 51: Global LA Workforce Management Software Industry Revenue Million Forecast, by Country 2019 & 2032
- Table 52: Global LA Workforce Management Software Industry Volume K Unit Forecast, by Country 2019 & 2032
- Table 53: Brazil LA Workforce Management Software Industry Revenue (Million) Forecast, by Application 2019 & 2032
- Table 54: Brazil LA Workforce Management Software Industry Volume (K Unit) Forecast, by Application 2019 & 2032
- Table 55: Argentina LA Workforce Management Software Industry Revenue (Million) Forecast, by Application 2019 & 2032
- Table 56: Argentina LA Workforce Management Software Industry Volume (K Unit) Forecast, by Application 2019 & 2032
- Table 57: Rest of South America LA Workforce Management Software Industry Revenue (Million) Forecast, by Application 2019 & 2032
- Table 58: Rest of South America LA Workforce Management Software Industry Volume (K Unit) Forecast, by Application 2019 & 2032
- Table 59: Global LA Workforce Management Software Industry Revenue Million Forecast, by Type 2019 & 2032
- Table 60: Global LA Workforce Management Software Industry Volume K Unit Forecast, by Type 2019 & 2032
- Table 61: Global LA Workforce Management Software Industry Revenue Million Forecast, by Deployment Mode 2019 & 2032
- Table 62: Global LA Workforce Management Software Industry Volume K Unit Forecast, by Deployment Mode 2019 & 2032
- Table 63: Global LA Workforce Management Software Industry Revenue Million Forecast, by End-user Vertical 2019 & 2032
- Table 64: Global LA Workforce Management Software Industry Volume K Unit Forecast, by End-user Vertical 2019 & 2032
- Table 65: Global LA Workforce Management Software Industry Revenue Million Forecast, by Country 2019 & 2032
- Table 66: Global LA Workforce Management Software Industry Volume K Unit Forecast, by Country 2019 & 2032
- Table 67: United Kingdom LA Workforce Management Software Industry Revenue (Million) Forecast, by Application 2019 & 2032
- Table 68: United Kingdom LA Workforce Management Software Industry Volume (K Unit) Forecast, by Application 2019 & 2032
- Table 69: Germany LA Workforce Management Software Industry Revenue (Million) Forecast, by Application 2019 & 2032
- Table 70: Germany LA Workforce Management Software Industry Volume (K Unit) Forecast, by Application 2019 & 2032
- Table 71: France LA Workforce Management Software Industry Revenue (Million) Forecast, by Application 2019 & 2032
- Table 72: France LA Workforce Management Software Industry Volume (K Unit) Forecast, by Application 2019 & 2032
- Table 73: Italy LA Workforce Management Software Industry Revenue (Million) Forecast, by Application 2019 & 2032
- Table 74: Italy LA Workforce Management Software Industry Volume (K Unit) Forecast, by Application 2019 & 2032
- Table 75: Spain LA Workforce Management Software Industry Revenue (Million) Forecast, by Application 2019 & 2032
- Table 76: Spain LA Workforce Management Software Industry Volume (K Unit) Forecast, by Application 2019 & 2032
- Table 77: Russia LA Workforce Management Software Industry Revenue (Million) Forecast, by Application 2019 & 2032
- Table 78: Russia LA Workforce Management Software Industry Volume (K Unit) Forecast, by Application 2019 & 2032
- Table 79: Benelux LA Workforce Management Software Industry Revenue (Million) Forecast, by Application 2019 & 2032
- Table 80: Benelux LA Workforce Management Software Industry Volume (K Unit) Forecast, by Application 2019 & 2032
- Table 81: Nordics LA Workforce Management Software Industry Revenue (Million) Forecast, by Application 2019 & 2032
- Table 82: Nordics LA Workforce Management Software Industry Volume (K Unit) Forecast, by Application 2019 & 2032
- Table 83: Rest of Europe LA Workforce Management Software Industry Revenue (Million) Forecast, by Application 2019 & 2032
- Table 84: Rest of Europe LA Workforce Management Software Industry Volume (K Unit) Forecast, by Application 2019 & 2032
- Table 85: Global LA Workforce Management Software Industry Revenue Million Forecast, by Type 2019 & 2032
- Table 86: Global LA Workforce Management Software Industry Volume K Unit Forecast, by Type 2019 & 2032
- Table 87: Global LA Workforce Management Software Industry Revenue Million Forecast, by Deployment Mode 2019 & 2032
- Table 88: Global LA Workforce Management Software Industry Volume K Unit Forecast, by Deployment Mode 2019 & 2032
- Table 89: Global LA Workforce Management Software Industry Revenue Million Forecast, by End-user Vertical 2019 & 2032
- Table 90: Global LA Workforce Management Software Industry Volume K Unit Forecast, by End-user Vertical 2019 & 2032
- Table 91: Global LA Workforce Management Software Industry Revenue Million Forecast, by Country 2019 & 2032
- Table 92: Global LA Workforce Management Software Industry Volume K Unit Forecast, by Country 2019 & 2032
- Table 93: Turkey LA Workforce Management Software Industry Revenue (Million) Forecast, by Application 2019 & 2032
- Table 94: Turkey LA Workforce Management Software Industry Volume (K Unit) Forecast, by Application 2019 & 2032
- Table 95: Israel LA Workforce Management Software Industry Revenue (Million) Forecast, by Application 2019 & 2032
- Table 96: Israel LA Workforce Management Software Industry Volume (K Unit) Forecast, by Application 2019 & 2032
- Table 97: GCC LA Workforce Management Software Industry Revenue (Million) Forecast, by Application 2019 & 2032
- Table 98: GCC LA Workforce Management Software Industry Volume (K Unit) Forecast, by Application 2019 & 2032
- Table 99: North Africa LA Workforce Management Software Industry Revenue (Million) Forecast, by Application 2019 & 2032
- Table 100: North Africa LA Workforce Management Software Industry Volume (K Unit) Forecast, by Application 2019 & 2032
- Table 101: South Africa LA Workforce Management Software Industry Revenue (Million) Forecast, by Application 2019 & 2032
- Table 102: South Africa LA Workforce Management Software Industry Volume (K Unit) Forecast, by Application 2019 & 2032
- Table 103: Rest of Middle East & Africa LA Workforce Management Software Industry Revenue (Million) Forecast, by Application 2019 & 2032
- Table 104: Rest of Middle East & Africa LA Workforce Management Software Industry Volume (K Unit) Forecast, by Application 2019 & 2032
- Table 105: Global LA Workforce Management Software Industry Revenue Million Forecast, by Type 2019 & 2032
- Table 106: Global LA Workforce Management Software Industry Volume K Unit Forecast, by Type 2019 & 2032
- Table 107: Global LA Workforce Management Software Industry Revenue Million Forecast, by Deployment Mode 2019 & 2032
- Table 108: Global LA Workforce Management Software Industry Volume K Unit Forecast, by Deployment Mode 2019 & 2032
- Table 109: Global LA Workforce Management Software Industry Revenue Million Forecast, by End-user Vertical 2019 & 2032
- Table 110: Global LA Workforce Management Software Industry Volume K Unit Forecast, by End-user Vertical 2019 & 2032
- Table 111: Global LA Workforce Management Software Industry Revenue Million Forecast, by Country 2019 & 2032
- Table 112: Global LA Workforce Management Software Industry Volume K Unit Forecast, by Country 2019 & 2032
- Table 113: China LA Workforce Management Software Industry Revenue (Million) Forecast, by Application 2019 & 2032
- Table 114: China LA Workforce Management Software Industry Volume (K Unit) Forecast, by Application 2019 & 2032
- Table 115: India LA Workforce Management Software Industry Revenue (Million) Forecast, by Application 2019 & 2032
- Table 116: India LA Workforce Management Software Industry Volume (K Unit) Forecast, by Application 2019 & 2032
- Table 117: Japan LA Workforce Management Software Industry Revenue (Million) Forecast, by Application 2019 & 2032
- Table 118: Japan LA Workforce Management Software Industry Volume (K Unit) Forecast, by Application 2019 & 2032
- Table 119: South Korea LA Workforce Management Software Industry Revenue (Million) Forecast, by Application 2019 & 2032
- Table 120: South Korea LA Workforce Management Software Industry Volume (K Unit) Forecast, by Application 2019 & 2032
- Table 121: ASEAN LA Workforce Management Software Industry Revenue (Million) Forecast, by Application 2019 & 2032
- Table 122: ASEAN LA Workforce Management Software Industry Volume (K Unit) Forecast, by Application 2019 & 2032
- Table 123: Oceania LA Workforce Management Software Industry Revenue (Million) Forecast, by Application 2019 & 2032
- Table 124: Oceania LA Workforce Management Software Industry Volume (K Unit) Forecast, by Application 2019 & 2032
- Table 125: Rest of Asia Pacific LA Workforce Management Software Industry Revenue (Million) Forecast, by Application 2019 & 2032
- Table 126: Rest of Asia Pacific LA Workforce Management Software Industry Volume (K Unit) Forecast, by Application 2019 & 2032
Frequently Asked Questions
1. What is the projected Compound Annual Growth Rate (CAGR) of the LA Workforce Management Software Industry?
The projected CAGR is approximately 5.48%.
2. Which companies are prominent players in the LA Workforce Management Software Industry?
Key companies in the market include Workday Inc, Reflexis Systems Inc, NICE Systems Ltd, Roubler UK Limited Company, IBM Corporation, Blue Yonder Group Inc, Active Operations Management International LLP, Sage Group PLC, Kronos Incorporated, 7shifts, ServiceMax Inc, Infor Group, Atoss Software AG, Oracle Corporation, ADP LLC, Tamigo UK Ltd, SISQUAL, WorkForce Software LLC, SAP SE, Mitrefinch Ltd, Kirona Solutions Limited.
3. What are the main segments of the LA Workforce Management Software Industry?
The market segments include Type, Deployment Mode, End-user Vertical.
4. Can you provide details about the market size?
The market size is estimated to be USD XX Million as of 2022.
5. What are some drivers contributing to market growth?
Increasing Adoption of Internet of Things (IoT) and Cloud-based Solutions Expanding the Market; Growing Adoption of Analytical Solutions and WFM by SMEs Driving Market Growth.
6. What are the notable trends driving market growth?
Retail and Consumer Goods to Hold the Largest Market Share.
7. Are there any restraints impacting market growth?
; Availability of open-source alternatives.
8. Can you provide examples of recent developments in the market?
N/A
9. What pricing options are available for accessing the report?
Pricing options include single-user, multi-user, and enterprise licenses priced at USD 4750, USD 4950, and USD 6800 respectively.
10. Is the market size provided in terms of value or volume?
The market size is provided in terms of value, measured in Million and volume, measured in K Unit.
11. Are there any specific market keywords associated with the report?
Yes, the market keyword associated with the report is "LA Workforce Management Software Industry," which aids in identifying and referencing the specific market segment covered.
12. How do I determine which pricing option suits my needs best?
The pricing options vary based on user requirements and access needs. Individual users may opt for single-user licenses, while businesses requiring broader access may choose multi-user or enterprise licenses for cost-effective access to the report.
13. Are there any additional resources or data provided in the LA Workforce Management Software Industry report?
While the report offers comprehensive insights, it's advisable to review the specific contents or supplementary materials provided to ascertain if additional resources or data are available.
14. How can I stay updated on further developments or reports in the LA Workforce Management Software Industry?
To stay informed about further developments, trends, and reports in the LA Workforce Management Software Industry, consider subscribing to industry newsletters, following relevant companies and organizations, or regularly checking reputable industry news sources and publications.
Methodology
Step 1 - Identification of Relevant Samples Size from Population Database


Step 2 - Approaches for Defining Global Market Size (Value, Volume* & Price*)

Note*: In applicable scenarios
Step 3 - Data Sources
Primary Research
- Web Analytics
- Survey Reports
- Research Institute
- Latest Research Reports
- Opinion Leaders
Secondary Research
- Annual Reports
- White Paper
- Latest Press Release
- Industry Association
- Paid Database
- Investor Presentations

Step 4 - Data Triangulation
Involves using different sources of information in order to increase the validity of a study
These sources are likely to be stakeholders in a program - participants, other researchers, program staff, other community members, and so on.
Then we put all data in single framework & apply various statistical tools to find out the dynamic on the market.
During the analysis stage, feedback from the stakeholder groups would be compared to determine areas of agreement as well as areas of divergence


