
Key Insights
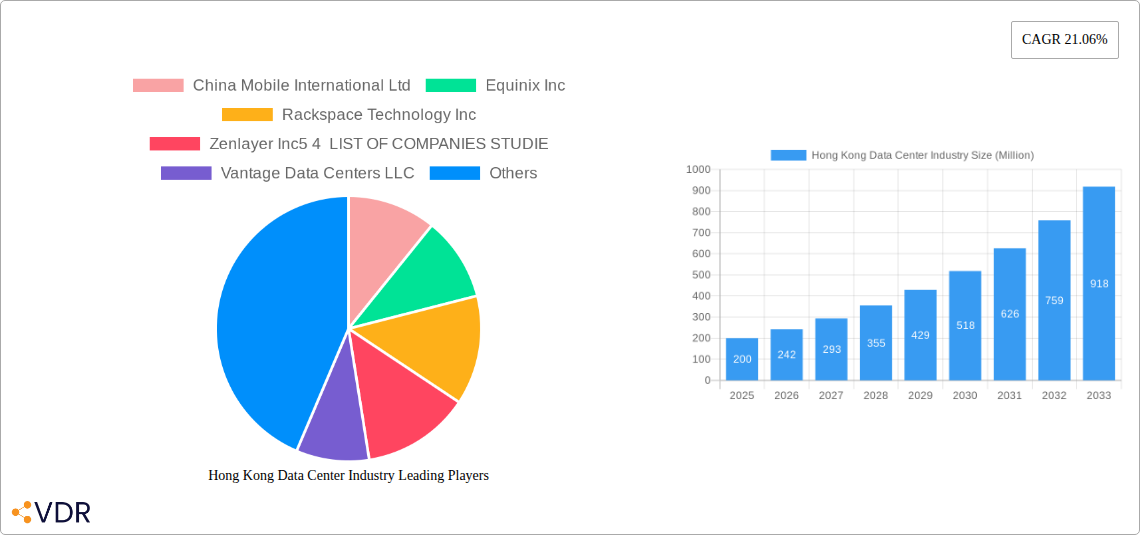
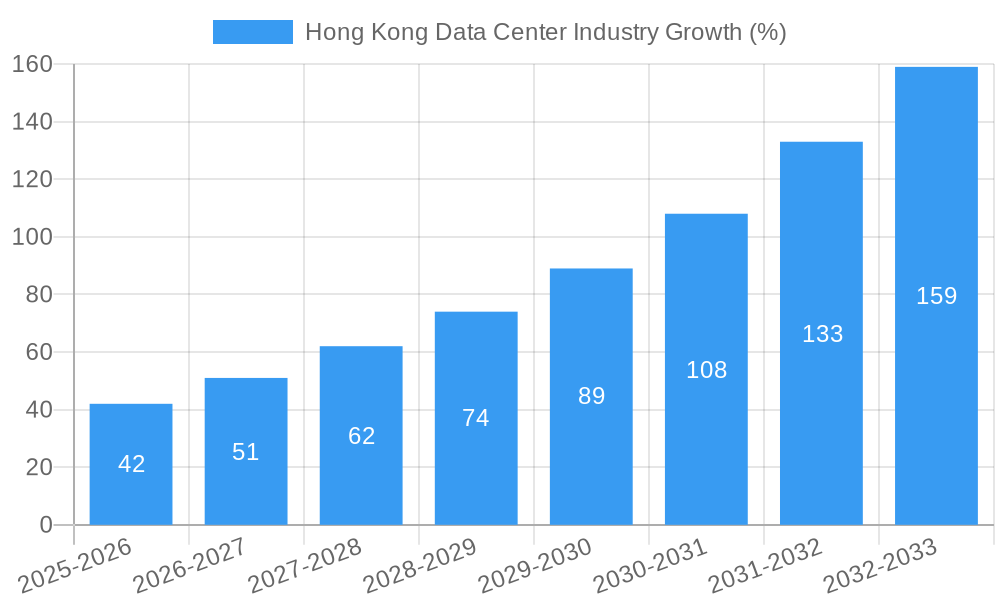
The Hong Kong data center market, valued at approximately $XX million in 2025, is experiencing robust growth, projected to expand at a compound annual growth rate (CAGR) of 21.06% from 2025 to 2033. This surge is driven by several key factors. The increasing adoption of cloud computing and digital transformation initiatives across various sectors, including finance, technology, and retail, fuels the demand for robust and reliable data center infrastructure. Furthermore, Hong Kong's strategic geographic location as a crucial hub connecting Asia and the rest of the world, coupled with its robust regulatory environment and skilled workforce, makes it an attractive destination for data center investments. The market is segmented by Tier type (Tier 1, Tier 2, Tier 3, Tier 4), absorption (utilized, non-utilized), end-user (e.g., financial institutions, telecom companies), and data center size (small, medium, mega, massive). Key hotspots include Chai Wan, Shatin, Tseun Wan, and Tseung Kwan O, reflecting the concentration of infrastructure and connectivity in these areas. While the market faces potential constraints such as land scarcity and increasing energy costs, the overall outlook remains positive, driven by continued technological advancements and the growing digital economy.
The competitive landscape features a mix of global giants like Equinix, Digital Realty, and NTT Ltd., alongside regional players such as SunneVision Holdings and BDx Data Center. These companies are vying for market share by offering diverse solutions catering to specific customer needs, ranging from colocation services to hyperscale data center deployments. The forecast period suggests significant expansion, with projected growth driven by the increasing demand for edge computing to support low-latency applications, the rise of 5G networks, and the growing adoption of artificial intelligence and machine learning, all of which require considerable data center capacity. The sustained economic growth in Hong Kong, coupled with government support for digital infrastructure development, further strengthens the market's positive outlook.
Hong Kong Data Center Industry: Market Analysis & Forecast 2019-2033
This comprehensive report provides a detailed analysis of the Hong Kong data center industry, covering market dynamics, growth trends, key players, and future outlook. The study period spans from 2019 to 2033, with 2025 as the base and estimated year. This report is crucial for investors, industry professionals, and strategists seeking to understand and capitalize on the opportunities within this rapidly evolving market.
Hong Kong Data Center Industry Market Dynamics & Structure
This section analyzes the Hong Kong data center market's structure, focusing on market concentration, technological advancements, regulatory landscapes, competitive dynamics, end-user demographics, and merger & acquisition (M&A) activity. The Hong Kong data center market is experiencing significant growth fueled by the region's strategic location, robust digital economy, and increasing demand for cloud services.
- Market Concentration: The market exhibits a moderately concentrated structure with a few major players controlling a significant share. xx% of the market is held by the top 5 players (estimated).
- Technological Innovation: The adoption of advanced technologies such as AI, edge computing, and 5G is driving innovation and enhancing data center capabilities. However, high infrastructure costs and skilled labor shortages present challenges.
- Regulatory Framework: The government's supportive policies towards digital infrastructure development foster industry growth. However, stringent data privacy regulations and licensing requirements impact operational costs.
- Competitive Landscape: Intense competition exists among established players and new entrants, leading to pricing pressures and service differentiation strategies.
- End-User Demographics: The primary end-users include cloud service providers (CSPs), telecommunication companies, financial institutions, and enterprises across various sectors.
- M&A Trends: The past five years have witnessed several significant M&A activities, including the potential USD 11 billion sale of Global Switch (August 2022). The total M&A deal volume is estimated at xx Million USD during the historical period (2019-2024).
Hong Kong Data Center Industry Growth Trends & Insights
This section delves into the growth trajectory of the Hong Kong data center market. Utilizing rigorous data analysis, it explores market size evolution, adoption rates, technological disruptions, and consumer behavior shifts. The market exhibited a CAGR of xx% during the historical period (2019-2024) and is projected to maintain a CAGR of xx% during the forecast period (2025-2033). Market penetration of cloud services is increasing steadily, leading to higher demand for data center capacity. Significant technological disruptions, such as the rise of hyperscale data centers and the increasing adoption of edge computing, are reshaping the landscape. Consumer behavior is shifting towards greater reliance on cloud-based services, further fueling data center growth. The total market size in 2024 was estimated at xx Million USD, and it is projected to reach xx Million USD by 2033.
Dominant Regions, Countries, or Segments in Hong Kong Data Center Industry
This section identifies the leading regions, countries, or segments within the Hong Kong data center market driving its growth. The hotspots of Chai Wan, Shatin, Tseun Wan, and Tseung Kwan O are attracting significant investments due to their proximity to major connectivity hubs and infrastructure.
- Tier Type: Tier 1 and Tier 3 facilities dominate the market due to their higher resilience and capacity, capturing an estimated xx% market share.
- Absorption: Utilized capacity consistently outpaces non-utilized capacity, reflecting strong market demand.
- Data Center Size: Large and Mega data centers lead the market, catering to the increasing demand from hyperscale providers and large enterprises.
- Other End Users: The financial sector is a significant driver, with increasing investment in advanced technologies driving demand for sophisticated data center infrastructure.
- Key Drivers: Government initiatives supporting digital infrastructure development, strategic location, strong connectivity, and robust business environment are key growth drivers.
Hong Kong Data Center Industry Product Landscape
The Hong Kong data center industry offers a range of products and services, including colocation, cloud services, managed services, and interconnection solutions. Continuous innovation is evident in the development of higher-density racks, improved cooling systems, and enhanced security features. Unique selling propositions for providers often center on location advantages, connectivity options, and customized service offerings. Technological advancements focus on improving energy efficiency, increasing capacity, and enhancing security.
Key Drivers, Barriers & Challenges in Hong Kong Data Center Industry
Key Drivers:
- Increasing adoption of cloud computing and big data analytics.
- Government support for digital economy development.
- Strong connectivity and strategic geographical location.
Challenges and Restraints:
- High land and construction costs limit expansion.
- Skilled labor shortages impacting operations.
- Stringent environmental regulations and energy costs. The impact is estimated to reduce the market growth by xx% in the forecast period.
Emerging Opportunities in Hong Kong Data Center Industry
- Growth in edge computing deployments.
- Expanding demand for 5G infrastructure.
- Rise of hybrid and multi-cloud strategies.
- Increasing adoption of AI and machine learning.
Growth Accelerators in the Hong Kong Data Center Industry Industry
Several factors are poised to accelerate the growth of Hong Kong’s data center industry. Strategic partnerships between data center providers and technology companies are fostering innovation and driving market expansion. Government incentives and investments in digital infrastructure continue to attract significant investments. The growing demand for high-bandwidth applications and cloud-based services provides substantial growth momentum.
Key Players Shaping the Hong Kong Data Center Industry Market
- China Mobile International Ltd
- Equinix Inc
- Rackspace Technology Inc
- Zenlayer Inc
- Vantage Data Centers LLC
- SuneVision Holdings Ltd
- Digital Realty Trust Inc
- AirTrunk Operating Pty Ltd
- Hostdime
- BDx Data Center Pte Ltd
- Global Switch Holdings Limited
- NTT Ltd
Notable Milestones in Hong Kong Data Center Industry Sector
- November 2022: A company (unnamed in original prompt) opened a new regional office in Kowloon, expanding its APAC operations.
- November 2022: BDx launched its Indonesia operations following a USD 300 million joint venture.
- August 2022: Global Switch announced plans to sell its USD 11 billion business.
In-Depth Hong Kong Data Center Industry Market Outlook
The Hong Kong data center market is poised for sustained growth driven by increasing digitalization, expanding cloud adoption, and supportive government policies. Strategic investments in advanced technologies and infrastructure will further enhance the market's capabilities and attract additional investments. The long-term outlook remains positive, presenting significant opportunities for existing and new market players.
Hong Kong Data Center Industry Segmentation
-
1. Hotspot
- 1.1. Chai Wan
- 1.2. Shatin
- 1.3. Tseun Wan
- 1.4. Tseung Kwan O
- 1.5. Rest of Hong Kong
-
2. Data Center Size
- 2.1. Large
- 2.2. Massive
- 2.3. Medium
- 2.4. Mega
- 2.5. Small
-
3. Tier Type
- 3.1. Tier 1 and 2
- 3.2. Tier 3
- 3.3. Tier 4
-
4. Absorption
- 4.1. Non-Utilized
-
5. Colocation Type
- 5.1. Hyperscale
- 5.2. Retail
- 5.3. Wholesale
-
6. End User
- 6.1. BFSI
- 6.2. Cloud
- 6.3. E-Commerce
- 6.4. Government
- 6.5. Manufacturing
- 6.6. Media & Entertainment
- 6.7. Telecom
- 6.8. Other End User
Hong Kong Data Center Industry Segmentation By Geography
-
1. North America
- 1.1. United States
- 1.2. Canada
- 1.3. Mexico
-
2. South America
- 2.1. Brazil
- 2.2. Argentina
- 2.3. Rest of South America
-
3. Europe
- 3.1. United Kingdom
- 3.2. Germany
- 3.3. France
- 3.4. Italy
- 3.5. Spain
- 3.6. Russia
- 3.7. Benelux
- 3.8. Nordics
- 3.9. Rest of Europe
-
4. Middle East & Africa
- 4.1. Turkey
- 4.2. Israel
- 4.3. GCC
- 4.4. North Africa
- 4.5. South Africa
- 4.6. Rest of Middle East & Africa
-
5. Asia Pacific
- 5.1. China
- 5.2. India
- 5.3. Japan
- 5.4. South Korea
- 5.5. ASEAN
- 5.6. Oceania
- 5.7. Rest of Asia Pacific
Hong Kong Data Center Industry REPORT HIGHLIGHTS
| Aspects | Details |
|---|---|
| Study Period | 2019-2033 |
| Base Year | 2024 |
| Estimated Year | 2025 |
| Forecast Period | 2025-2033 |
| Historical Period | 2019-2024 |
| Growth Rate | CAGR of 21.06% from 2019-2033 |
| Segmentation |
|
Table of Contents
- 1. Introduction
- 1.1. Research Scope
- 1.2. Market Segmentation
- 1.3. Research Methodology
- 1.4. Definitions and Assumptions
- 2. Executive Summary
- 2.1. Introduction
- 3. Market Dynamics
- 3.1. Introduction
- 3.2. Market Drivers
- 3.2.1. Rise of E-Commerce; Flourishing Startup Culture
- 3.3. Market Restrains
- 3.3.1. Slow Penetration Rate in Developing Countries
- 3.4. Market Trends
- 3.4.1. OTHER KEY INDUSTRY TRENDS COVERED IN THE REPORT
- 4. Market Factor Analysis
- 4.1. Porters Five Forces
- 4.2. Supply/Value Chain
- 4.3. PESTEL analysis
- 4.4. Market Entropy
- 4.5. Patent/Trademark Analysis
- 5. Global Hong Kong Data Center Industry Analysis, Insights and Forecast, 2019-2031
- 5.1. Market Analysis, Insights and Forecast - by Hotspot
- 5.1.1. Chai Wan
- 5.1.2. Shatin
- 5.1.3. Tseun Wan
- 5.1.4. Tseung Kwan O
- 5.1.5. Rest of Hong Kong
- 5.2. Market Analysis, Insights and Forecast - by Data Center Size
- 5.2.1. Large
- 5.2.2. Massive
- 5.2.3. Medium
- 5.2.4. Mega
- 5.2.5. Small
- 5.3. Market Analysis, Insights and Forecast - by Tier Type
- 5.3.1. Tier 1 and 2
- 5.3.2. Tier 3
- 5.3.3. Tier 4
- 5.4. Market Analysis, Insights and Forecast - by Absorption
- 5.4.1. Non-Utilized
- 5.5. Market Analysis, Insights and Forecast - by Colocation Type
- 5.5.1. Hyperscale
- 5.5.2. Retail
- 5.5.3. Wholesale
- 5.6. Market Analysis, Insights and Forecast - by End User
- 5.6.1. BFSI
- 5.6.2. Cloud
- 5.6.3. E-Commerce
- 5.6.4. Government
- 5.6.5. Manufacturing
- 5.6.6. Media & Entertainment
- 5.6.7. Telecom
- 5.6.8. Other End User
- 5.7. Market Analysis, Insights and Forecast - by Region
- 5.7.1. North America
- 5.7.2. South America
- 5.7.3. Europe
- 5.7.4. Middle East & Africa
- 5.7.5. Asia Pacific
- 5.1. Market Analysis, Insights and Forecast - by Hotspot
- 6. North America Hong Kong Data Center Industry Analysis, Insights and Forecast, 2019-2031
- 6.1. Market Analysis, Insights and Forecast - by Hotspot
- 6.1.1. Chai Wan
- 6.1.2. Shatin
- 6.1.3. Tseun Wan
- 6.1.4. Tseung Kwan O
- 6.1.5. Rest of Hong Kong
- 6.2. Market Analysis, Insights and Forecast - by Data Center Size
- 6.2.1. Large
- 6.2.2. Massive
- 6.2.3. Medium
- 6.2.4. Mega
- 6.2.5. Small
- 6.3. Market Analysis, Insights and Forecast - by Tier Type
- 6.3.1. Tier 1 and 2
- 6.3.2. Tier 3
- 6.3.3. Tier 4
- 6.4. Market Analysis, Insights and Forecast - by Absorption
- 6.4.1. Non-Utilized
- 6.5. Market Analysis, Insights and Forecast - by Colocation Type
- 6.5.1. Hyperscale
- 6.5.2. Retail
- 6.5.3. Wholesale
- 6.6. Market Analysis, Insights and Forecast - by End User
- 6.6.1. BFSI
- 6.6.2. Cloud
- 6.6.3. E-Commerce
- 6.6.4. Government
- 6.6.5. Manufacturing
- 6.6.6. Media & Entertainment
- 6.6.7. Telecom
- 6.6.8. Other End User
- 6.1. Market Analysis, Insights and Forecast - by Hotspot
- 7. South America Hong Kong Data Center Industry Analysis, Insights and Forecast, 2019-2031
- 7.1. Market Analysis, Insights and Forecast - by Hotspot
- 7.1.1. Chai Wan
- 7.1.2. Shatin
- 7.1.3. Tseun Wan
- 7.1.4. Tseung Kwan O
- 7.1.5. Rest of Hong Kong
- 7.2. Market Analysis, Insights and Forecast - by Data Center Size
- 7.2.1. Large
- 7.2.2. Massive
- 7.2.3. Medium
- 7.2.4. Mega
- 7.2.5. Small
- 7.3. Market Analysis, Insights and Forecast - by Tier Type
- 7.3.1. Tier 1 and 2
- 7.3.2. Tier 3
- 7.3.3. Tier 4
- 7.4. Market Analysis, Insights and Forecast - by Absorption
- 7.4.1. Non-Utilized
- 7.5. Market Analysis, Insights and Forecast - by Colocation Type
- 7.5.1. Hyperscale
- 7.5.2. Retail
- 7.5.3. Wholesale
- 7.6. Market Analysis, Insights and Forecast - by End User
- 7.6.1. BFSI
- 7.6.2. Cloud
- 7.6.3. E-Commerce
- 7.6.4. Government
- 7.6.5. Manufacturing
- 7.6.6. Media & Entertainment
- 7.6.7. Telecom
- 7.6.8. Other End User
- 7.1. Market Analysis, Insights and Forecast - by Hotspot
- 8. Europe Hong Kong Data Center Industry Analysis, Insights and Forecast, 2019-2031
- 8.1. Market Analysis, Insights and Forecast - by Hotspot
- 8.1.1. Chai Wan
- 8.1.2. Shatin
- 8.1.3. Tseun Wan
- 8.1.4. Tseung Kwan O
- 8.1.5. Rest of Hong Kong
- 8.2. Market Analysis, Insights and Forecast - by Data Center Size
- 8.2.1. Large
- 8.2.2. Massive
- 8.2.3. Medium
- 8.2.4. Mega
- 8.2.5. Small
- 8.3. Market Analysis, Insights and Forecast - by Tier Type
- 8.3.1. Tier 1 and 2
- 8.3.2. Tier 3
- 8.3.3. Tier 4
- 8.4. Market Analysis, Insights and Forecast - by Absorption
- 8.4.1. Non-Utilized
- 8.5. Market Analysis, Insights and Forecast - by Colocation Type
- 8.5.1. Hyperscale
- 8.5.2. Retail
- 8.5.3. Wholesale
- 8.6. Market Analysis, Insights and Forecast - by End User
- 8.6.1. BFSI
- 8.6.2. Cloud
- 8.6.3. E-Commerce
- 8.6.4. Government
- 8.6.5. Manufacturing
- 8.6.6. Media & Entertainment
- 8.6.7. Telecom
- 8.6.8. Other End User
- 8.1. Market Analysis, Insights and Forecast - by Hotspot
- 9. Middle East & Africa Hong Kong Data Center Industry Analysis, Insights and Forecast, 2019-2031
- 9.1. Market Analysis, Insights and Forecast - by Hotspot
- 9.1.1. Chai Wan
- 9.1.2. Shatin
- 9.1.3. Tseun Wan
- 9.1.4. Tseung Kwan O
- 9.1.5. Rest of Hong Kong
- 9.2. Market Analysis, Insights and Forecast - by Data Center Size
- 9.2.1. Large
- 9.2.2. Massive
- 9.2.3. Medium
- 9.2.4. Mega
- 9.2.5. Small
- 9.3. Market Analysis, Insights and Forecast - by Tier Type
- 9.3.1. Tier 1 and 2
- 9.3.2. Tier 3
- 9.3.3. Tier 4
- 9.4. Market Analysis, Insights and Forecast - by Absorption
- 9.4.1. Non-Utilized
- 9.5. Market Analysis, Insights and Forecast - by Colocation Type
- 9.5.1. Hyperscale
- 9.5.2. Retail
- 9.5.3. Wholesale
- 9.6. Market Analysis, Insights and Forecast - by End User
- 9.6.1. BFSI
- 9.6.2. Cloud
- 9.6.3. E-Commerce
- 9.6.4. Government
- 9.6.5. Manufacturing
- 9.6.6. Media & Entertainment
- 9.6.7. Telecom
- 9.6.8. Other End User
- 9.1. Market Analysis, Insights and Forecast - by Hotspot
- 10. Asia Pacific Hong Kong Data Center Industry Analysis, Insights and Forecast, 2019-2031
- 10.1. Market Analysis, Insights and Forecast - by Hotspot
- 10.1.1. Chai Wan
- 10.1.2. Shatin
- 10.1.3. Tseun Wan
- 10.1.4. Tseung Kwan O
- 10.1.5. Rest of Hong Kong
- 10.2. Market Analysis, Insights and Forecast - by Data Center Size
- 10.2.1. Large
- 10.2.2. Massive
- 10.2.3. Medium
- 10.2.4. Mega
- 10.2.5. Small
- 10.3. Market Analysis, Insights and Forecast - by Tier Type
- 10.3.1. Tier 1 and 2
- 10.3.2. Tier 3
- 10.3.3. Tier 4
- 10.4. Market Analysis, Insights and Forecast - by Absorption
- 10.4.1. Non-Utilized
- 10.5. Market Analysis, Insights and Forecast - by Colocation Type
- 10.5.1. Hyperscale
- 10.5.2. Retail
- 10.5.3. Wholesale
- 10.6. Market Analysis, Insights and Forecast - by End User
- 10.6.1. BFSI
- 10.6.2. Cloud
- 10.6.3. E-Commerce
- 10.6.4. Government
- 10.6.5. Manufacturing
- 10.6.6. Media & Entertainment
- 10.6.7. Telecom
- 10.6.8. Other End User
- 10.1. Market Analysis, Insights and Forecast - by Hotspot
- 11. Competitive Analysis
- 11.1. Global Market Share Analysis 2024
- 11.2. Company Profiles
- 11.2.1 China Mobile International Ltd
- 11.2.1.1. Overview
- 11.2.1.2. Products
- 11.2.1.3. SWOT Analysis
- 11.2.1.4. Recent Developments
- 11.2.1.5. Financials (Based on Availability)
- 11.2.2 Equinix Inc
- 11.2.2.1. Overview
- 11.2.2.2. Products
- 11.2.2.3. SWOT Analysis
- 11.2.2.4. Recent Developments
- 11.2.2.5. Financials (Based on Availability)
- 11.2.3 Rackspace Technology Inc
- 11.2.3.1. Overview
- 11.2.3.2. Products
- 11.2.3.3. SWOT Analysis
- 11.2.3.4. Recent Developments
- 11.2.3.5. Financials (Based on Availability)
- 11.2.4 Zenlayer Inc5 4 LIST OF COMPANIES STUDIE
- 11.2.4.1. Overview
- 11.2.4.2. Products
- 11.2.4.3. SWOT Analysis
- 11.2.4.4. Recent Developments
- 11.2.4.5. Financials (Based on Availability)
- 11.2.5 Vantage Data Centers LLC
- 11.2.5.1. Overview
- 11.2.5.2. Products
- 11.2.5.3. SWOT Analysis
- 11.2.5.4. Recent Developments
- 11.2.5.5. Financials (Based on Availability)
- 11.2.6 SuneVision Holdings Ltd
- 11.2.6.1. Overview
- 11.2.6.2. Products
- 11.2.6.3. SWOT Analysis
- 11.2.6.4. Recent Developments
- 11.2.6.5. Financials (Based on Availability)
- 11.2.7 Digital Realty Trust Inc
- 11.2.7.1. Overview
- 11.2.7.2. Products
- 11.2.7.3. SWOT Analysis
- 11.2.7.4. Recent Developments
- 11.2.7.5. Financials (Based on Availability)
- 11.2.8 AirTrunk Operating Pty Ltd
- 11.2.8.1. Overview
- 11.2.8.2. Products
- 11.2.8.3. SWOT Analysis
- 11.2.8.4. Recent Developments
- 11.2.8.5. Financials (Based on Availability)
- 11.2.9 Hostdime
- 11.2.9.1. Overview
- 11.2.9.2. Products
- 11.2.9.3. SWOT Analysis
- 11.2.9.4. Recent Developments
- 11.2.9.5. Financials (Based on Availability)
- 11.2.10 BDx Data Center Pte Ltd
- 11.2.10.1. Overview
- 11.2.10.2. Products
- 11.2.10.3. SWOT Analysis
- 11.2.10.4. Recent Developments
- 11.2.10.5. Financials (Based on Availability)
- 11.2.11 Global Switch Holdings Limited
- 11.2.11.1. Overview
- 11.2.11.2. Products
- 11.2.11.3. SWOT Analysis
- 11.2.11.4. Recent Developments
- 11.2.11.5. Financials (Based on Availability)
- 11.2.12 NTT Ltd
- 11.2.12.1. Overview
- 11.2.12.2. Products
- 11.2.12.3. SWOT Analysis
- 11.2.12.4. Recent Developments
- 11.2.12.5. Financials (Based on Availability)
- 11.2.1 China Mobile International Ltd
List of Figures
- Figure 1: Global Hong Kong Data Center Industry Revenue Breakdown (Million, %) by Region 2024 & 2032
- Figure 2: Global Hong Kong Data Center Industry Volume Breakdown (K Unit, %) by Region 2024 & 2032
- Figure 3: Hong Kong Hong Kong Data Center Industry Revenue (Million), by Country 2024 & 2032
- Figure 4: Hong Kong Hong Kong Data Center Industry Volume (K Unit), by Country 2024 & 2032
- Figure 5: Hong Kong Hong Kong Data Center Industry Revenue Share (%), by Country 2024 & 2032
- Figure 6: Hong Kong Hong Kong Data Center Industry Volume Share (%), by Country 2024 & 2032
- Figure 7: North America Hong Kong Data Center Industry Revenue (Million), by Hotspot 2024 & 2032
- Figure 8: North America Hong Kong Data Center Industry Volume (K Unit), by Hotspot 2024 & 2032
- Figure 9: North America Hong Kong Data Center Industry Revenue Share (%), by Hotspot 2024 & 2032
- Figure 10: North America Hong Kong Data Center Industry Volume Share (%), by Hotspot 2024 & 2032
- Figure 11: North America Hong Kong Data Center Industry Revenue (Million), by Data Center Size 2024 & 2032
- Figure 12: North America Hong Kong Data Center Industry Volume (K Unit), by Data Center Size 2024 & 2032
- Figure 13: North America Hong Kong Data Center Industry Revenue Share (%), by Data Center Size 2024 & 2032
- Figure 14: North America Hong Kong Data Center Industry Volume Share (%), by Data Center Size 2024 & 2032
- Figure 15: North America Hong Kong Data Center Industry Revenue (Million), by Tier Type 2024 & 2032
- Figure 16: North America Hong Kong Data Center Industry Volume (K Unit), by Tier Type 2024 & 2032
- Figure 17: North America Hong Kong Data Center Industry Revenue Share (%), by Tier Type 2024 & 2032
- Figure 18: North America Hong Kong Data Center Industry Volume Share (%), by Tier Type 2024 & 2032
- Figure 19: North America Hong Kong Data Center Industry Revenue (Million), by Absorption 2024 & 2032
- Figure 20: North America Hong Kong Data Center Industry Volume (K Unit), by Absorption 2024 & 2032
- Figure 21: North America Hong Kong Data Center Industry Revenue Share (%), by Absorption 2024 & 2032
- Figure 22: North America Hong Kong Data Center Industry Volume Share (%), by Absorption 2024 & 2032
- Figure 23: North America Hong Kong Data Center Industry Revenue (Million), by Colocation Type 2024 & 2032
- Figure 24: North America Hong Kong Data Center Industry Volume (K Unit), by Colocation Type 2024 & 2032
- Figure 25: North America Hong Kong Data Center Industry Revenue Share (%), by Colocation Type 2024 & 2032
- Figure 26: North America Hong Kong Data Center Industry Volume Share (%), by Colocation Type 2024 & 2032
- Figure 27: North America Hong Kong Data Center Industry Revenue (Million), by End User 2024 & 2032
- Figure 28: North America Hong Kong Data Center Industry Volume (K Unit), by End User 2024 & 2032
- Figure 29: North America Hong Kong Data Center Industry Revenue Share (%), by End User 2024 & 2032
- Figure 30: North America Hong Kong Data Center Industry Volume Share (%), by End User 2024 & 2032
- Figure 31: North America Hong Kong Data Center Industry Revenue (Million), by Country 2024 & 2032
- Figure 32: North America Hong Kong Data Center Industry Volume (K Unit), by Country 2024 & 2032
- Figure 33: North America Hong Kong Data Center Industry Revenue Share (%), by Country 2024 & 2032
- Figure 34: North America Hong Kong Data Center Industry Volume Share (%), by Country 2024 & 2032
- Figure 35: South America Hong Kong Data Center Industry Revenue (Million), by Hotspot 2024 & 2032
- Figure 36: South America Hong Kong Data Center Industry Volume (K Unit), by Hotspot 2024 & 2032
- Figure 37: South America Hong Kong Data Center Industry Revenue Share (%), by Hotspot 2024 & 2032
- Figure 38: South America Hong Kong Data Center Industry Volume Share (%), by Hotspot 2024 & 2032
- Figure 39: South America Hong Kong Data Center Industry Revenue (Million), by Data Center Size 2024 & 2032
- Figure 40: South America Hong Kong Data Center Industry Volume (K Unit), by Data Center Size 2024 & 2032
- Figure 41: South America Hong Kong Data Center Industry Revenue Share (%), by Data Center Size 2024 & 2032
- Figure 42: South America Hong Kong Data Center Industry Volume Share (%), by Data Center Size 2024 & 2032
- Figure 43: South America Hong Kong Data Center Industry Revenue (Million), by Tier Type 2024 & 2032
- Figure 44: South America Hong Kong Data Center Industry Volume (K Unit), by Tier Type 2024 & 2032
- Figure 45: South America Hong Kong Data Center Industry Revenue Share (%), by Tier Type 2024 & 2032
- Figure 46: South America Hong Kong Data Center Industry Volume Share (%), by Tier Type 2024 & 2032
- Figure 47: South America Hong Kong Data Center Industry Revenue (Million), by Absorption 2024 & 2032
- Figure 48: South America Hong Kong Data Center Industry Volume (K Unit), by Absorption 2024 & 2032
- Figure 49: South America Hong Kong Data Center Industry Revenue Share (%), by Absorption 2024 & 2032
- Figure 50: South America Hong Kong Data Center Industry Volume Share (%), by Absorption 2024 & 2032
- Figure 51: South America Hong Kong Data Center Industry Revenue (Million), by Colocation Type 2024 & 2032
- Figure 52: South America Hong Kong Data Center Industry Volume (K Unit), by Colocation Type 2024 & 2032
- Figure 53: South America Hong Kong Data Center Industry Revenue Share (%), by Colocation Type 2024 & 2032
- Figure 54: South America Hong Kong Data Center Industry Volume Share (%), by Colocation Type 2024 & 2032
- Figure 55: South America Hong Kong Data Center Industry Revenue (Million), by End User 2024 & 2032
- Figure 56: South America Hong Kong Data Center Industry Volume (K Unit), by End User 2024 & 2032
- Figure 57: South America Hong Kong Data Center Industry Revenue Share (%), by End User 2024 & 2032
- Figure 58: South America Hong Kong Data Center Industry Volume Share (%), by End User 2024 & 2032
- Figure 59: South America Hong Kong Data Center Industry Revenue (Million), by Country 2024 & 2032
- Figure 60: South America Hong Kong Data Center Industry Volume (K Unit), by Country 2024 & 2032
- Figure 61: South America Hong Kong Data Center Industry Revenue Share (%), by Country 2024 & 2032
- Figure 62: South America Hong Kong Data Center Industry Volume Share (%), by Country 2024 & 2032
- Figure 63: Europe Hong Kong Data Center Industry Revenue (Million), by Hotspot 2024 & 2032
- Figure 64: Europe Hong Kong Data Center Industry Volume (K Unit), by Hotspot 2024 & 2032
- Figure 65: Europe Hong Kong Data Center Industry Revenue Share (%), by Hotspot 2024 & 2032
- Figure 66: Europe Hong Kong Data Center Industry Volume Share (%), by Hotspot 2024 & 2032
- Figure 67: Europe Hong Kong Data Center Industry Revenue (Million), by Data Center Size 2024 & 2032
- Figure 68: Europe Hong Kong Data Center Industry Volume (K Unit), by Data Center Size 2024 & 2032
- Figure 69: Europe Hong Kong Data Center Industry Revenue Share (%), by Data Center Size 2024 & 2032
- Figure 70: Europe Hong Kong Data Center Industry Volume Share (%), by Data Center Size 2024 & 2032
- Figure 71: Europe Hong Kong Data Center Industry Revenue (Million), by Tier Type 2024 & 2032
- Figure 72: Europe Hong Kong Data Center Industry Volume (K Unit), by Tier Type 2024 & 2032
- Figure 73: Europe Hong Kong Data Center Industry Revenue Share (%), by Tier Type 2024 & 2032
- Figure 74: Europe Hong Kong Data Center Industry Volume Share (%), by Tier Type 2024 & 2032
- Figure 75: Europe Hong Kong Data Center Industry Revenue (Million), by Absorption 2024 & 2032
- Figure 76: Europe Hong Kong Data Center Industry Volume (K Unit), by Absorption 2024 & 2032
- Figure 77: Europe Hong Kong Data Center Industry Revenue Share (%), by Absorption 2024 & 2032
- Figure 78: Europe Hong Kong Data Center Industry Volume Share (%), by Absorption 2024 & 2032
- Figure 79: Europe Hong Kong Data Center Industry Revenue (Million), by Colocation Type 2024 & 2032
- Figure 80: Europe Hong Kong Data Center Industry Volume (K Unit), by Colocation Type 2024 & 2032
- Figure 81: Europe Hong Kong Data Center Industry Revenue Share (%), by Colocation Type 2024 & 2032
- Figure 82: Europe Hong Kong Data Center Industry Volume Share (%), by Colocation Type 2024 & 2032
- Figure 83: Europe Hong Kong Data Center Industry Revenue (Million), by End User 2024 & 2032
- Figure 84: Europe Hong Kong Data Center Industry Volume (K Unit), by End User 2024 & 2032
- Figure 85: Europe Hong Kong Data Center Industry Revenue Share (%), by End User 2024 & 2032
- Figure 86: Europe Hong Kong Data Center Industry Volume Share (%), by End User 2024 & 2032
- Figure 87: Europe Hong Kong Data Center Industry Revenue (Million), by Country 2024 & 2032
- Figure 88: Europe Hong Kong Data Center Industry Volume (K Unit), by Country 2024 & 2032
- Figure 89: Europe Hong Kong Data Center Industry Revenue Share (%), by Country 2024 & 2032
- Figure 90: Europe Hong Kong Data Center Industry Volume Share (%), by Country 2024 & 2032
- Figure 91: Middle East & Africa Hong Kong Data Center Industry Revenue (Million), by Hotspot 2024 & 2032
- Figure 92: Middle East & Africa Hong Kong Data Center Industry Volume (K Unit), by Hotspot 2024 & 2032
- Figure 93: Middle East & Africa Hong Kong Data Center Industry Revenue Share (%), by Hotspot 2024 & 2032
- Figure 94: Middle East & Africa Hong Kong Data Center Industry Volume Share (%), by Hotspot 2024 & 2032
- Figure 95: Middle East & Africa Hong Kong Data Center Industry Revenue (Million), by Data Center Size 2024 & 2032
- Figure 96: Middle East & Africa Hong Kong Data Center Industry Volume (K Unit), by Data Center Size 2024 & 2032
- Figure 97: Middle East & Africa Hong Kong Data Center Industry Revenue Share (%), by Data Center Size 2024 & 2032
- Figure 98: Middle East & Africa Hong Kong Data Center Industry Volume Share (%), by Data Center Size 2024 & 2032
- Figure 99: Middle East & Africa Hong Kong Data Center Industry Revenue (Million), by Tier Type 2024 & 2032
- Figure 100: Middle East & Africa Hong Kong Data Center Industry Volume (K Unit), by Tier Type 2024 & 2032
- Figure 101: Middle East & Africa Hong Kong Data Center Industry Revenue Share (%), by Tier Type 2024 & 2032
- Figure 102: Middle East & Africa Hong Kong Data Center Industry Volume Share (%), by Tier Type 2024 & 2032
- Figure 103: Middle East & Africa Hong Kong Data Center Industry Revenue (Million), by Absorption 2024 & 2032
- Figure 104: Middle East & Africa Hong Kong Data Center Industry Volume (K Unit), by Absorption 2024 & 2032
- Figure 105: Middle East & Africa Hong Kong Data Center Industry Revenue Share (%), by Absorption 2024 & 2032
- Figure 106: Middle East & Africa Hong Kong Data Center Industry Volume Share (%), by Absorption 2024 & 2032
- Figure 107: Middle East & Africa Hong Kong Data Center Industry Revenue (Million), by Colocation Type 2024 & 2032
- Figure 108: Middle East & Africa Hong Kong Data Center Industry Volume (K Unit), by Colocation Type 2024 & 2032
- Figure 109: Middle East & Africa Hong Kong Data Center Industry Revenue Share (%), by Colocation Type 2024 & 2032
- Figure 110: Middle East & Africa Hong Kong Data Center Industry Volume Share (%), by Colocation Type 2024 & 2032
- Figure 111: Middle East & Africa Hong Kong Data Center Industry Revenue (Million), by End User 2024 & 2032
- Figure 112: Middle East & Africa Hong Kong Data Center Industry Volume (K Unit), by End User 2024 & 2032
- Figure 113: Middle East & Africa Hong Kong Data Center Industry Revenue Share (%), by End User 2024 & 2032
- Figure 114: Middle East & Africa Hong Kong Data Center Industry Volume Share (%), by End User 2024 & 2032
- Figure 115: Middle East & Africa Hong Kong Data Center Industry Revenue (Million), by Country 2024 & 2032
- Figure 116: Middle East & Africa Hong Kong Data Center Industry Volume (K Unit), by Country 2024 & 2032
- Figure 117: Middle East & Africa Hong Kong Data Center Industry Revenue Share (%), by Country 2024 & 2032
- Figure 118: Middle East & Africa Hong Kong Data Center Industry Volume Share (%), by Country 2024 & 2032
- Figure 119: Asia Pacific Hong Kong Data Center Industry Revenue (Million), by Hotspot 2024 & 2032
- Figure 120: Asia Pacific Hong Kong Data Center Industry Volume (K Unit), by Hotspot 2024 & 2032
- Figure 121: Asia Pacific Hong Kong Data Center Industry Revenue Share (%), by Hotspot 2024 & 2032
- Figure 122: Asia Pacific Hong Kong Data Center Industry Volume Share (%), by Hotspot 2024 & 2032
- Figure 123: Asia Pacific Hong Kong Data Center Industry Revenue (Million), by Data Center Size 2024 & 2032
- Figure 124: Asia Pacific Hong Kong Data Center Industry Volume (K Unit), by Data Center Size 2024 & 2032
- Figure 125: Asia Pacific Hong Kong Data Center Industry Revenue Share (%), by Data Center Size 2024 & 2032
- Figure 126: Asia Pacific Hong Kong Data Center Industry Volume Share (%), by Data Center Size 2024 & 2032
- Figure 127: Asia Pacific Hong Kong Data Center Industry Revenue (Million), by Tier Type 2024 & 2032
- Figure 128: Asia Pacific Hong Kong Data Center Industry Volume (K Unit), by Tier Type 2024 & 2032
- Figure 129: Asia Pacific Hong Kong Data Center Industry Revenue Share (%), by Tier Type 2024 & 2032
- Figure 130: Asia Pacific Hong Kong Data Center Industry Volume Share (%), by Tier Type 2024 & 2032
- Figure 131: Asia Pacific Hong Kong Data Center Industry Revenue (Million), by Absorption 2024 & 2032
- Figure 132: Asia Pacific Hong Kong Data Center Industry Volume (K Unit), by Absorption 2024 & 2032
- Figure 133: Asia Pacific Hong Kong Data Center Industry Revenue Share (%), by Absorption 2024 & 2032
- Figure 134: Asia Pacific Hong Kong Data Center Industry Volume Share (%), by Absorption 2024 & 2032
- Figure 135: Asia Pacific Hong Kong Data Center Industry Revenue (Million), by Colocation Type 2024 & 2032
- Figure 136: Asia Pacific Hong Kong Data Center Industry Volume (K Unit), by Colocation Type 2024 & 2032
- Figure 137: Asia Pacific Hong Kong Data Center Industry Revenue Share (%), by Colocation Type 2024 & 2032
- Figure 138: Asia Pacific Hong Kong Data Center Industry Volume Share (%), by Colocation Type 2024 & 2032
- Figure 139: Asia Pacific Hong Kong Data Center Industry Revenue (Million), by End User 2024 & 2032
- Figure 140: Asia Pacific Hong Kong Data Center Industry Volume (K Unit), by End User 2024 & 2032
- Figure 141: Asia Pacific Hong Kong Data Center Industry Revenue Share (%), by End User 2024 & 2032
- Figure 142: Asia Pacific Hong Kong Data Center Industry Volume Share (%), by End User 2024 & 2032
- Figure 143: Asia Pacific Hong Kong Data Center Industry Revenue (Million), by Country 2024 & 2032
- Figure 144: Asia Pacific Hong Kong Data Center Industry Volume (K Unit), by Country 2024 & 2032
- Figure 145: Asia Pacific Hong Kong Data Center Industry Revenue Share (%), by Country 2024 & 2032
- Figure 146: Asia Pacific Hong Kong Data Center Industry Volume Share (%), by Country 2024 & 2032
List of Tables
- Table 1: Global Hong Kong Data Center Industry Revenue Million Forecast, by Region 2019 & 2032
- Table 2: Global Hong Kong Data Center Industry Volume K Unit Forecast, by Region 2019 & 2032
- Table 3: Global Hong Kong Data Center Industry Revenue Million Forecast, by Hotspot 2019 & 2032
- Table 4: Global Hong Kong Data Center Industry Volume K Unit Forecast, by Hotspot 2019 & 2032
- Table 5: Global Hong Kong Data Center Industry Revenue Million Forecast, by Data Center Size 2019 & 2032
- Table 6: Global Hong Kong Data Center Industry Volume K Unit Forecast, by Data Center Size 2019 & 2032
- Table 7: Global Hong Kong Data Center Industry Revenue Million Forecast, by Tier Type 2019 & 2032
- Table 8: Global Hong Kong Data Center Industry Volume K Unit Forecast, by Tier Type 2019 & 2032
- Table 9: Global Hong Kong Data Center Industry Revenue Million Forecast, by Absorption 2019 & 2032
- Table 10: Global Hong Kong Data Center Industry Volume K Unit Forecast, by Absorption 2019 & 2032
- Table 11: Global Hong Kong Data Center Industry Revenue Million Forecast, by Colocation Type 2019 & 2032
- Table 12: Global Hong Kong Data Center Industry Volume K Unit Forecast, by Colocation Type 2019 & 2032
- Table 13: Global Hong Kong Data Center Industry Revenue Million Forecast, by End User 2019 & 2032
- Table 14: Global Hong Kong Data Center Industry Volume K Unit Forecast, by End User 2019 & 2032
- Table 15: Global Hong Kong Data Center Industry Revenue Million Forecast, by Region 2019 & 2032
- Table 16: Global Hong Kong Data Center Industry Volume K Unit Forecast, by Region 2019 & 2032
- Table 17: Global Hong Kong Data Center Industry Revenue Million Forecast, by Country 2019 & 2032
- Table 18: Global Hong Kong Data Center Industry Volume K Unit Forecast, by Country 2019 & 2032
- Table 19: Global Hong Kong Data Center Industry Revenue Million Forecast, by Hotspot 2019 & 2032
- Table 20: Global Hong Kong Data Center Industry Volume K Unit Forecast, by Hotspot 2019 & 2032
- Table 21: Global Hong Kong Data Center Industry Revenue Million Forecast, by Data Center Size 2019 & 2032
- Table 22: Global Hong Kong Data Center Industry Volume K Unit Forecast, by Data Center Size 2019 & 2032
- Table 23: Global Hong Kong Data Center Industry Revenue Million Forecast, by Tier Type 2019 & 2032
- Table 24: Global Hong Kong Data Center Industry Volume K Unit Forecast, by Tier Type 2019 & 2032
- Table 25: Global Hong Kong Data Center Industry Revenue Million Forecast, by Absorption 2019 & 2032
- Table 26: Global Hong Kong Data Center Industry Volume K Unit Forecast, by Absorption 2019 & 2032
- Table 27: Global Hong Kong Data Center Industry Revenue Million Forecast, by Colocation Type 2019 & 2032
- Table 28: Global Hong Kong Data Center Industry Volume K Unit Forecast, by Colocation Type 2019 & 2032
- Table 29: Global Hong Kong Data Center Industry Revenue Million Forecast, by End User 2019 & 2032
- Table 30: Global Hong Kong Data Center Industry Volume K Unit Forecast, by End User 2019 & 2032
- Table 31: Global Hong Kong Data Center Industry Revenue Million Forecast, by Country 2019 & 2032
- Table 32: Global Hong Kong Data Center Industry Volume K Unit Forecast, by Country 2019 & 2032
- Table 33: United States Hong Kong Data Center Industry Revenue (Million) Forecast, by Application 2019 & 2032
- Table 34: United States Hong Kong Data Center Industry Volume (K Unit) Forecast, by Application 2019 & 2032
- Table 35: Canada Hong Kong Data Center Industry Revenue (Million) Forecast, by Application 2019 & 2032
- Table 36: Canada Hong Kong Data Center Industry Volume (K Unit) Forecast, by Application 2019 & 2032
- Table 37: Mexico Hong Kong Data Center Industry Revenue (Million) Forecast, by Application 2019 & 2032
- Table 38: Mexico Hong Kong Data Center Industry Volume (K Unit) Forecast, by Application 2019 & 2032
- Table 39: Global Hong Kong Data Center Industry Revenue Million Forecast, by Hotspot 2019 & 2032
- Table 40: Global Hong Kong Data Center Industry Volume K Unit Forecast, by Hotspot 2019 & 2032
- Table 41: Global Hong Kong Data Center Industry Revenue Million Forecast, by Data Center Size 2019 & 2032
- Table 42: Global Hong Kong Data Center Industry Volume K Unit Forecast, by Data Center Size 2019 & 2032
- Table 43: Global Hong Kong Data Center Industry Revenue Million Forecast, by Tier Type 2019 & 2032
- Table 44: Global Hong Kong Data Center Industry Volume K Unit Forecast, by Tier Type 2019 & 2032
- Table 45: Global Hong Kong Data Center Industry Revenue Million Forecast, by Absorption 2019 & 2032
- Table 46: Global Hong Kong Data Center Industry Volume K Unit Forecast, by Absorption 2019 & 2032
- Table 47: Global Hong Kong Data Center Industry Revenue Million Forecast, by Colocation Type 2019 & 2032
- Table 48: Global Hong Kong Data Center Industry Volume K Unit Forecast, by Colocation Type 2019 & 2032
- Table 49: Global Hong Kong Data Center Industry Revenue Million Forecast, by End User 2019 & 2032
- Table 50: Global Hong Kong Data Center Industry Volume K Unit Forecast, by End User 2019 & 2032
- Table 51: Global Hong Kong Data Center Industry Revenue Million Forecast, by Country 2019 & 2032
- Table 52: Global Hong Kong Data Center Industry Volume K Unit Forecast, by Country 2019 & 2032
- Table 53: Brazil Hong Kong Data Center Industry Revenue (Million) Forecast, by Application 2019 & 2032
- Table 54: Brazil Hong Kong Data Center Industry Volume (K Unit) Forecast, by Application 2019 & 2032
- Table 55: Argentina Hong Kong Data Center Industry Revenue (Million) Forecast, by Application 2019 & 2032
- Table 56: Argentina Hong Kong Data Center Industry Volume (K Unit) Forecast, by Application 2019 & 2032
- Table 57: Rest of South America Hong Kong Data Center Industry Revenue (Million) Forecast, by Application 2019 & 2032
- Table 58: Rest of South America Hong Kong Data Center Industry Volume (K Unit) Forecast, by Application 2019 & 2032
- Table 59: Global Hong Kong Data Center Industry Revenue Million Forecast, by Hotspot 2019 & 2032
- Table 60: Global Hong Kong Data Center Industry Volume K Unit Forecast, by Hotspot 2019 & 2032
- Table 61: Global Hong Kong Data Center Industry Revenue Million Forecast, by Data Center Size 2019 & 2032
- Table 62: Global Hong Kong Data Center Industry Volume K Unit Forecast, by Data Center Size 2019 & 2032
- Table 63: Global Hong Kong Data Center Industry Revenue Million Forecast, by Tier Type 2019 & 2032
- Table 64: Global Hong Kong Data Center Industry Volume K Unit Forecast, by Tier Type 2019 & 2032
- Table 65: Global Hong Kong Data Center Industry Revenue Million Forecast, by Absorption 2019 & 2032
- Table 66: Global Hong Kong Data Center Industry Volume K Unit Forecast, by Absorption 2019 & 2032
- Table 67: Global Hong Kong Data Center Industry Revenue Million Forecast, by Colocation Type 2019 & 2032
- Table 68: Global Hong Kong Data Center Industry Volume K Unit Forecast, by Colocation Type 2019 & 2032
- Table 69: Global Hong Kong Data Center Industry Revenue Million Forecast, by End User 2019 & 2032
- Table 70: Global Hong Kong Data Center Industry Volume K Unit Forecast, by End User 2019 & 2032
- Table 71: Global Hong Kong Data Center Industry Revenue Million Forecast, by Country 2019 & 2032
- Table 72: Global Hong Kong Data Center Industry Volume K Unit Forecast, by Country 2019 & 2032
- Table 73: United Kingdom Hong Kong Data Center Industry Revenue (Million) Forecast, by Application 2019 & 2032
- Table 74: United Kingdom Hong Kong Data Center Industry Volume (K Unit) Forecast, by Application 2019 & 2032
- Table 75: Germany Hong Kong Data Center Industry Revenue (Million) Forecast, by Application 2019 & 2032
- Table 76: Germany Hong Kong Data Center Industry Volume (K Unit) Forecast, by Application 2019 & 2032
- Table 77: France Hong Kong Data Center Industry Revenue (Million) Forecast, by Application 2019 & 2032
- Table 78: France Hong Kong Data Center Industry Volume (K Unit) Forecast, by Application 2019 & 2032
- Table 79: Italy Hong Kong Data Center Industry Revenue (Million) Forecast, by Application 2019 & 2032
- Table 80: Italy Hong Kong Data Center Industry Volume (K Unit) Forecast, by Application 2019 & 2032
- Table 81: Spain Hong Kong Data Center Industry Revenue (Million) Forecast, by Application 2019 & 2032
- Table 82: Spain Hong Kong Data Center Industry Volume (K Unit) Forecast, by Application 2019 & 2032
- Table 83: Russia Hong Kong Data Center Industry Revenue (Million) Forecast, by Application 2019 & 2032
- Table 84: Russia Hong Kong Data Center Industry Volume (K Unit) Forecast, by Application 2019 & 2032
- Table 85: Benelux Hong Kong Data Center Industry Revenue (Million) Forecast, by Application 2019 & 2032
- Table 86: Benelux Hong Kong Data Center Industry Volume (K Unit) Forecast, by Application 2019 & 2032
- Table 87: Nordics Hong Kong Data Center Industry Revenue (Million) Forecast, by Application 2019 & 2032
- Table 88: Nordics Hong Kong Data Center Industry Volume (K Unit) Forecast, by Application 2019 & 2032
- Table 89: Rest of Europe Hong Kong Data Center Industry Revenue (Million) Forecast, by Application 2019 & 2032
- Table 90: Rest of Europe Hong Kong Data Center Industry Volume (K Unit) Forecast, by Application 2019 & 2032
- Table 91: Global Hong Kong Data Center Industry Revenue Million Forecast, by Hotspot 2019 & 2032
- Table 92: Global Hong Kong Data Center Industry Volume K Unit Forecast, by Hotspot 2019 & 2032
- Table 93: Global Hong Kong Data Center Industry Revenue Million Forecast, by Data Center Size 2019 & 2032
- Table 94: Global Hong Kong Data Center Industry Volume K Unit Forecast, by Data Center Size 2019 & 2032
- Table 95: Global Hong Kong Data Center Industry Revenue Million Forecast, by Tier Type 2019 & 2032
- Table 96: Global Hong Kong Data Center Industry Volume K Unit Forecast, by Tier Type 2019 & 2032
- Table 97: Global Hong Kong Data Center Industry Revenue Million Forecast, by Absorption 2019 & 2032
- Table 98: Global Hong Kong Data Center Industry Volume K Unit Forecast, by Absorption 2019 & 2032
- Table 99: Global Hong Kong Data Center Industry Revenue Million Forecast, by Colocation Type 2019 & 2032
- Table 100: Global Hong Kong Data Center Industry Volume K Unit Forecast, by Colocation Type 2019 & 2032
- Table 101: Global Hong Kong Data Center Industry Revenue Million Forecast, by End User 2019 & 2032
- Table 102: Global Hong Kong Data Center Industry Volume K Unit Forecast, by End User 2019 & 2032
- Table 103: Global Hong Kong Data Center Industry Revenue Million Forecast, by Country 2019 & 2032
- Table 104: Global Hong Kong Data Center Industry Volume K Unit Forecast, by Country 2019 & 2032
- Table 105: Turkey Hong Kong Data Center Industry Revenue (Million) Forecast, by Application 2019 & 2032
- Table 106: Turkey Hong Kong Data Center Industry Volume (K Unit) Forecast, by Application 2019 & 2032
- Table 107: Israel Hong Kong Data Center Industry Revenue (Million) Forecast, by Application 2019 & 2032
- Table 108: Israel Hong Kong Data Center Industry Volume (K Unit) Forecast, by Application 2019 & 2032
- Table 109: GCC Hong Kong Data Center Industry Revenue (Million) Forecast, by Application 2019 & 2032
- Table 110: GCC Hong Kong Data Center Industry Volume (K Unit) Forecast, by Application 2019 & 2032
- Table 111: North Africa Hong Kong Data Center Industry Revenue (Million) Forecast, by Application 2019 & 2032
- Table 112: North Africa Hong Kong Data Center Industry Volume (K Unit) Forecast, by Application 2019 & 2032
- Table 113: South Africa Hong Kong Data Center Industry Revenue (Million) Forecast, by Application 2019 & 2032
- Table 114: South Africa Hong Kong Data Center Industry Volume (K Unit) Forecast, by Application 2019 & 2032
- Table 115: Rest of Middle East & Africa Hong Kong Data Center Industry Revenue (Million) Forecast, by Application 2019 & 2032
- Table 116: Rest of Middle East & Africa Hong Kong Data Center Industry Volume (K Unit) Forecast, by Application 2019 & 2032
- Table 117: Global Hong Kong Data Center Industry Revenue Million Forecast, by Hotspot 2019 & 2032
- Table 118: Global Hong Kong Data Center Industry Volume K Unit Forecast, by Hotspot 2019 & 2032
- Table 119: Global Hong Kong Data Center Industry Revenue Million Forecast, by Data Center Size 2019 & 2032
- Table 120: Global Hong Kong Data Center Industry Volume K Unit Forecast, by Data Center Size 2019 & 2032
- Table 121: Global Hong Kong Data Center Industry Revenue Million Forecast, by Tier Type 2019 & 2032
- Table 122: Global Hong Kong Data Center Industry Volume K Unit Forecast, by Tier Type 2019 & 2032
- Table 123: Global Hong Kong Data Center Industry Revenue Million Forecast, by Absorption 2019 & 2032
- Table 124: Global Hong Kong Data Center Industry Volume K Unit Forecast, by Absorption 2019 & 2032
- Table 125: Global Hong Kong Data Center Industry Revenue Million Forecast, by Colocation Type 2019 & 2032
- Table 126: Global Hong Kong Data Center Industry Volume K Unit Forecast, by Colocation Type 2019 & 2032
- Table 127: Global Hong Kong Data Center Industry Revenue Million Forecast, by End User 2019 & 2032
- Table 128: Global Hong Kong Data Center Industry Volume K Unit Forecast, by End User 2019 & 2032
- Table 129: Global Hong Kong Data Center Industry Revenue Million Forecast, by Country 2019 & 2032
- Table 130: Global Hong Kong Data Center Industry Volume K Unit Forecast, by Country 2019 & 2032
- Table 131: China Hong Kong Data Center Industry Revenue (Million) Forecast, by Application 2019 & 2032
- Table 132: China Hong Kong Data Center Industry Volume (K Unit) Forecast, by Application 2019 & 2032
- Table 133: India Hong Kong Data Center Industry Revenue (Million) Forecast, by Application 2019 & 2032
- Table 134: India Hong Kong Data Center Industry Volume (K Unit) Forecast, by Application 2019 & 2032
- Table 135: Japan Hong Kong Data Center Industry Revenue (Million) Forecast, by Application 2019 & 2032
- Table 136: Japan Hong Kong Data Center Industry Volume (K Unit) Forecast, by Application 2019 & 2032
- Table 137: South Korea Hong Kong Data Center Industry Revenue (Million) Forecast, by Application 2019 & 2032
- Table 138: South Korea Hong Kong Data Center Industry Volume (K Unit) Forecast, by Application 2019 & 2032
- Table 139: ASEAN Hong Kong Data Center Industry Revenue (Million) Forecast, by Application 2019 & 2032
- Table 140: ASEAN Hong Kong Data Center Industry Volume (K Unit) Forecast, by Application 2019 & 2032
- Table 141: Oceania Hong Kong Data Center Industry Revenue (Million) Forecast, by Application 2019 & 2032
- Table 142: Oceania Hong Kong Data Center Industry Volume (K Unit) Forecast, by Application 2019 & 2032
- Table 143: Rest of Asia Pacific Hong Kong Data Center Industry Revenue (Million) Forecast, by Application 2019 & 2032
- Table 144: Rest of Asia Pacific Hong Kong Data Center Industry Volume (K Unit) Forecast, by Application 2019 & 2032
Frequently Asked Questions
1. What is the projected Compound Annual Growth Rate (CAGR) of the Hong Kong Data Center Industry?
The projected CAGR is approximately 21.06%.
2. Which companies are prominent players in the Hong Kong Data Center Industry?
Key companies in the market include China Mobile International Ltd, Equinix Inc, Rackspace Technology Inc, Zenlayer Inc5 4 LIST OF COMPANIES STUDIE, Vantage Data Centers LLC, SuneVision Holdings Ltd, Digital Realty Trust Inc, AirTrunk Operating Pty Ltd, Hostdime, BDx Data Center Pte Ltd, Global Switch Holdings Limited, NTT Ltd.
3. What are the main segments of the Hong Kong Data Center Industry?
The market segments include Hotspot, Data Center Size, Tier Type, Absorption, Colocation Type, End User.
4. Can you provide details about the market size?
The market size is estimated to be USD XX Million as of 2022.
5. What are some drivers contributing to market growth?
Rise of E-Commerce; Flourishing Startup Culture.
6. What are the notable trends driving market growth?
OTHER KEY INDUSTRY TRENDS COVERED IN THE REPORT.
7. Are there any restraints impacting market growth?
Slow Penetration Rate in Developing Countries.
8. Can you provide examples of recent developments in the market?
November 2022: The company had announced the opening of its new regional office in Kowloon, Hong Kong. The office would help the company strengthen its expansion, and would cater business needs such as engineering, construction, and sales in the APAC region.November 2022: The company announced the launch of BDx Indonesia, following the completion of a USD 300 million joint venture agreement with PT Indosat Tbk (Indosat Ooredoo Hutchison or IOH) and PT Aplikanusa Lintasarta, Big Data Exchange (BDx).August 2022: Global Switch announced plans of selling its announced plans of selling its USD11 billion business. The companies which plan to purchase the business are EQR, PAG, KKR, Gaw Capital and Stonepeak.
9. What pricing options are available for accessing the report?
Pricing options include single-user, multi-user, and enterprise licenses priced at USD 3800, USD 4500, and USD 5800 respectively.
10. Is the market size provided in terms of value or volume?
The market size is provided in terms of value, measured in Million and volume, measured in K Unit.
11. Are there any specific market keywords associated with the report?
Yes, the market keyword associated with the report is "Hong Kong Data Center Industry," which aids in identifying and referencing the specific market segment covered.
12. How do I determine which pricing option suits my needs best?
The pricing options vary based on user requirements and access needs. Individual users may opt for single-user licenses, while businesses requiring broader access may choose multi-user or enterprise licenses for cost-effective access to the report.
13. Are there any additional resources or data provided in the Hong Kong Data Center Industry report?
While the report offers comprehensive insights, it's advisable to review the specific contents or supplementary materials provided to ascertain if additional resources or data are available.
14. How can I stay updated on further developments or reports in the Hong Kong Data Center Industry?
To stay informed about further developments, trends, and reports in the Hong Kong Data Center Industry, consider subscribing to industry newsletters, following relevant companies and organizations, or regularly checking reputable industry news sources and publications.
Methodology
Step 1 - Identification of Relevant Samples Size from Population Database


Step 2 - Approaches for Defining Global Market Size (Value, Volume* & Price*)

Note*: In applicable scenarios
Step 3 - Data Sources
Primary Research
- Web Analytics
- Survey Reports
- Research Institute
- Latest Research Reports
- Opinion Leaders
Secondary Research
- Annual Reports
- White Paper
- Latest Press Release
- Industry Association
- Paid Database
- Investor Presentations

Step 4 - Data Triangulation
Involves using different sources of information in order to increase the validity of a study
These sources are likely to be stakeholders in a program - participants, other researchers, program staff, other community members, and so on.
Then we put all data in single framework & apply various statistical tools to find out the dynamic on the market.
During the analysis stage, feedback from the stakeholder groups would be compared to determine areas of agreement as well as areas of divergence


